CellBio
Vol.3 No.2(2014), Article
ID:46592,7
pages
DOI:10.4236/cellbio.2014.32005
Cell Development in Primary Culture of Porcine Bone Marrow
Zaven Karalyan, Lusine Simonyan, Alla Misakyan, Liana Abroyan, Lina Hakobyan, Aida Avetisyan, David Saroyan
Laboratory of Cell Biology, Institute of Molecular Biology of NAS, Yerevan, Armenia
Email: zkaralyan@yahoo.com
Copyright © 2014 by authors and Scientific Research Publishing Inc.
This work is licensed under the Creative Commons Attribution International License (CC BY).
http://creativecommons.org/licenses/by/4.0/


Received 24 March 2014; revised 23 April 2014; accepted 3 May 2014
ABSTRACT
The primary culture bone marrow (PCBM) cells are often used in different cytological investigations. Here we study the behavior of porcine unstimulated PCBM cells during the cultivation. DNA cytophotometry analyses revealed that immature white blood cells (WBC) such as lymphoblasts, monoblasts and myeloid cells during cultivation process reduced the DNA content in the nuclei. This resulted in displacement of the DNA histogram to the left and increased the content of diploid nuclei. This is a result of cells unblocking which are in G2 cell cycle phase. We also observed diploid pathological cells with accessory or fragmentized nuclei. However, the data with erythroid cells (EC) somehow demonstrate the opposite tendency. During the late stage of cultivation, the number of immature EC with the tetraploid DNA is increased.
Keywords:Cell Development

1. Introduction
The bone marrow (BM) mixed, unstimulated cells have very short duration of life, often used by different cytological and virological researches. They are a suitable model for determining the differentiation and development of the various hemoand immunopoetic cells [1] [2] . Morphologically BM cells are usually detected with the help of Giemsa staining. In the human it has been shown that cytophotometric investigations can be useful for the detection of BM cell physiology and cell differentiation [3] [4] . Very little is known about swine BM in the culture research. Here, in this study we examine and give a detail description of the changes that take place in the primary porcine BM culture during the cultivation. Apparently the pool excreted from the porcine BM hemoand immunopoietic cells were very heterogenic. Besides the hemopoietic cells, it includes cellular elements of the lymphoand myelopoiesis [5] . The mechanism of acquired alterations of immunoand erythropoiesis has been the subject of countless publications [6] [7] . However, no study so far has addressed the DNA level changes of erythroid and immune cells differentiation during cultivation. The regulation of bone marrow cells endomitosis has been studied almost exclusively in vivo using Feulgen staining or flow cytometry of bone marrow. These studies usually have shown that both cell ploidy and the number of cells increase or decrease in response to a respective greater or lesser stress. But ploidy is a unique characteristic of all types of cells, changes in ploidy should provide an excellent marker for the identification of cellular variation and differentiation pattern [8] . This report describes a new approach by which bone marrow cells may be studied in vitro. The BM culture population, composition changes, their survival rate as well as the distribution of the early forms of the BM to the ploidy classes are emphasized.
2. Materials and Methods
The primary culture of bone marrow (PCBM). The porcine PCBM was obtained from the femoral bones of 6 healthy, 6 to 8 weeks old piglets. Using previously established method described by Lajhta [5] , the data in which they study human BM unstimulated culture. The initial amount of the cells we used for each experiment were 106 cells/ml. Cells were cultured in the RPMI 1640 supplemented with 10% fetal bovine serum, L-glutamine and 2% penicillin-streptomycin (SIGMA), at 37˚C incubator in the atmosphere of CO2 [2] . For various experiments cells were examined at 24, 48, 72 and 96 hours post cultivation.
Microscopic analysis. PCBM cells smeared on a glass slides were fixed with 100% methanol and stained by Giemsa modified solution (azure B/azure II, eosin and methylene blue) according to the manufacturer’s protocol (Sigma-Aldrich). Subsequently cells were examined under the light microscope and images were collected randomly at the 1250× magnification. At least 200 nucleated cells in every experiment were analyzed. The cell sizes and morphologic characteristics were evaluated as described previously [9] .
DNA ploidy analyses. DNA content is expressed on a “c” scale, in which 1c is the haploid amount of nuclear DNA seen in normal (non-pathological) diploid populations in G0/G1. DNA cytophotometric measurements identify nuclei as aneuploid if they deviate more than 10% from 2c, 4c, 8c, or 16c; i.e. if they are outside 2c ± 0.2, 4c ± 0.4, 8c ± 0.8, or 16c ± 1.6. The total number of all cells in euploid regions of the DNA histogram rescaled by the mean corrective factor (1.8c - 2.2c, 3.6c - 4.4c, 7.2c - 8.8c, and 14.4c - 17.6c) was also calculated. The ploidy status of cells was determined by the amount of DNA expressed as the DNA index (DI). Swine unstimulated lymphocytes were used as a diploid standard for DNA measurement. Cytophotometry of standards showed that the variability of DNA content did not exceed 10% [9] .
Animal euthanasia. Euthanasia was done according to Guide for the Care and Use of Laboratory Animals, AVMA Guidelines on euthanasia and local guideline for animal care and use (Institutional Review Board/Independent Ethics Committee of the Institute of Molecular Biology of NAS, IRB00004079). For effective euthanasia container was filled with CO2 gradually and used constant exposure of 75% - 80% carbon dioxide for 15 minutes.
Statistical analysis. All experiments were repeated 3 times and statistical analyses were performed using the Student’s t test. SPSS version 14.0 software package (SPSS Inc., Chicago, IL, USA).
3. Results
Morphological parameters of erythroid cells in the culture of human bone marrow were first described in detail, by Lajhta [5] . We use similar approach to study the swine culture of unstimulated bone marrow cells during the early stage of cultivation, from 24 to 96 hours. The changes in the population structure of the nucleated cells of swine PCBM is shown in Table1 At the first 24 hours after cultivation only 50% of hemoand immunopoetic cells were alive, among mentioned 50% the population of the white blood cell (WBC) elements was predominant about 35% and the population of erythroid cells (EC) was about 15%. During the process of cultivation from 24 to 96 hours the percentage of live cells decreased more than three times. At 96 hours of cultivation the population of live cells were only 17%, of which about 11% were WBC and the approximately 5% were nucleated EC.
Although at the initial stage of cultivation we observed certain mitosis in the culture, however they disappeared after 48 - 72 hours post cultivation. During the cultivation we observed steady destruction in both WBC and EC. The higher percentage destructed cells were observed in all types of the immature cells compare to those of differentiated cells. While, total number of immature WBC reduced about six times, during cultivation

Table 1 . Quantitative analyses of PCBM during cultivation period from 24 to 96 hours (%).
*significant decrease compared with control (p < 0.05 - 0.001). **significant increase compared with control (p < 0.05 - 0.001).
period. The all type bone marrow differentiated cells number reduced only about three times. At the beginning of cultivation differentiated WBC were about 29% their number strongly decreased after 96 hours and were about 10% (Table 1).
Similar phenomenon was observed in the erythroid cells. At the 24 hours the early cells, the erythropoiesis precursors (proerythroblasts) were about 3% and after 96 hours their number progressively vanished from the culture remaining only 0.2%. However, late erythroblasts such as polichromatophils or ortochroms were more viable. These cells together with differentiated white blood cells such as lymphocytes, neutrophils and eosinophils compose the main cells population of the primary unstimulated swine BM culture after 96 hours from the cultivation (Table 1). Representative images of normal PCBM cells collected at 48 hours are presented in Figure 1.
We have previously demonstrated the presence of atypical lymphocytes with additional nuclei in the primary culture of unstimulated swine BM in the later stages of cultivation [9] . Interestingly in the present experiment, we have identified not only atypical lymphocytes but erythroblasts as well, on the 48 hours of cultivation (Figure 2(D)), although the number of such cells did not exceed 0.5% of the total cell population. During the cultivation of PCBM over 48 hours we also noted the appearance of various cells with abnormal nuclei (Figures 2(A)-(D)). It is worth to mention that pathological changes of primary erythroblasts described often in mammalian bone marrow [5] . However, we also identified and presented degenerative forms of neutrophils (Figure 2(C)). As expected, when we measure the content of DNA in the nuclei of abnormal cells it did not exceed 2c.
DNA ploidy analyzes. Then, we analyzed DNA amount of PCBM cells in different stage of cultivation at 24, 48, 72 and 96 hours. As shown in Figure 3 the WBC differentiated cells, (Figures 3(A)-(C)) as well as late erythroblasts, (Figure 3(G)) are diploid (2c). While immature cells such as lymphoblasts (Figure 3(D)), monoblasts (Figure 3(E)), mieloid cells Figure 3(F)), big-basophil erythroblasts (Figure 3(H)) and proerythroblasts (Figure 3(I)) are existed with diploid, hyperdiploid and tetraploid nuclei. Minor population in monocytes was observed to be hyperdiploid cells (less than 5%). Notably only the monoblasts population contained the higher rate of DNA (hypertetraploid) during the first day of cultivation, which were about 10% Figure 3(E). Meanwhile hypertetraploid cells were detected in proerythroblasts during the all cultivation period (Figure 3(I)). In general all early forms of PCBM may contain the tetraploid DNA amount. During cultivation the number of tetraploid lymphoblasts decreases, and diploid lymphoblasts increased. And after 96 hours the lymphoblasts main mass consist of diploid cells (about 70%) and the number of tetraploid cells is only 10% (Figure 3(D)).

Figure 1. Normal PCBM cells at the 48 hours of cultivation. (A) From above to below: lymphoblast, monoblast, lymphocyte; (B) From above to below: polychromatophil erythroblasts, monocyte; (C) From above to below: myeloid cell, lymphocyte; (D) Basophil erythroblast; (E) From the left to the right oxiphil erythroblast, band neutrophil; (F) Eosinophil; (G) Late erythroblasts; (H) Above: proerythroblast. Cells were stained with Giemsa. Barr 10 µm.
The monoblasts (Figure 3(E)) basically consist of diploid and hyperdiploid cells and the tetraploid cell number is only 10% of the population but unlike lymphoblasts the also 10% of their population are hypertetraploid cells. After 48 hours the tetrapliod cell number reaches 20% and hypertetraploid cells completely vanish. After 72 and 96 hours of cultivation diand triploid monoblasts are survived and tetraploid monoblasts completely vanished Figure 3(E). For myeloid cells (Figure 3(F)) at 24 hours the DNA content is the following. The 30% of the cells are diand triploid, 40% of the cells are tetraploid. After 48 hours the 60% of the cell population are diploid, while tetraploid myeloid cells are disappeared at all. After 72 and 96 hours of cultivation only diploid cells are exist with the higher rate.
Analysis of the EC cells for DNA ploidy classes has shown slightly different patterns (Figure 3(I)). At 24 hours of cultivation 20% of the proerythroblasts existed in diploid, triploid and tetraploid and the 40% are hypertetraploid cells (Figure 3(I)). After 48 hours the number of diploid and hypertetraploid proerythroblasts decreases about two times and the number of the cells in the G2 phase of mitotic cycle correspondingly increases. Already to 72 hours diploid proeritroblasts completely disappear, the number of triploid cells is 50% of the population, while the percentage of the tetraploid and hypertetraploid cell number decreased by 96 hours the main part of the population which are present in the G2 phase and correspondingly the proportion of the triploid
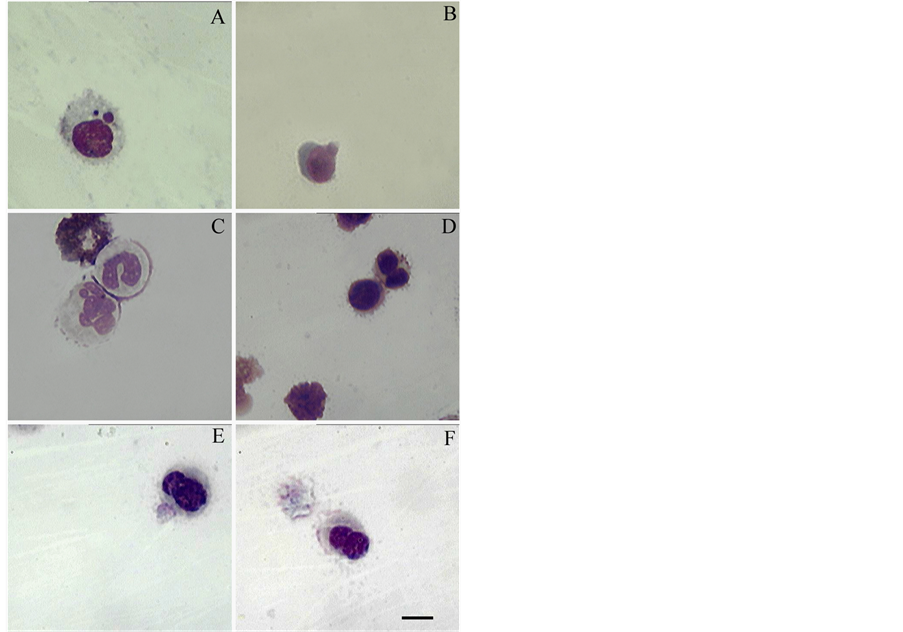
Figure 2. Atypical cells with accessory or fragmentized nuclei. (A) and (B) Lymphocytes, 48 h of cultivation; (C) From above to below: destroyed cell, band neutrophil, hypersegmented neutrophil, 48 h of cultivation; (D) From above to below: late binucleate erythroblast, oxiphil erythroblast and destroyed cells, 48 h of cultivation; (E) Lymphocyte 72 h of cultivation; (F) Lymphocyte 96 h of cultivation. Cells were stained with Giemsa. Barr 10 µm.
and hypertetraploid cells are only 15% of the population.
Similar to the proerythroblasts the diploid big basophilic erythroblasts are found only on the 24 and 48 hours of cultivation, and if the first day the diploid and triploid cells are distributed equally then by 48 hours of cultivation the main mass of the cells constitute triploid (about 80%). Already at 72 hours the all population of the cells are hyperdipliod (triploid) they are in the process of DNA synthesis (Figure 3(H)). After 96 hours all basophilic erythroblasts are tetraploid. Consequently the DNA reduplication time in the proliferate erythroid cells of the PCBM is about 24 - 36 hours.
4. Discussion
The reason for the greater lability of early cells may be explained in two ways. It could be because they are less stabile or of their maturation-differentiation. However, the decline in the number of immature cells through their differentiation within 96 hours makes it less likely, since the differentiation of immature cells in primary cultures of unstimulated cells usually takes relatively longer period [1] .
The appearance of abnormal cells during cultivation of primary culture bone marrow at 48 to 96 hours is due to culture condition, they are unstimulated and growth factors are absent.
The important data were obtained by analyzing the distribution of the nucleus of PCBM cells by DNA ploidy classes. Among the all WBC cells, we identified only a small population of monoblasts that containing hypertetraploid amount of DNA. This population was observed only at the 24 hours and they disappear at the later stage of cultivation.

Figure 3. Distribution of the investigated cell nuclei by the DNA ploidy classes. (A) Lymphocytes; (B) Monocytes; (C) Neutrophils; (D) Lymphoblasts; (E) Monoblasts; (F) Mieloid cells; (G) Late erythroblasts; (H) Basophil erythroblasts; (I) Proerythroblasts.
In general, DNA synthesis for early monocyte series (monoblasts, promonotcyts and monocytes) is obvious phenomenon at in vitro [10] . Moreover, the earliest forms of monocytic cells contain predominantly either hyperdiploid or tetraploid amount of DNA in the nucleus [10] .
Van Furth, also described in the above mentioned paper that the timing of the cell cycle in promonocytes (monoblasts) is about 13 to 14 hours. Therefore, DNA synthesis of the cells of monocytic series that could not reach the G2 phase forms the population hypertetraploid cells.
Analyzing the distribution of the nuclei by ploidy classes, in the basic cell culture of bone marrow it was obvious that, immature white blood cells (lymphoblasts, monoblasts, and myeloid cells) during cultivation process reduced the DNA content in the nuclei. This is the reason of the displacement of the DNA histogram to the left and increasing the content of diploid nuclei. This is of course a result of cells unblocking, which are in G2 cell cycle phase. Similar changes were described in short-term culture of human leukemic cells [11] .
The EC cells however demonstrate the opposite tendency. With the longer cultivation time, the number of cells with the tetraploid DNA is increased. Without any doubts, this is the result of blocking cells in G2 cell cycle phase.
The reason of the different behavior of WBC and EC cells could be different ways of their growth function in the PCBM.
As a consequence of changes in the distribution of DNA content in the nuclei of erythroid cells coincide approximately with the data on the cell cycle in a variety of mammalian cells, however, the mitotic cycle of erythroid cells in porcine PCBM moderately slow like human PCBM.
So in human the cell cycle is about twenty four hours and S is twelve to fourteen hours [12] ; in the dogs, the cycle is reported to be nine to ten hours [13] and the S period six to seven hours. In this case, our data which we have shown an incomplete cell cycle are essentially a block of erythroid cells in G2 phase. The latter is likely because of the destruction of erythroblastic islands during isolation of PCBM. As described by [14] , direct contact with the macrophages was necessary for this enhanced erythroblast proliferation (including the proliferating erythroblasts: proerythroblasts and basophilic erythroblasts), which resulted from decreased transit time in the G0/G1 phase of cells. Moreover, culturing erythroblasts in the absence of macrophages results in a dramatic decrease in proliferation, maturation, and enucleation, and as a result these cells blocked in G2 [15] .
The myelopoetic cells don’t need macrophages to regulate their cell cycle and that’s why they can complete it. The lymphoid cells ability to division in the in vitro conditions is known for a long time [16] [17] .
References
- Dexter, T.M., Allen, T.D. and Lajtha, L.G. (1977) Conditions Controlling the Proliferation of Haemopoietic Stem Cells in Vitro. Journal of Cellular Physiology, 91, 335-344. http://dx.doi.org/10.1002/jcp.1040910303
- Diamandopoulos, G.T. (1994) Human Myelopoiesis in Culture of Liquid Medium Lacking Colony Stimulating Factors: Therapeutic Implications for Cancer Patients with Leukopenia. Anticancer Research, 14, 1695-1702.
- Maccari, A., Donti, G.V., Rizzo, M.T., Paltriccia, R., Tabilio, A. and Donti, E. (1991) In Vitro Bone Marrow Cell Culture and Cytogenetic Analysis in a Case of Myelodysplasia. Cancer Genetics and Cytogenetics, 56, 203-207. http://dx.doi.org/10.1016/0165-4608(91)90172-Q
- Hernández, J.M., Gutiérrez, N.C., Almeida, J., García, J.L., Sánchez, M.A., Mateo, G., Ríos, A. and San Miguel, J.F. (1998) IL-4 Improves the Detection of Cytogenetic Abnormalities in Multiple Myeloma and Increases the Proportion of Clonally Abnormal Metaphases. British Journal of Haematology, 103, 163-167. http://dx.doi.org/10.1046/j.1365-2141.1998.00951.x
- Lajhta, L.G. (1952) Culture of Human Bone Marrow in Vitro. The Reversibility between Normoblastic and Megaloblastic Series of Cells. Journal of Clinical Pathology, 2, 67-85.
- Garderet, L., Kobari, L., Mazurier, C., De Witte, C., Giarratana, M.C., Pérot, C., Gorin, N.C., Lapillonne, H. and Douay, L. (2010) Unimpaired Terminal Erythroid Differentiation and Preserved Enucleation Capacity in Myelodysplastic 5q(del) Clones: A Single Cell Study. Haematologica, 95, 398-405. http://dx.doi.org/10.3324/haematol.2009.012773
- Giarratana, M.C., Kobari, L., Lapillonne, H., Chalmers, D., Kiger, L., Cynober, T., Marden, M.C., Wajcman, H. and Douay, L. (2005) Ex Vivo Generation of Fully Mature Human Red Blood Cells from Hematopoietic Stem Cells. Nature Biotechnology, 23, 69-74. http://dx.doi.org/10.1038/nbt1047
- Skinner, A.M., Grompe, M. and Kurre, P. (2012) Intra-Hematopoietic Cell Fusion as a Source of Somatic Variation in the Hematopoietic System. Journal of Cell Science, 125, 2837-2843. http://dx.doi.org/10.1242/jcs.100123
- Karalova, E.M., Sargsyan, Kh.V., Hampikian, G.K., Voskanyan, H.E., Abroyan, L.O., Avetisyan, A.S., Hakobyan, L.A., Arzumanyan, H.H., Zakaryan, H.S. and Karalyan, Z.A. (2011) Phenotypic and Cytologic Studies of Lymphoid Cells and Monocytes in Primary Culture of Porcine Bone Marrow during Infection of African Swine Fever Virus. In Vitro Cellular & Developmental Biology-Animal, 47, 200-204. http://dx.doi.org/10.1007/s11626-010-9380-5
- Van Furth, R. (1970) Origin and Kinetics of Monocytes and Macrophages. Seminars in Hematology, 7, 125-141.
- Weh, H.J., von Paleske, A. and Hossfeld, D.K. (1983) Disappearance of Hypotetraploid Clones after Short-Term Culture of Leukemic Cells. A Case Report. Cancer Genetics and Cytogenetics, 10, 237-240. http://dx.doi.org/10.1016/0165-4608(83)90051-1
- Strychmans, P., Cronkite, E.P., Fache, J., Fliedner, T.M. and Ramos, J. (1966) Deoxyribonucleic Acid Synthesis Time of Erythropoietic and Granulopoietic Cells in Human Beings. Nature, 13, 717-720. http://dx.doi.org/10.1038/211717a0
- Bond, V.P., Odartchenko, N., Cottier, H., Feinendegen, L.E. and Cronkite, E.P. (1962) The Kinetics of the More Mature Erythrocytic Precursors Studied with Tritiated Thymidine. In: Jacobson, I.O. and Doyle, M., Eds., Grune and Stratton, New York, 173-183.
- Rhodes, M.M., Kopsombut, P., Bondurant, M.C., Price, J.O. and Koury, M.J. (2008) Adherence to Macrophages in Erythroblastic Islands Enhances Erythroblast Proliferation and Increases Erythrocyte Production by a Different Mechanism than Erythropoietin. Blood, 111, 1700-1708. http://dx.doi.org/10.1182/blood-2007-06-098178
- Chasis, J.A. and Mohandas, N. (2008) Erythroblastic Islands: Niches for Erythropoiesis. Blood, 112, 470-478. http://dx.doi.org/10.1182/blood-2008-03-077883
- Steinman, R.M., Machtinger, B.G., Fried, J. and Cohn, Z.A. (1978) Mouse Spleen Lymphoblasts Generated in Vitro. Recovery in High Yield and Purity after Floatation in Dense Bovine Plasma Albumin Solutions. The Journal of Experimental Medicine, 147, 279-296. http://dx.doi.org/10.1084/jem.147.2.279
- Steinman, R.M., Blumencranz, J.S., Machtinger, G.B., Fried, J. and Cohn, Z.A. (1978) Mouse Spleen Lymphoblasts Generated in Vitro. The Journal of Experimental Medicine, 147, 297-315. http://dx.doi.org/10.1084/jem.147.2.297