Computational Molecular Bioscience
Vol.1 No.1(2011), Article ID:16496,10 pages DOI:10.4236/cmb.2011.11002
Chemoinformatic Approaches for Inhibitors of DNA Methyltransferases: Comprehensive Characterization of Screening Libraries
Torrey Pines Institute for Molecular Studies, SW Village Parkway, Port St. Lucie, USA
E-mail: *jmedina@tpims.org
Received November 2, 2011; revised November 28, 2011; accepted December 15, 2011
Keywords: Chemical Space, Epigenetics, Fingerprints, Natural Products, Scaffold Analysis, Shannon Entropy
Abstract
Virtual screening of compound databases is a promising approach to identify inhibitors of DNA methyltransferases and other epigenetic targets. An important first step before conducting virtual screening is to characterize the structural diversity and chemical space coverage of the screening collections. Herein, we report a comprehensive chemoinformatic characterization of novel screening libraries, including a focused collection directed to inhibitors of DNA methyltransferases (DNMTs), and two natural product databases. The compound databases were assessed in terms of physicochemical properties, molecular scaffolds, and fingerprints. As part of the scaffold diversity analysis, a recently developed method, based on Shannon Entropy, was used. The overall approach enabled the analysis of property space coverage, degree of overlap between collections, scaffold and structural diversity. Overall, the analysis of the distribution of physicochemical properties indicates that the DNMT focused library and the two natural products collections have molecules with properties similar to approved drugs. Moreover, the natural products databases analyzed in this work have different chemical structures from approved drugs and synthetic databases and therefore are attractive for virtual screening for DNMT inhibitors. The scaffold analysis revealed that the focused library has, overall, the largest scaffold diversity and that the most frequent scaffolds are not identified in the other analyzed collections. Therefore, the focused library is also attractive to perform virtual and experimental screening for novel inhibitors. This study represents a first step towards the virtual screening of novel compound databases to identify inhibitors of DNMTs. Results of this study are general and can be used for the virtual screening of the compound databases against targets directed to other therapeutic applications.
1. Introduction
Inhibitors of DNMT are relevant for the treatment of cancer and other diseases [1-3]. Most of the inhibitors known so far have been identified fortuitously. Only two drugs, 5-azacytidine and 5-aza-2’-deoxycytidine (decitabine), have been developed clinically. These drugs, however, have relatively low specificity and are characterized by substantial cellular and clinical toxicity [4]. Therefore, there is an urgent need to identify novel and more specific DNMT inhibitors that do not function via incorporation into DNA. To this end, computational approaches are increasingly being used to better understand at the molecular level the mechanism of established inhibitors of DNMTs [5].
Chemical libraries are becoming and important role for the discovery of inhibitors of DNMT. Structure-based virtual screening of the National Cancer Institute (NCI) database [6], followed by experimental validation, has identified hits with novel scaffolds [6,7]. Promising hits have been proposed from a docking-based virtual screening of a large natural product collection available in the ZINC database [8]. There are several additional promising databases for structureand ligand-based virtual screening for novel DNMT inhibitors and other molecular targets [9]. For example, the Traditional Chinese Medicine (TCM) represents an attractive source to identify novel inhibitors of natural origin. Also, a focused library for DNMT inhibitors has been recently developed. An initial and important step before conducting the virtual screening of these compound databases is the comprehensive characterization of the molecular properties, scaffold content and chemical space coverage of the screening libraries [10,11]. There are available several chemoinformatic tools that have been employed by the authors and other research groups to analyze chemical libraries. Representative and recent examples include the characterization of the NCI database [12], a natural product collection available in ZINC [12] and other natural products databases [14,15], several commercially available libraries and approved drugs [16,17] and public repositories [18].
As part of on-going efforts to conduct virtual screening for novel DNMT inhibitors [19-21] and compounds directed to other targets of therapeutic interest [22,23] herein, we report a comprehensive chemoinformatic characterization of a focused library on DNMT inhibitors, two natural products databases including the TCM collection available in ZINC, and other reference databases. The analysis was performed using a comprehensive and complementary set of criteria including physicochemical properties, molecular fingerprints, and scaffolds [13].
2. Methods
2.1. Data Sets
We analyzed two natural product databases including TCM implemented in ZINC [24], a recently developed DNMT focused library, and the NCI diversity set that was used as a reference. Table 1 summarizes the source and sizes each collection after removal of duplicates. In addition, a collection of 1403 approved drugs obtained from DrugBank [25] was used as a reference to characterize the physicochemical properties and structural diversity of the screening collections. All molecular databases were protonated and prepared using the “Wash” function implemented in Molecular Operating Environment (MOE, v2010. 10, Chemical Computing Group, Montreal, Canada).
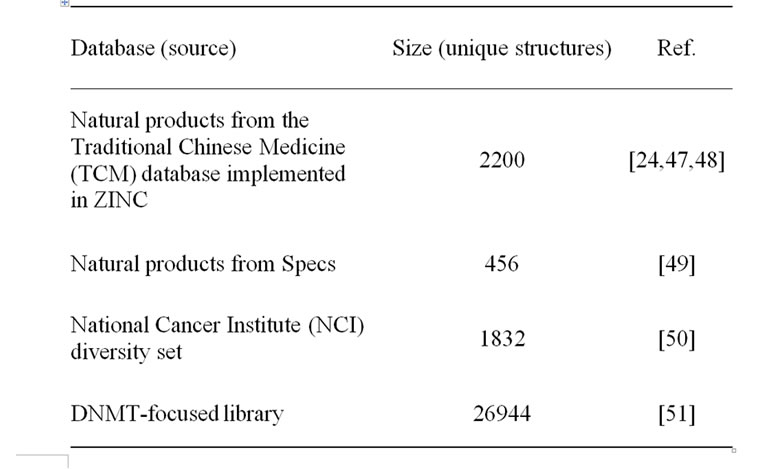
Table 1. Molecular databases characterized in this work.
2.2. Physicochemical Properties
The following properties were computed with MOE: molecular weight (MW), number of rotatable bonds (RB), hydrogen bond acceptors (HBA), hydrogen bond donors (HBD), topological polar surface area (TPSA), and the octanol/water partition coefficient (SlogP). The six descriptors used here have been used widely to compare the property space of compound collections [12,13,26].
2.3. Molecular Fingerprints
Molecules were represented by 2D MACCS key fingerprints (166 bits) [27] as implemented in MOE and the similarity of the i-th and j-th molecules was computed using the well-known Tanimoto similarity coefficient [28,29]:
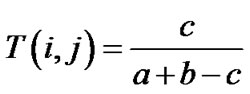 (1)
(1)
where a and b are the number of fragment bits corresponding to the i-th and j-th molecules and c is the number of fragment bits common to both molecules. Despite some caveats related to size-dependent effects [30,31], the Tanimoto coefficient is the measure of choice to assess the molecular similarity of molecules based on 2-D fingerprints, because on its extensive usage in a wide variety of studies [32]. To obtain a visual representation of the chemical space, a subset of 1000 compounds was randomly selected from each database in the molecular weight range 60 - 1000. Several visualization methods of the chemical space are available [16,17,33,34]. In this work, a visual representation of the chemical space [33] was obtained with principal component analysis (PCA) of the similarity matrix of the databases computed using MACCS keys and the Tanimoto coefficient [35]. PCA was carried out in Spotfire 7.1.2 [36].
2.4. Scaffold Content and Diversity
In this work the scaffolds were defined as the cyclic systems that result from iteratively removing all vertices of degree one, in other words, by iteratively removing the side chains of the molecule. The cyclic systems are part of the chemotype methodology and were computed with Molecular Equivalence Indices (MEQI) developed by Johnson and Xu [37]. A chemotype code or chemotype identifier (a code of five characters) is assigned to each scaffold using a unique naming algorithm. This approach has been successfully used to classify collections of combinatorial libraries, drugs, natural products, and other compound databases [13,38,39]. An advantageous feature of using cyclic systems to compare databases is that they represent equivalence classes and molecules classified in a given cyclic system [40]. The number of scaffolds in each database were recorded along with the number of scaffolds containing only one compound (e.g., singletons) using MEQI. The fraction of scaffolds relative to the data set size, and the fraction of singletons relative to the data set size and relative to the number of scaffolds provide information regarding the scaffold diversity in the collection. The distribution of molecules over the different scaffolds was obtained using the cyclic systems retrieval (CSR) curves [38-41]. In these curves, the fraction of cyclic systems (x) is plotted by the fraction of compounds (y) that contain those cyclic systems. The CSR curves were further characterized by obtaining the fraction of cyclic systems required to retrieve 50% of the corresponding database and the area under the curve (AUC).
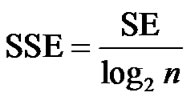
The specific distribution of compounds in the n most populated cyclic systems was quantified with the implementation of the Shannon entropy (SE) [42,43] the authors introduced recently [38]. The SE of a population of P compounds contained in n cyclic systems is defined as:
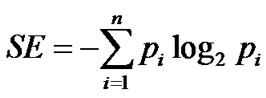 ;
; (2)
(2)
where pi is the relative frequency of the cyclic system i in a population of P compounds containing a total of n distinct cyclic systems; ci corresponds to the absolute number of molecules containing a particular cyclic system i. The values of SE range between 0 and log2n and hence depend on n, but not explicitly on P. If SE = 0, then all P compounds possess only a single cyclic system. If SE = log2n, then the P compounds are uniformly distributed among the n cyclic systems which represents maximum cyclic system diversity on the data set. To normalize the SE values for different values of n, the scaled SE (SSE) is defined as [43]:
 (3)
(3)
The values of SSE range between 0, where all P compounds are contained in one cyclic system, and 1.0, where each cyclic system contains an equal number of compounds. Therefore, SSE values closer to 1.0 indicate large scaffold diversity within the n most populated cyclic systems.
3. Results and Discussion
3.1. Physicochemical Properties
Figure 1 summarizes the distribution of the six physicochemical properties described as box plots implemented in Spotfire 9.1.2. The three important molecular properties of size, flexibility, and molecular polarity are described by MW; RB; and SlogP, TPSA, HBA, and HBD, respectively. The yellow boxes enclose data points with values within the first and third quartiles of the distribution; the lines above and below indicate the upper and lower adjacent values. The black and blue triangles denote the mean and median of distributions, respectively, and the red squares indicate outliers. The summary of the maximum, minimum, median, mean, and standard deviations of the distributions are presented at the bottom of the box plots. According to the distribution of properties in Figure 1, the DNMT focused library (labeled in this figure as “ChemDiv”), has slightly larger number of HBA than drugs as reflected by the mean and median values. The two natural products collections, Specs and TCM, have a distribution of HBA similar to drugs although with lower mean values. Only NCI diverse set has a narrower distribution of HBA than drugs. Overall, the four libraries have a smaller number of HDB than drugs. The focused library and Specs databases have the same median values of HDB. Specs, TCM and NCI databases have lower values of RB than drugs. The focused library has similar values of RB as drugs. The NCI diverse set and TCM databases have a distribution of SlogP values similar to drugs as reflected by the median and mean values. In comparison, the focused library and Specs have slightly larger SlogP values than drugs. It means that the focused library and Specs are more hydrophobic than drugs and the other databases. The distribution of TPSA values of the four databases was similar to drugs. Regarding MW, the focused library and Specs are similar to drugs, while NCI and TCM have slightly smaller values. Taken together, the analysis of the distribution of physicochemical properties indicates that the DNMT focused library and the two natural products collections have molecules with properties similar to approved drugs.
3.2. Molecular Fingerprints and Chemical Space
Figure 2 shows a visual representation of the chemical space obtained with PCA of the similarity matrix using MACCS keys and Tanimoto coefficient as described in the Methods section. The first three principal components account for 80% of the variance. Figure 2(a) shows all databases in the same space. For the sake of clarity, Figure 2(b)-(f) shows a comparison of approved drugs with each compound collection separately but within the same coordinates. As a reference, we included in the chemical space the position of the known DNMT inhibitor SGI- 1027 [44] (the chemical structure is shown in Figure 2(b)). This compound is particularly attractive because it seems to have a distinct mode of enzymatic inhibition of DNMT and represents an attractive reference compound for similarity-based virtual screening. Figure 2(b) shows that SGI- 1027 is within the chemical space of drugs. Figure 2(c) clearly shows that the DNMT focused library is located within the dense populated area of the drugs and that the
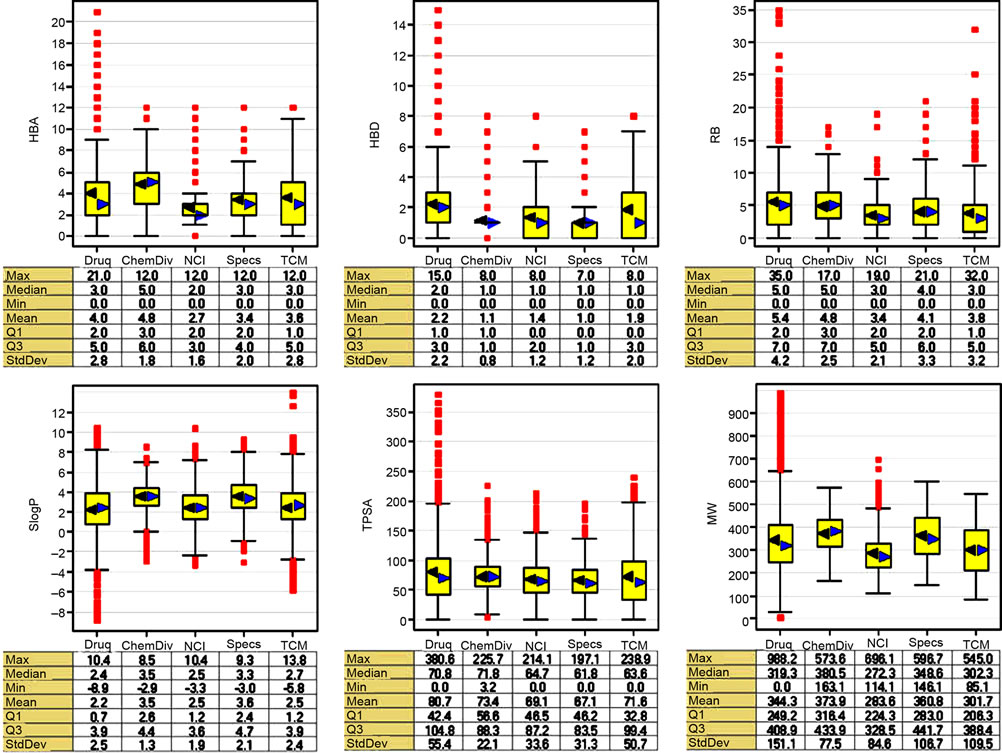
Figure 1. Box plots for the physicochemical properties of the compound databases. The yellow boxes enclose data points with values within the first and third quartile; the black and blue triangles indicate the mean and median of distributions, respectively; the lines above and below indicate the upper and lower adjacent values; the red squares indicate outliers. The focused library is labeled in this figure as “ChemDiv”.
known inhibitor is within the chemical space of the focused library. It follows, according to the similarity principle [29,45], that is very likely to identify additional inhibitors of DNMT in the focused library. It is anticipated that virtual screening based on similarity searching of the focused library would lead to several hit compounds with high structure similarity to SGI-1027. The NCI diverse set also shares the chemical space of approved drugs. (Figure 2(d)) In contrast, most of the compounds in the natural product databases, TCM and Specs, are located in a sparse area of approved drugs. (Figures 2(e) and (f)) This comparison indicates that the majority of the compounds in the natural products databases are structurally different from approved drugs, the focused library and the NCI diverse set. Therefore, it is anticipated that similarity-based virtual screening of these natural product collections would result in few compounds with high structure similarity to SGI-1027.
Figure 3 shows a heat map of the similarity matrix calculated with MACCS keys/Tanimoto of the four collections and drugs. The heat map is color-coded by similarity value using a continuous scale from green (low similarity) over black to red (high similarity). Each library is distinguished with a different color on the left-hand side of the map. This map helps to visually inspect the structure similarity between individual libraries. The region that intersects the natural product collections, TCM and Specs, contain black-to-red squares indicating, overall, high inter-library similarity. This result is in agreement with the representation of the chemical space in Figure 2(a). In contrast, the region that intersects the focused library with the natural product collections (TCM and Specs) contains a larger number of green-to-black squares indicating low inter-library similarity between these databases. Also, this is in agreement with the chemical space depicted in Figure 2(a).
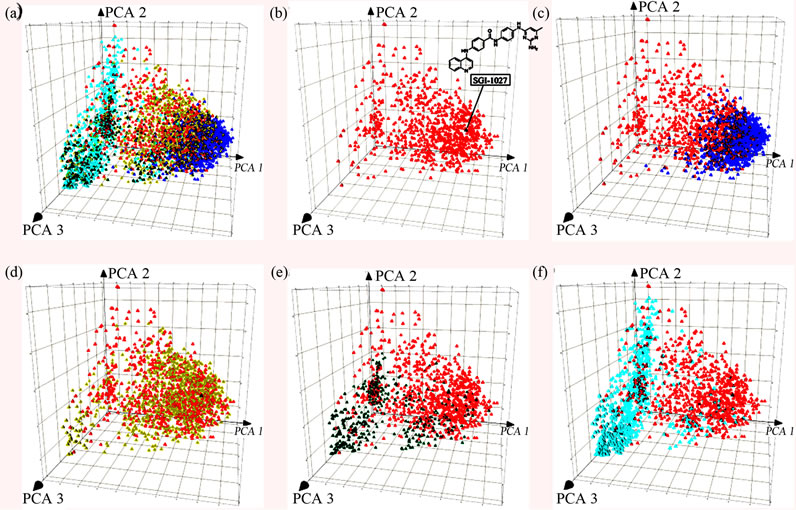
Figure 2. Visual representations of the chemical space of the screening collections obtained by PCA of the similarity matrix computed using MACCS keys and Tanimoto similarity. The first three PCs account for 80% of the variance. (a) All compounds libraries; (b) approved drugs (red) and known DNMT inhibitor, SGI-1027 (black); (c) DNMT focused library (blue); (d) NCI (yellow); (e) Specs (green); (f) TCM (cyan).
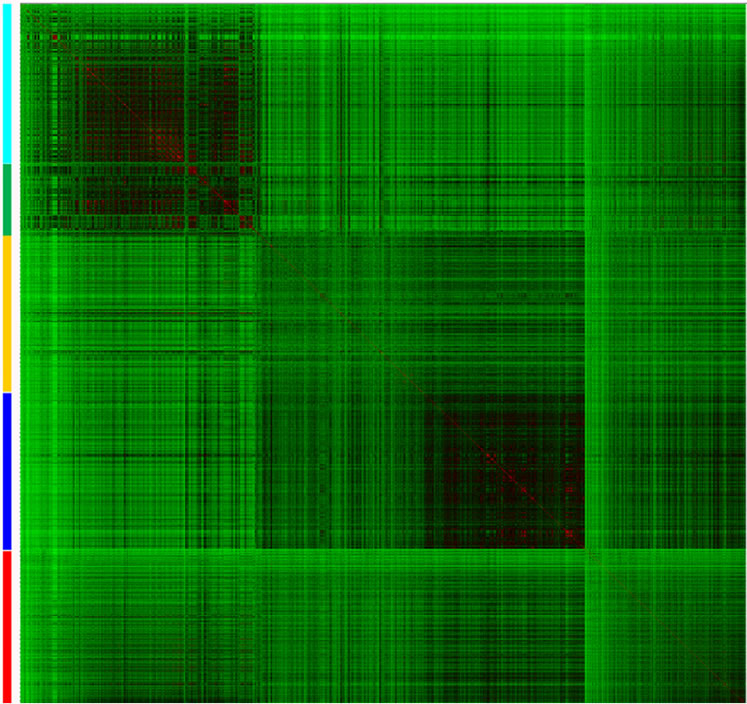
Figure 3. Heat map of the similarity matrix comparing drugs (red) with four data sets; namely, DNMT focused library (blue); NCI diverse set (yellow); Specs (green); TCM (cyan). Similarity is colored using a continuous color scale from red (high similarity) to green (low similarity).
3.3. Scaffold Analysis
The scaffold diversity of the four compounds libraries was assessed using frequency counts, CSR curves and SSE values. Table 2 summarizes the number of scaffolds (N) in each database and the fraction of scaffolds relative to the number of molecules in the data set (N/M). The number and fraction of singletons (i.e., scaffolds with one molecule; Nsing) are also reported. The focused library, NCI, and Specs data sets have comparable and high diversity with nearly one scaffold for every two molecules (N/M values of 0.42, 0.50, and 0.53, respectively). These three sets also showed the largest proportion of singletons relative to the number of molecules (Nsing/M) and relative to the number of cyclic systems (Nsing/N). In particular, the natural product collection from Specs showed the largest fractions (N/M values of 0.53 and Nsing/N value of 0.70) as an indicative of the largest scaffold diversity of the four analyzed databases (according to these two measures, see below). In contrast, the natural products from TCM showed the lowest fractions (N/M values of 0.32 and Nsing/N value of 0.19) suggesting lower scaffold diversity in this collection.
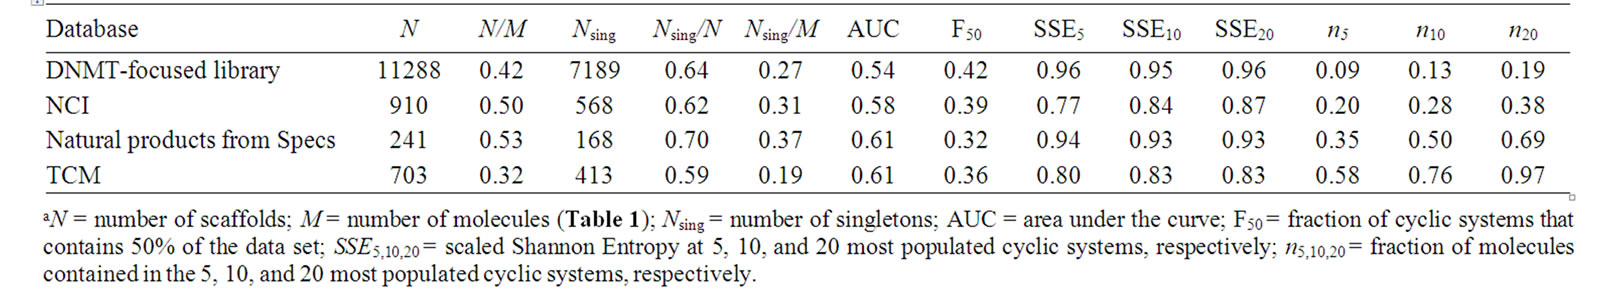
Table 2. Results of the scaffold diversity analyses of the data sets analyzed in this worka.
Frequency counts, number of singletons and fractions discussed above give an overall idea of the diversity but do not prove information concerning the specific distribution of the molecules in the scaffolds. This was addressed using additional measures as the authors [38] and other groups [16] have proposed. CSR curves measure the entire distribution of compounds over all the cyclic systems of a compound collection. The lower the area under the CSR curve indicates larger scaffold diversity. Figure 4 depicts the corresponding CSR curves for the four data sets in Table 1. The curves for the focused library and NCI, closer to the diagonal, indicate larger scaffold diversity than TCM and Specs which curves rise more steeply. In order to compare the curves quantitatively, Table 2 summarizes the area under the curve (AUC) and the F50 value which is the fraction of cyclic systems containing 50% of the molecules of the data set (see the Methods section). Thus, a low AUC value suggests high scaffold diversity and larger F50 values indicate more diversity. The focused library showed the largest F50 (0.42) and lowest AUC values (0.54) for the four data sets suggesting that this collection has the largest diversity of the four data sets. NCI showed the second largest F50 (0.39) and second lowest AUC (0.58) values. The two natural products data sets from Specs and TCM showed the same AUC values (0.61) and similar F50 (0.32 and 0.36) suggesting comparable diversity between them and lower diversity than the focused library and NCI.
The lower scaffold diversity of TCM as compared to the other data sets, as captured by the CSR curves, is in agreement with the lower diversity of TCM as measured by the fractions of scaffolds discussed above. However, according to the fractions of the scaffolds, the natural products collections from Specs appear to be the more diverse set while the focused library is the more diverse according to the CSR curves (vide supra). This result highlights the importance of considering multiple measures to quantitatively assess the scaffold diversity of compound databases [38].
Table 2 summarizes the fraction of compounds contained in the top 5, 10, and 20 most populated cyclic systems and the corresponding SSE values for the data sets. A relative small portion of compounds contained in top
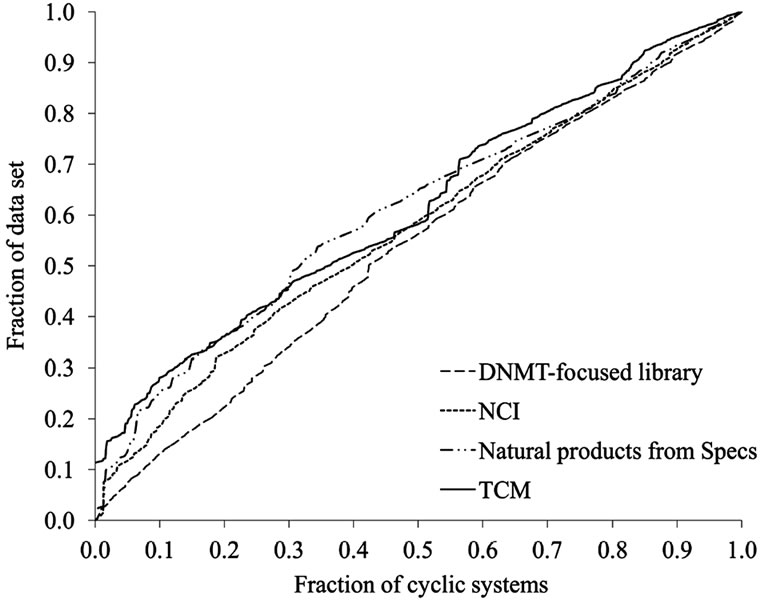
Figure 4. CSR curves for representative data sets. The curves can be characterized by the area under the curve (AUC) and the fraction of cyclic systems required for retrieving 50% of the compounds in the data sets (F50). See text for details.
populated scaffolds suggests a large diversity. Notably, the focused library contains the lowest proportions and is the most diverse according to this measure; 9% of the compounds in this collection are contained in the top 5 most populated scaffolds, and 13% and 19% of the compounds are contained in the top 10 and 20, respectively. In contrast, 58% of the molecules in TCM are contained in the top 5 most populated scaffolds and 76% and 97% are contained in the top 10 and 20 most populated cyclic systems, respectively. The lower proportion of molecules contained in the top 5, 10, and 20 scaffolds of NCI (0.20, 0.28 and 0.38, respectively), as compared to Specs (0.35, 0.50 and 0.69) suggest the larger diversity of NCI. These results are in agreement with the conclusions derived from the CSR curves discussed above.
The Scaled Shannon Entropy (SSE) is a measure of the specific distribution of molecules in the scaffolds. SSE values closer to 1.0 indicate that the molecules are more equally distributed in the scaffolds (high diversity) and smaller SSE values indicate that most of the molecules are distributed in fewer scaffolds (low diversity). Table 2 summarizes the results of the SSE values for the 5, 10 and 20 most populated scaffolds. The focused library and natural products from Specs are the most diverse collections with SSE10 values of 0.95 and 0.93, respectively. In contrast, lower SSE10 values are observed for NCI (0.84) and TCM (0.83) indicating lower diversity. Similar conclusions can be obtained from the SSE values for the top 5 and 20 most populated scaffolds. We would like to point out that SSE implemented in this work measures the diversity of the most populated scaffolds as opposed to the diversity of the entire collection measured with fractions of cyclic systems and CSR curves. Figure 5 depicts the distribution of compounds in the top 10 most populated cyclic systems for each data set. The graph clearly shows the large cyclic system diversity of the focused library (Figure 5(a)) and Specs (Figure 5(c)) as compared to NCI and TCM.
Figure 6 depicts the chemical structures and chemotype identifiers of the top three most frequent scaffolds for each data set. The most frequent cyclic system in NCI and TCM is benzene which is a very common cyclic system found in drugs, natural products, MLSMR and several other databases [13,46]. The most frequent scaffolds in the focused collection were not identified in the other three compounds databases suggesting the scaffold novelty of this collection.
4. Conclusions and Perspective
We report a chemoinformatic analysis of general screening libraries using a comprehensive set of criteria including physicochemical properties, molecular fingerprints, and scaffolds. The DNMT-focused library, NCI diversity set, and two natural products databases were compared with approved drugs. Analysis of the physicochemical properties shows that the DNMT focused library and the two natural products collections have molecules with properties similar to drugs. Analysis of the chemical space using molecular fingerprints indicates that the DNMT focused library occupy an area of the space densely populated by drugs and that encloses the space occupied by a known DNMT inhibitor. In contrast, the compounds in the natural products databases are structurally different from approved drugs, the focused library and the NCI diverse set. These observations indicate that the focused library and natural product collections are attractive sources
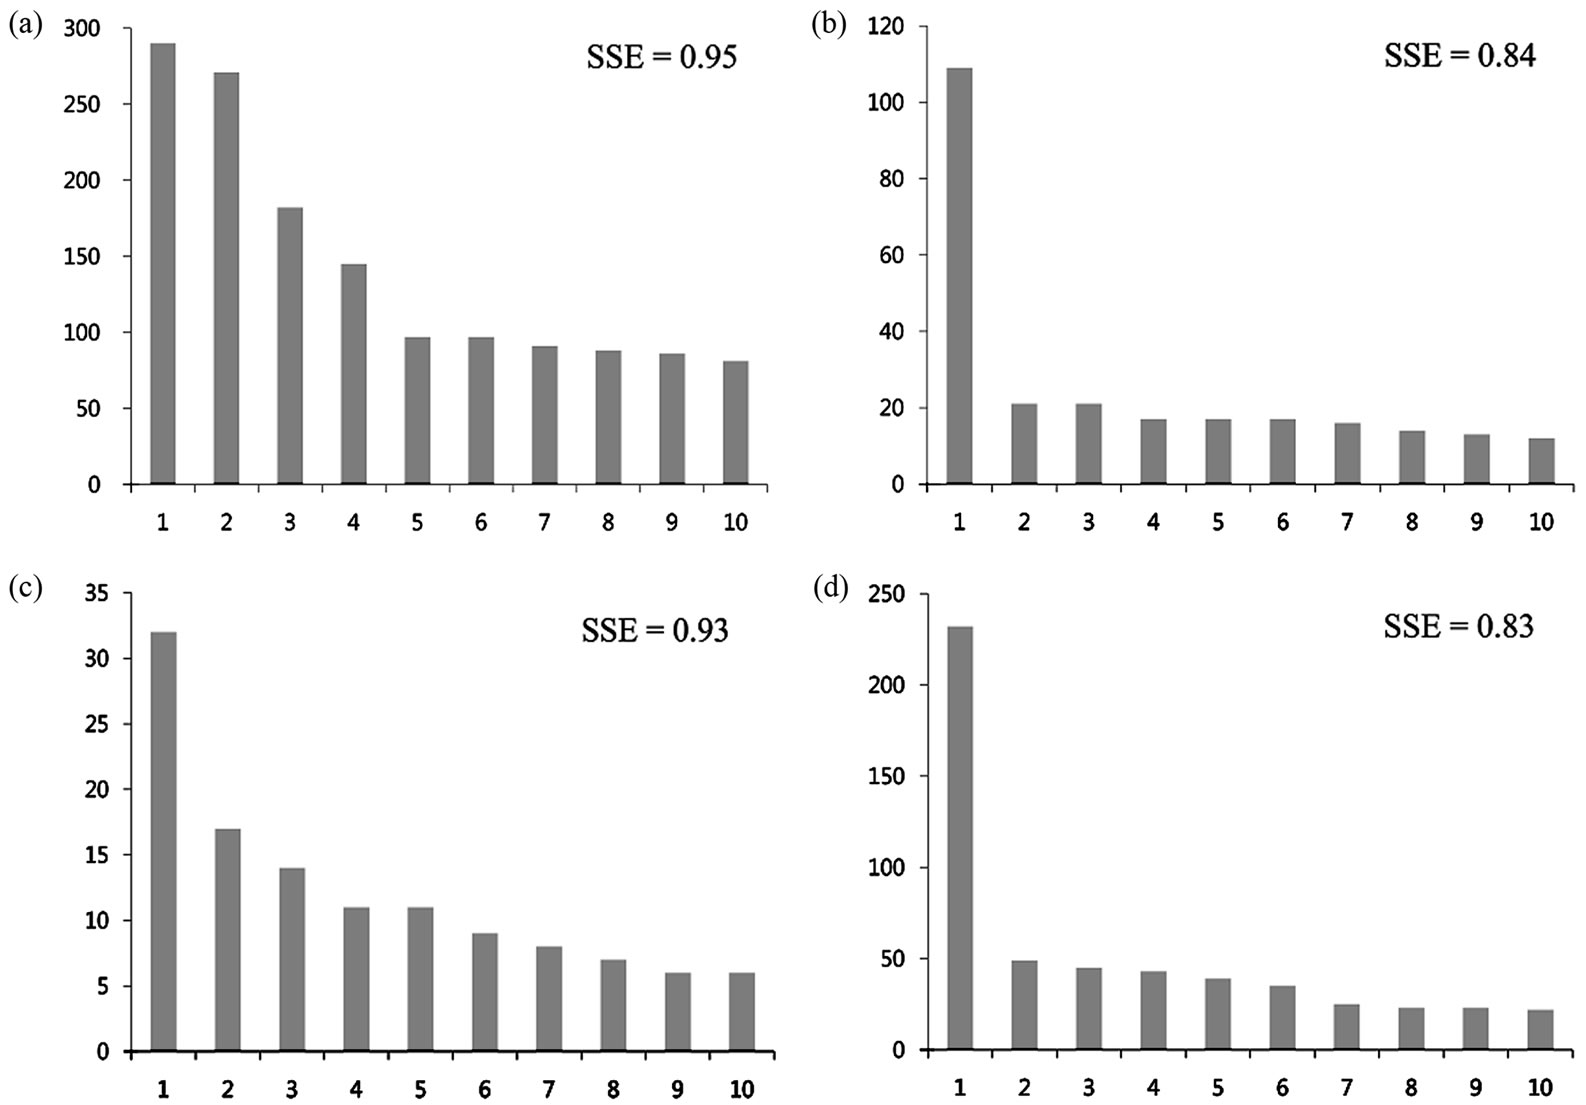
Figure 5. Distribution of compounds in the top 10 most populated cyclic systems for (a) DNMT-focused library; (b) NCI; (c) Specs; and (d) TCM. The corresponding SSE values for each distribution are indicated.
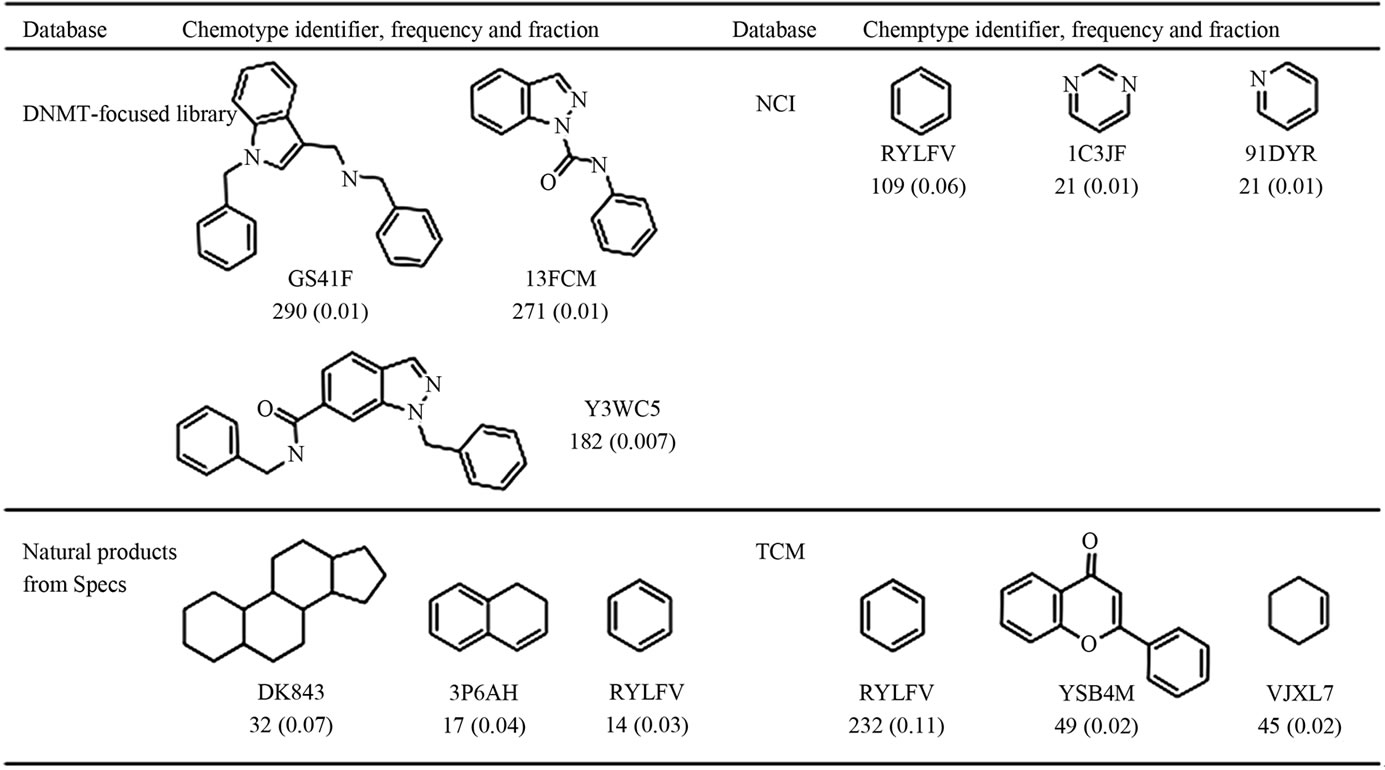
Figure 6. Three most frequent scaffolds found in the data sets.
to identify DNMT inhibitors with high structure similarity to SGI-1027 and inhibitors with novel chemical scaffolds. The focused library has, overall, the largest scaffold diversity as captured by several measures including an entropy-based measure recently developed. During the course of this work we also concluded that multiple measures are required for the complete assessment of scaffold diversity of compound collections. A major perspective of this study is the virtual screening and experimental validation of the screening libraries analyzed in this work. The approaches presented here for comparing compound collections are general and can be applied for analyzing other compound collections.
5. Acknowledgements
We thank Dr. Mark Johnson for providing the program MEQI. Discussions with Dr. Fabian López-Vallejo (TPIMS) are acknowledged. This work was supported by the State of Florida, Executive Office of the Governor’s Office of Tourism, Trade, and Economic Development. JLM-F thanks the Multiple Sclerosis National Research Institute for funding.”
6. References
[1] K. D. Robertson, “DNA Methylation and Human Disease,” Nature Reviews Genetics, Vol. 6, No. 8, 2005, pp. 597- 610. doi:10.1038/nrg1655
[2] C. A. Miller, C. F. Gavin, J. A. White, R. R. Parrish, A. Honasoge, C. R. Yancey, I. M. Rivera, M. D. Rubio, G. Rumbaugh and J. D. Sweatt, “Cortical DNA Methylation Maintains Remote Memory,” Nature Neuroscience, Vol. 13, No. 6, 2010, pp. 664-666. doi:10.1038/nn.2560
[3] N. H. Zawia, D. K. Lahiri and F. Cardozo-Pelaez, “Epigenetics, Oxidative Stress, and Alzheimer Disease,” Free Radical Biology & Medicine, Vol. 46, No. 9, 2009, pp. 1241-1249. doi:10.1016/j.freeradbiomed.2009.02.006
[4] C. Stresemann and F. Lyko, “Modes of Action of the DNA Methyltransferase Inhibitors Azacytidine and Decitabine,” International Journal of Cancer, Vol. 123, No. 1, 2008, pp. 8-13. doi:10.1002/ijc.23607
[5] J. L. Medina-Franco and T. Caulfield, “Advances in the Computational Development of DNA Methyltransferase Inhibitors,” Drug Discovery Today, Vol. 16, No. 9-10, 2011, pp. 418-425. doi:10.1016/j.drudis.2011.02.003
[6] D. Kuck, N. Singh, F. Lyko and J. L. Medina-Franco, “Novel and Selective DNA Methyltransferase Inhibitors: Docking-Based Virtual Screening and Experimental Evaluation,” Bioorganic & Medicinal Chemistry, Vol. 18, No. 22010, pp. 822-829.
[7] P. Siedlecki, R. G. Boy, T. Musch, B. Brueckner, S. Suhai, F. Lyko and P. Zielenkiewicz, “Discovery of Two Novel, Small-Molecule Inhibitors of DNA Methylation,” Journal of Medicinal Chemistry, Vol. 49, No. 2, 2006, pp. 678-683. doi:10.1021/jm050844z
[8] J. Medina-Franco, F. López-Vallejo, D. Kuck and F. Lyko, “Natural Products as DNA Methyltransferase Inhibitors: A Computer-Aided Discovery Approach,” Molecular Diversity, Vol. 15, No. 2, 2011, pp. 293-304. doi:10.1007/s11030-010-9262-5
[9] T. Scior, P. Bernard, J. L. Medina-Franco and G. M. Maggiora, “Large Compound Databases for StructureActivity Relationships Studies in Drug Discovery,” MiniReviews in Medicinal Chemistry, Vol. 7, No. 8, 2007, pp. 851-860. doi:10.2174/138955707781387858
[10] F. López-Vallejo, T. Caulfield, K. Martínez-Mayorga, M. A. Giulianotti, A. Nefzi, R. A. Houghten and J. L. Medina-Franco, “Integrating Virtual Screening and Combinatorial Chemistry for Accelerated Drug Discovery,” Combinatorial Chemistry & High Throughput Screening, Vol. 14, No. 6, 2011, pp. 475-487. doi:10.2174/138620711795767866
[11] D. Fourches, E. Muratov and A. Tropsha, “Trust, but Verify: On the Importance of Chemical Structure Curation in Cheminformatics and QSAR Modeling Research,” Journal of Chemical Information and Modeling, Vol. 50, No. 7, 2010, pp. 1189-1204. doi:10.1021/ci100176x
[12] F. López-Vallejo, A. Nefzi, A. Bender, J. R. Owen, I. T. Nabney, R. A. Houghten and J. L. Medina-Franco, “Increased Diversity of Libraries from Libraries: Chemoinformatic Analysis of Bis-Diazacyclic Libraries,” Chemical Biology & Drug Design, Vol. 77, No. 5, 2011, pp. 328-342. doi:10.1111/j.1747-0285.2011.01100.x
[13] N. Singh, R. Guha, M. A. Giulianotti, C. Pinilla, R. A. Houghten and J. L. Medina-Franco, “Chemoinformatic Analysis of Combinatorial Libraries, Drugs, Natural Products, and Molecular Libraries Small Molecule Repository,” Journal of Chemical Information and Modeling, Vol. 49, No. 4, 2009, pp. 1010-1024. doi:10.1021/ci800426u
[14] M. Feher and J. M. Schmidt, “Property Distributions: Differences between Drugs, Natural Products, and Molecules from Combinatorial Chemistry,” Journal of Chemical Information and Modeling, Vol. 43, No. 1, 2003, pp. 218-227. doi:10.1021/ci0200467
[15] J. Rosén, J. Gottfries, S. Muresan, A. Backlund and T. I. Oprea, “Novel Chemical Space Exploration via Natural Products,” Journal of Medicinal Chemistry, Vol. 52, No. 7, 2009, pp. 1953-1962. doi:10.1021/jm801514w
[16] S. R. Langdon, N. Brown and J. Blagg, “Scaffold Diversity of Exemplified Medicinal Chemistry Space,” Journal of Chemical Information and Modeling, Vol. 51, No. 9, 2011, pp. 2174-2185. doi:10.1021/ci2001428
[17] V. Le Guilloux, L. Colliandre, S. Bourg, G. Guenegou, J. Dubois-Chevalier and L. Morin-Allory, “Visual Characterization and Diversity Quantification of Chemical Libraries: 1. Creation of Delimited Reference Chemical Subspaces,” Journal of Chemical Information and Modeling, Vol. 51, No. 8, 2011, pp. 1762-1774. doi:10.1021/ci200051r
[18] L. F. Pekka Tiikkainen, “Analysis of Commercial and Public Bioactivity Databases,” Journal of Chemical Information and Modeling, 2011, in press. doi:10.1021/ci2003126
[19] J. Yoo and J. L. Medina-Franco, “Homology Modeling, Docking, and Structure-Based Pharmacophore of Inhibitors of DNA Methyltransferase,” Journal of ComputerAided Molecular Design, Vol. 25, No. 6, 2011, pp. 555- 567. doi:10.1007/s10822-011-9441-1
[20] J. Yoo and J. L. Medina-Franco, “Discovery and Optimization of Inhibitors of DNA Methyltransferase as Novel Drugs for Cancer Therapy,” in: C. Rundfeldt, Ed., Drug Development—A Case Study Based Insight into Modern Strategies, pp. 3-22. http://www.intechopen.com/articles/show/title/discovery-and-optimization-of-inhibitors-of-dna-methyltransferase-as-novel-drugs-for-cancer-therapy
[21] J. Yoo, J. Kim, K. D. Robertson and J. L. Medina-Franco, “Molecular Modeling of Inhibitors of Human DNA Methyltransferase with a Crystal Structure: Discovery of a Novel DNMT1 Inhibitor,” in; C. Christov and T. Karabencheva-Christova, Eds., Advances in Protein Chemistry and Structural Biology, Elsevier, Berlin, 2011, In press.
[22] J. L. Medina-Franco, M. A. Giulianotti, Y. Yu, L. Shen, L. Yao and N. Singh, “Discovery of a Novel Protein Kinase B Inhibitor by Structure-Based Virtual Screening,” Bioorganic & Medicinal Chemistry Letters, Vol. 19, 2009, pp. 4634- 4638. doi:10.1016/j.bmcl.2009.06.078
[23] A. Hernández-Campos, I. Velázquez-Martínez, R. Castillo, F. López-Vallejo, P. Jia, Y. Yu, M. A. Giulianotti and J. L. Medina-Franco, “Docking of Protein Kinase B Inhibitors: Implications in the Structure-Based Optimization of a Novel Scaffold,” Chemical Biology & Drug Design, Vol. 76, No. 3, 2010, pp. 269-276.
[24] J. J. Irwin and B. K. Shoichet, “ZINC—A Free Database of Commercially Available Compounds for Virtual Screening,” Journal of Chemical Information and Modeling, Vol. 45, No. 1, 2005, pp. 177-182. doi:10.1021/ci049714+
[25] Drug Bank, 2011. http://www.drugbank.ca/downloads.
[26] T. Fink and J.-L. Reymond, “Virtual Exploration of the Chemical Universe up to 11 Atoms of C, N, O, F: Assembly of 26.4 Million Structures (110.9 Million Stereoisomers) and Analysis for New Ring Systems, Stereochemistry, Physicochemical Properties, Compound Classes, and Drug Discovery,” Journal of Chemical Information and Modeling, Vol. 47, No. 2, 2007, pp. 342-353. doi:10.1021/ci600423u
[27] MACCS Structural Keys, CA (USA): Symyx Software San Ramon.
[28] G. M. Maggiora and V. Shanmugasundaram, “Molecular Similarity Measures,” in: J. Bajorath, Ed., Chemoinformatics and Computational Chemical Biology, Methods in Molecular Biology, Springer, New York, 2011, pp. 39- 100. doi:10.1007/978-1-60761-839-3_2
[29] A. Bender and R. C. Glen, “Molecular Similarity: A Key Technique in Molecular Informatics,” Organic & Biomolecular Chemistry, Vol. 2, No. 22, 2004, pp. 3204- 3218. doi:10.1039/b409813g
[30] Y. Wang and J. Bajorath, “Development of a Compound Class-Directed Similarity Coefficient That Accounts for Molecular Complexity Effects in Fingerprint Searching,” Journal of Chemical Information and Modeling, Vol. 49, No. 6, 2009, pp. 1369-1376. doi:10.1021/ci900108d
[31] S. Senger, “Using Tversky Similarity Searches for Core Hopping: Finding the Needles in the Haystack,” Journal of Chemical Information and Modeling, Vol. 49, No. 6, 2009, pp. 1514-1524. doi:10.1021/ci900092y
[32] L. Tan, H. Geppert, M. T. Sisay, M. Gutschow and J. Bajorath, “Integrating Structureand Ligand-Based Virtual Screening: Comparison of Individual, Parallel, and Fused Molecular Docking and Similarity Search Calculations on Multiple Targets,” ChemMedChem, Vol. 3, No. 10, 2008, pp. 1566-1571. doi:10.1002/cmdc.200800129
[33] J. L. Medina-Franco, K. Martínez-Mayorga, M. A. Giulianotti, R. A. Houghten and C. Pinilla, “Visualization of the Chemical Space in Drug Discovery,” Current Computer—Aided Drug Design, Vol. 4, No. 4, 2008, pp. 322- 333. doi:10.2174/157340908786786010
[34] J. R. Owen, I. T. Nabney, J. L. Medina-Franco and F. López-Vallejo, “Visualization of Molecular Fingerprints,” Journal of Chemical Information and Modeling, Vol. 51, No. 7, 2011, pp. 1552-1563. doi:10.1021/ci1004042
[35] J. L. Medina-Franco, G. M. Maggiora, M. A. Giulianotti, C. Pinilla and R. A. Houghten, “A Similarity-Based Data-fusion Approach to the Visual Characterization and Comparison of Compound Databases,” Chemical Biology & Drug Design, Vol. 70, No. 5, 2007, pp. 393-412. doi:10.1111/j.1747-0285.2007.00579.x
[36] Spotfire, “Spotfire,” Spotfire, version 9.1.1, TIBCO Software, Inc., Somerville. http://spotfire.tibco.com
[37] Y. J. Xu and M. Johnson, “Using Molecular Equivalence Numbers To Visually Explore Structural Features that Distinguish Chemical Libraries,” Journal of Chemical Information and Modeling, Vol. 42, No. 4, 2002, pp. 912- 926. doi:10.1021/ci025535l
[38] J. L. Medina-Franco, K. Martínez-Mayorga, A. Bender and T. Scior, “Scaffold Diversity Analysis of Compound Data Sets Using an Entropy-Based Measure,” QSAR & Combinatorial Science, Vol. 28, No. 11-12, 2009, pp. 1551-1560. doi:10.1002/qsar.200960069
[39] F. López-Vallejo, R. Castillo, L. Yépez-Mulia and J. L. Medina-Franco, “Benzotriazoles and Indazoles Are Scaffolds with Biological Activity against Entamoeba histolytica,” Journal of Biomolecular Screening, Vol. 16, No. 8, 2011, pp. 862-868. doi:10.1177/1087057111414902
[40] J. L. Medina-Franco, J. Petit and G. M. Maggiora, “Hierarchical Strategy for Identifying Active Chemotype Classes in Compound Databases,” Chemical Biology & Drug Design, Vol. 67, No. 6, 2006, pp. 395-408. doi:10.1111/j.1747-0285.2006.00397.x
[41] A. H. Lipkus, Q. Yuan, K. A. Lucas, S. A. Funk, W. F. Bartelt, R. J. Schenck and A. J. Trippe, “Structural Diversity of Organic Chemistry. A Scaffold Analysis of the CAS Registry,” Journal of Organic Chemistry, Vol. 73, No. 12, 2008, pp. 4443-4451. doi:10.1021/jo8001276
[42] C. E. Shannon and W. Weaver, “The Mathematical Theory of Communication,” University of Illinois Press, Urbana, 1963.
[43] J. W. Godden and J. Bajorath, “Analysis of Chemical Information Content Using Shannon Entropy,” in: K. B. Lipkowitz and T. R. Cundari, eds., Reviews in Computational Chemistry, John Wiley & Sons, Inc., Hoboken, 2007, pp. 263-289. doi:10.1002/9780470116449.ch5
[44] J. Datta, K. Ghoshal, W. A. Denny, S. A. Gamage, D. G. Brooke, P. Phiasivongsa, S. Redkar and S. T. Jacob, “A New Class of Quinoline-Based DNA Hypomethylating Agents Reactivates Tumor Suppressor Genes by Blocking DNA Methyltransferase 1 Activity and Inducing Its Degradation,” Cancer Research, Vol. 69, No. 10, 2009, pp. 4277-4285. doi:10.1158/0008-5472.CAN-08-3669
[45] M. A. Johnson and G. M. Maggiora, “Concepts and Applications of Molecular Similarity,” Wiley, New York, 1990.
[46] G. W. Bemis and M. A. Murcko, “The Properties of Known Drugs. 1. Molecular Frameworks,” Journal of Medicinal Chemistry, Vol. 39, No. 15, 1996, pp. 2887-2893. doi:10.1021/jm9602928
[47] Traditional Chinese Medicine (TCM), 2011. http://tcm.cmu.edu.tw
[48] C. Y.-C. Chen, “TCM Database@Taiwan: The World's Largest Traditional Chinese Medicine Database for Drug Screening In Silico,” Plos One, Vol. 6, No. 1, 2011, pp. 862-868. doi:10.1371/journal.pone.0015939
[49] Specs, 2010. http://specs.net
[50] National Cancer Institute (NCI) Diversity Set, 2010. http://dtp.nci.nih.gov
[51] DNMT-Focused Library, 2011. http://eu.chemdiv.com/