American Journal of Analytical Chemistry
Vol.06 No.09(2015), Article ID:58820,14 pages
10.4236/ajac.2015.69070
Light-Induced Mid-Infrared Emission of Liquid Carbon Tetrachloride and Benzene
Sofya Terpugova1, Olga Degtyareva2, Valery Savransky1, Evgeni Terpugov2*
1Natural Sciences Center, Prokhorov General Physics Institute, Russian Academy of Sciences, Moscow, Russian Federation
2Institute of Cell Biophysics Russian Academy of Sciences, Pushchino, Moscow Region, Russian Federation
Email: *el_terpugov@rambler.ru
Copyright © 2015 by authors and Scientific Research Publishing Inc.
This work is licensed under the Creative Commons Attribution International License (CC BY).
http://creativecommons.org/licenses/by/4.0/


Received 4 March 2015; accepted 14 August 2015; published 17 August 2015
ABSTRACT
Light-induced infrared emission spectroscopy (LIRES) is a novel technique that permits to receive high-quality spectra in the mid-infrared region. Low-intensity visible light connected to a highly sensitive FTIR spectrometer is more advantageous for studying any samples, including biological samples without any damage. This technique permits obtaining unique information on the molecule structure via vibrational excitation fundamental frequencies, overtones, and combination modes. It also enables a direct observation of vibrational radiation transitions in vibrationally excited molecules as well as the channels of vibration energy redistribution, which is not allowed with any other method. In this work, the LIRES is being tested as a technique for studying of vibrationally-excited molecules of carbon tetrachloride and benzene in the liquid phase. On the other hand, using transparent liquids, we had tried to understand some of the physical phenomena that can drive emission in mid-IR. The characteristics of the infrared emission of both liquid species produced by different wavelength radiation from various types of light systems (100 - watt Xe-lamp and Nd:YAG laser; lambda = 1064 nm (8 mW) and lambda = 532 nm (4 mW)) are presented. We demonstrated that the IR-signal, as well as spectral properties of carbon tetrachloride and benzene, was dependent on the wavelength and power of excitation beam. Results obtained with different light sources show that the visible light produces a nonlinear IR-emission signal in transparent liquids. We believe that the visible light is the source of the nonlinear response and is producing the vibration excitation as well as photostimulated transformations of the molecules possessing the high activity for the nonlinear response.
Keywords:
FT-IR Emission Spectroscopy, Light-Induced Mid-Infrared Emission, Carbon Tetrachloride, Benzene, Xe-Lamp, Nd:YAG Laser

1. Introduction
Great progress has been lately achieved in the development of spectroscopic feasibility for emission measurements in the mid-infrared region (see, reviews of infrared emission spectroscopy in Refs. [1] -[6] ). A key point in these advances is the availability of very stable and sensitive Fourier-transform infrared (FTIR) spectrometers. Most of the research works reported to date rely on the use of highly sensitive low-temperature detectors and heating elements in order to heat gases or solids above the detector temperature or the cooling the entire instrument [7] [8] . While these devices are highly optimized in many respects, there are some serious limitations imposed by a damaging effect of high temperatures and hardly removable background radiation of the heaters (see, for example, Refs. [3] -[6] ).
Special attention should be paid to a methodological approach that involves the use of a continuum-wave-la- ser light to heat a sample surface and to record IR-emission in the mid-infrared region. Such FT-IR emission spectroscopic measurements simply require that the internal source must be replaced by the source of interest, i.e. by a sample itself. Honig et al. first demonstrated the analytical possibilities and advantages of this surface approach [9] . Then, Tsuge et al. continued these measurements and obtained very promising results on solids and powdered samples [10] . The advantage of this approach called laser-induced thermal emission (LITE) over heater-based method is that it is a non-invasive and nondestructive method with minimal, if any, sample preparation. As described in [9] “…The background emission is stronger while using heater method than the LITE. Removing the background heating is not a serious problem upon data processing. Like in the case of the Raman technique, the use of this approach allows easy achieving two-dimensional resolution because the excitation beam can be directed to a certain region on the sample or the entire surface can be scanned with it”. However, LITE method despite the obvious advantages and a large potential as well as the other mid-infrared emission approach earlier developed for gas samples [11] -[13] , had not been continued. The reason can be that excitation mechanism(s) are not completely understood yet. Also, the underlying phenomenon is more complex process than that of laser heating or photoinduced fluorescence as it was previously described in [9] [10] and [11] -[14] , respectively.
Irrespective of the above mentioned groups, fifteen years ago we have begun our own investigations of mid- infrared emission. Instead of laser source we used a continuum-wave Xe-lamp (100 W) to excite mid-infrared emission in the membrane protein bacteriorhodopsin [15] . Then we found that infrared emission process took place in a wide variety of compounds [16] -[19] data partly published. Like in the works mentioned above, observed discrete spectra of the different samples had a good signal-to-noise ratio and exhibited a large number of spectral lines, which correlated with bond vibrations and the appropriate IR-absorption spectra. In several cases we noticed that emission lines had been observed which appeared not to correlate with absorption lines, but corresponded closely to Raman-active lines [16] [19] . Also, it was found that the IR-signal had been depended on the position of the sample with respect to the exciting beam, the size of the light spot and the spectral composition of the exciting light [15] [19] [20] . The intensity of the spectrum had a quadratic dependence on the power of the excitation light [16] -[19] . In these respects, IR-emission response shows up as nonlinear one. So, we suggested that two-wave mixing mechanism might operate under broadband optical pumping [17] . Accordingly, two input beams at frequencies w1 and w2 overlap temporarily and spatially in phase-matching conditions and generate optical beats with a beat frequency Dw º w1 - w2 in a medium. If the value of difference frequency Dw coincides with the characteristic molecular vibration, then resonance interaction appears leading to enhancement of the vibrational transition between vibrational sublevels. The reason for the active mid-infrared emission effect is that the energy absorbed by the matter from the beat pulses is not converted to heat but returned to the field as a result of the stimulated IR-emission. As a consequence, a stationary emitting regime becomes possible, in which the signal intensity does not change.
In this paper, we continue our previous investigations [16] -[19] and present the measurements of a mid-infra- red emission response in the neat organic liquids such as carbon tetrachloride (CCl4) and benzene (C6H6). The major motivation to carry out the experiments presented here was a desire to demonstrate unique applications for the light-induced infrared emission spectroscopic technique as well as to understand the underlying phenomena. In particular, we examined how mechanism described above works in transparent neat liquids. To excite IR-emission, we used two continuous-wave (cw)-light sources, 100 W Xenon lamp and Nd:YAG laser, believing that a low-power laser light couldn’t able to produce any active medium response.
2. Materials and Methods
The liquid samples were spectroscopic-grade liquid carbon tetrachloride CCl4 and benzene C6H6. They were used without further purification.
Double-beam double-channel Fourier transform infrared spectrometer FS-02 (STC UI RAS, Russia) with N2- cooling MCT detector was used. This spectrometer was described earlier [21] .
A cw Xe-lamp and Nd:YAG laser was used to excite mid-infrared emission in a sample. In one series of experiments, a Nd:YAG laser was a green laser pointer producing 8 mW continuous output at l1 = 1064 nm and 4 mW at the second harmonics (l2 = 532 nm). In the other case, the Nd:YAG laser was a commercial diode- pumped laser producing 18 mW continuous output at l2 (the radiation at l1 was cut off by optical filters). The light beam from the 100 W Xe-lamp filtered out by the using a series of broadband glass color-filters to produce continuous output at (320 - 700 nm). The radiation energy at the input into the sample was varied by means of calibrated filters. The energy of the radiation incident on the sample was measured with LM-2 measuring device (Carl Zeiss, Germany) with an accuracy of ± 0.5 mW.
The light-induced infrared emission spectroscopic (LIRES) measurements of the liquid species were performed with optical arrangement in reflection geometry, as shown in Figure 1. This attachment removed a standard source of the spectrometer. In this work, the additional optics was somewhat rearranged as compared to the scheme given in [15] -[20] to place the sample horizontally. The light beam was directed to the sample at an approximate incidence angle of 70 degrees so that the reflected beam could not get into the interferometer. To collect the IR emission signal, a flat mirror positioned at an angle of 45 degrees to the perpendicular to the plane of the sample surface and rotated around its vertical axis toward the collecting mirror was used. This flat mirror directed the sample emission to the standard source mirror. The angle between the exciting beam and the direction of emission collection was about 13 degrees. The angles were chosen so that to provide the maximum IR emission signal and not to let parasitic light get into the interferometer. The light beam from a Xe-lamp was focused by a long-focal-length lens on the surface of the organic liquids to a spot of ~4 mm2. In laser case, inputting beam with 1 mm diameter was directed to the sample surface without focusing lens. In emission measurements a sample was placed into a 6 mm-diameter, 4-mm-deep plastic cup. Small volumes of the liquids were

Figure 1. FT-IR optic-based experimental set up for registration of mid-infrared emission. Continuous-wave-(cw) laser - Nd:YAG: l = 1064 or/and 532 nm or cw- Xe-lamp (100 W) were used as a source of visible light. Light beam(s) were incident on a sample surface at about 70 degrees in a collinear geometry (laser light) or focused in a ~4 mm2 spot using a long-focal glass lens (Xe-lamp). The emission was collimated and directed by the flat mirror on the focusing mirror and then into the interferometer. The angle between the exciting beam and the direction of the emission collection was about 13 degrees. The IR emission was collimated and directed into the interferometer along the same optical axis ordinary used by the IR-source.
directly exposed to the exciting beam without any cover, to exclude reabsorption of IR emission with the lid. Every 5 minutes 15 µl aliquots of liquids used were placed into the cuvette which compensated the partial evaporation and maintained the liquid volume on the initial level. All measurements were performed at room temperature.
During the absorption measurements the sample was placed into a standard cuvette between the NaCl windows with a 0.12 mm spacer. The spectral measurement in the 4000 - 400 cm−1 region was made at 4-cm−1 resolution with 200 co-additions. All post-data processing was performed using the Origin software, version 6.0.
3. Results and Discussion
3.1. Spectral Features of Liquid CCl4 and C6H6 in Mid-Infrared Region (2100 - 400 сm−1)
Contrary to our expectations, in both investigated species a low-power laser like a Xe-lamp excitation produced IR-emission signal, which was high enough to allow the reliable registration by the FTIR technique. Figure 2 shows a typical IR-emission spectrum, which consists of two components. One of the components is the broad continuum emission with a blackbody-like spectrum that shows a sharp drop to the low-frequency region at 800 cm−1. The several sharp characteristic peaks observed on the top of the broad curve are the features of the second spectral component. As in previous works, these peaks were correlated with bond vibrations as well as with appropriate infrared absorption and Raman spectrum (see below).
Table 1 contains spectral characteristics of different components in the emission spectra of CCl4 and benzene. In CCl4, emission signal IT (integral (“total”) intensity of emission spectrum), IB (emission intensity of (background) continuum emission component) and IP (“pure” emission signal of discrete component) were linearly dependent on the excitation intensity and remained frequency independent. In С6Н6, emission signal exhibited a complicated property dependence on many factors. Particularly, signal IT and IB appeared to be frequency-de- pendent rather than power-dependent, whereas signal IP displayed quadratic dependence on the excitation intensity and seemed to be frequency-independent. We noticed that in benzene signal intensity IT and IB could be decreased with the growth of exciting power instead of the increasing. For example, the irradiation of benzene at second harmonic of Nd:YAG laser (l2) with a power of 4 mW had produced IT or IB signal practically of the same intensity as ones produced by a more enhanced exciting power of Xe-lamp beam. At the same time, the emission signal IT or IB observed under irradiation at main frequency (l1 = 1.06 m) was decreased compared to ones for decreased intensity at l2. It was particularly surprising because it is well-known that radiation at l1
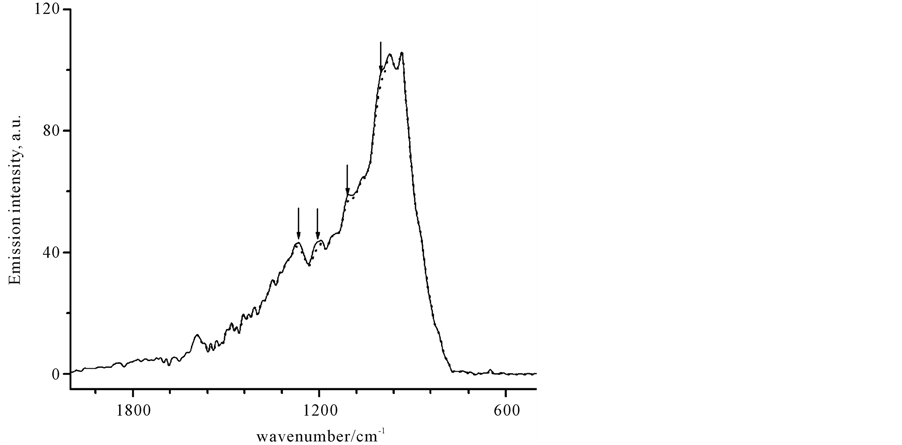
Figure 2. Typical IR-emission spectrum of the neat organic liquids. The background-like spectral component is shown as the dotted line. The light-induced gain peaks from the carbon tetrachloride sample are clearly visible on the continuum spectrum (solid).

Table 1. Spectral parameters of IR emission in liquid CCl4 and С6Н6.
Notes: HWHM is the half-width of the spectral line at half-maximum; A.u. is an arbitrary units; IT is the intergral (total) intensity of the IR emission spectrum; IP is the “pure” intensity of the stimulated IR emission spectrum with the background washed off; IB = IT − IP is the emission signal of continuum (background-like) component; G = (IT − IB)/(IT − IP) is the gain factor; The G values are the average of the five measurements.
absorbed by the overtones of CH stretching vibrations of benzene [22] and therefore, had to give rise for more intense infrared radiation. This is telling us, that the background emission signal is a complicated process and its origin is not entirely clear.
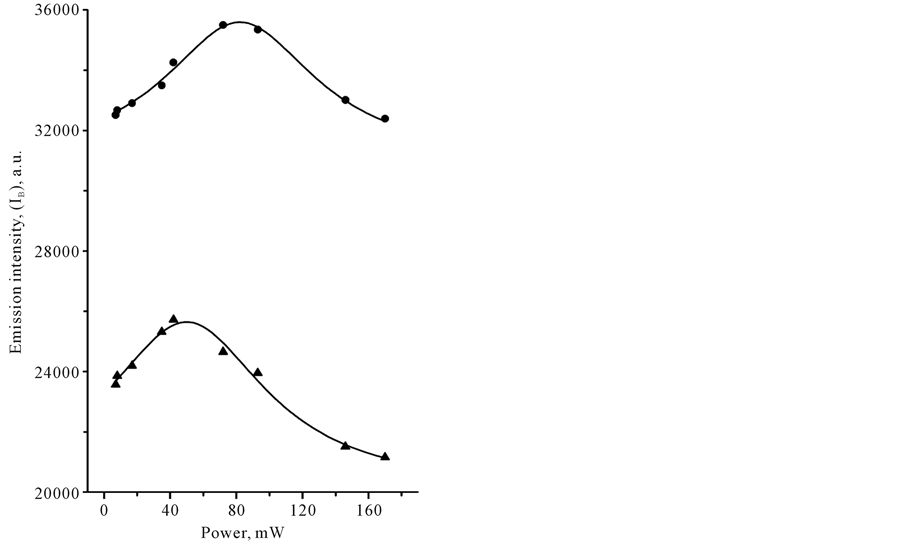
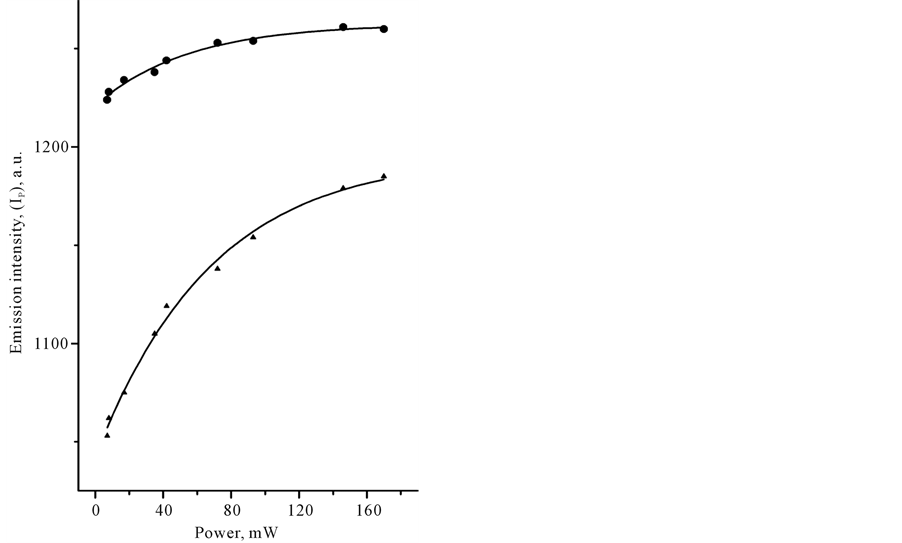
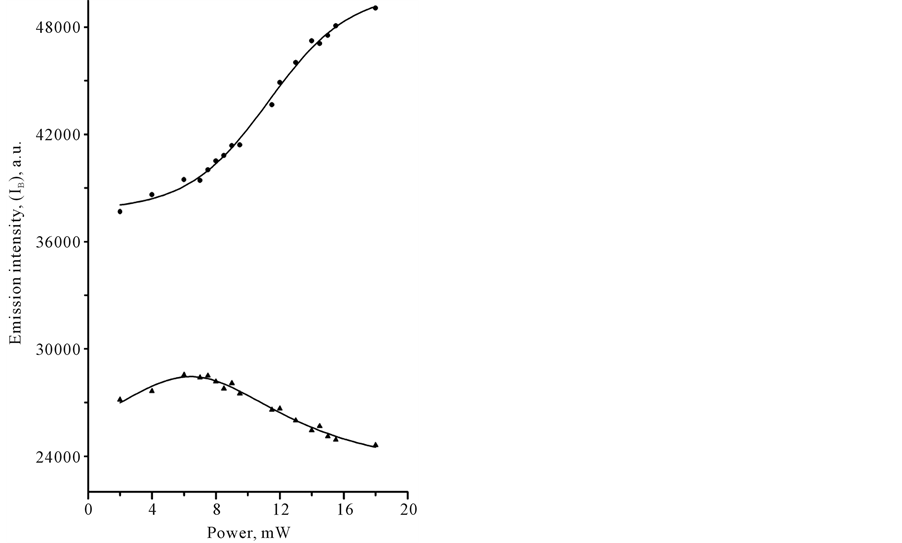
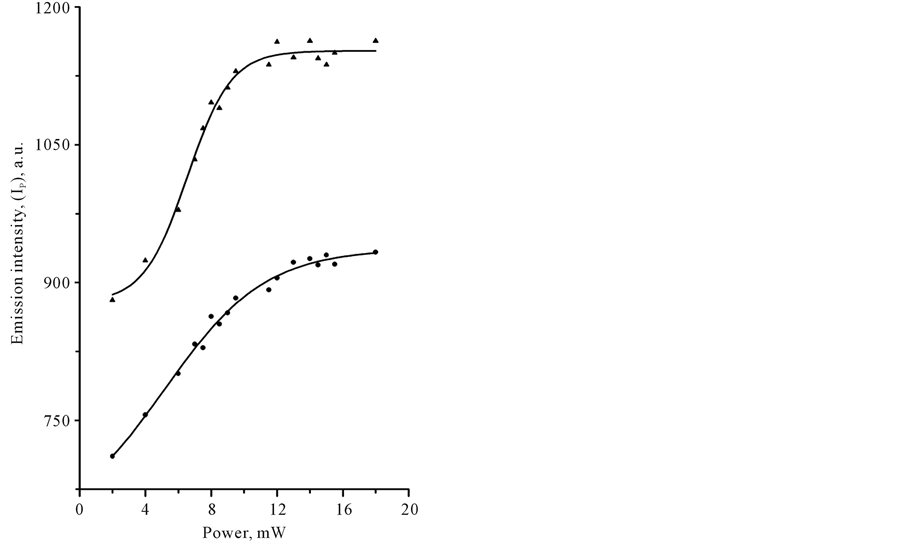
In Table 1 we compared signal intensities of the two spectral components in the infrared region between 1800 and 400 cm−1, using coefficient G (G = IT − I B/IT − IP). In a certain sense, coefficient G is the gain coefficient of stimulated emission signal. As it can be seen, the relatively large signal gain G in CCl4 and benzene was observed under Xe-lamp irradiation. In the case of laser irradiation, G coefficient in CCl4 remained practically the same at the level of approximately 0, 8%, whereas G coefficient of benzene was varied from 0.4 to approximately 1.5% with changing of the illumination conditions. Closer examination of the power-dependence of both spectral components, IB and IP, with the use of cw-low-power sources revealed some interesting details in spectral behavior of CCl4 and C6H6 species. Figure 3 shows plots of LIRE continuum and discrete signal powers of carbon tetrachloride and benzene vs. Xe-lamp excitation intensity. It should be noted, that the observed background signal IB, common to both species, is somewhat larger in C6H6. This background is observed without adsorbed molecules. It was increasing almost linearly with the input power to a point where the signal started to decrease, as shown in Figure 3(a). The solid lines are Lorentzian fits to the point data. This feature reveals the saturation of the broadband pump by a Xe-lamp. At the same time, Ip signal intensity was progressively growing with the exciting intensity of Xe-lamp, as can be seen in Figure 3(b). The solid lines indicate quadratic fits to the point data, displaying a nonlinear power-dependence of signal intensity Ib in both organic liquids. These data clearly show that both signals, IB and IP are caused by a nonlinear process(es) and most likely these processes differ in origin. Strange as it may seem, there was no essential difference in the medium response between Xe-lamp and Nd:YAG laser excitation under given experimental conditions. The power-dependence of LIRES signal vs. laser excitation intensity at l2 nm is presented at Figure 4. Given observations imply that the LIRES signal strongly depends on the intrinsic material properties and source’s parameters. Figure 4(a) shows plots of signal power IB of liquid species as a function of input laser power. In CCl4, the emission signal IB increased without threshold and this is followed by a sharp decrease. In C6H6, a small plateau in signal intensity followed by a sharp linear increase and the onset of the nonlinear response. In both cases, the solid lines are sigmoid fits to the data points. As in the first case, these features reveal the power-limiting capacity and the square-low-non- linearity of the material response as well. Figure 4(b) shows plots of signal power of IP discrete component for carbon tetrachloride and benzene vs. excitation laser intensity. In CCl4, as in benzene, exponential growth in IP signal intensity in the emission spectrum was observed. The solid lines are quadratic fits to the experimental data. The obtained results indicate that the material response produced by different low-power cw-sources is similar in appearance. It means that in both cases underlying nonlinear mechanism(s) could be similar and IP signal may originate from pumped vibrational sublevels of electronic ground state. If our previous assumption concerning the nature of a discrete component in light-induced infrared [17] [19] [20] emission (LIRE) spectrum is correct, the two-wave mixing mechanism had to work under Xe-lamp and as well laser excitation. It is significant that liquid benzene and CCl4 possess a key feature, requisite for this process, which is the third-order optical susceptibility. Indeed, cubic nonlinear properties of liquid benzene and CCl4 substances are well-known. However, the heterogeneity of an exciting field, which is also necessary for two-wave mixing process, is not shared by laser for at least one-color beam excitation. In this case, the heterogeneous field may only arise from
 (a) (b)
Figure 3. Plots of the IR-emission IB continuum (a) and IP discrete (b) signal output power versus incident Xe-lamp power with an input multicolor beam of 320 - 700 nm obtained in liquid samples of benzene (●) and tetracarbone chloride (▲) at 20˚C.
 (a) (b)
Figure 4. Plots of the IR-emission IB continuum (a) and IP discrete (b) signal output power versus incident Nd:YaG laser power with an input wavelength of 532 nm obtained in liquid samples of benzene (●) and tetracarbone chloride (▲) at 20˚C.
the field scattered by the molecules and/or reflected from the surface. Due to the particular low-intensity laser beam ordinary Raman scattering obviously could not play a marked role in production of IR-emission signal. Therefore, other mechanisms have been proposed that may influence the spectral properties of the investigated species.
The liquid CCl4 and benzene, as the transparent organic species, possess the Kerr-nonlinearity [23] , which is well-known to be dominant nonresonant nonlinearity. The Kerr-nonlinearity, as a rule, is associated with the self-focusing effect [24] -[27] . The latter occurs when light modifies a medium in such a way, that it creates intensity-dependent focusing lens. It increases the beam intensity enormously and enhances all nonlinear optical effects.
Self-focusing has been widely studied in many different media [28] -[32] . Such studies were usually performed using high-power laser pulses. Meanwhile, continuous-wave self-focusing at low-power level was seen in gas [33] and nematics, materials with a large cubic nonlinearity [34] -[36] . As the self-focusing properties of benzene and carbon tetrachloride are well-known, it is reasonable to assume, that this effect may also took place under our experimental condition. This is not incredible as it may be seen at first sight. Indeed, in early works it was shown that a low-power laser excitation of transparent organic substances, including CCl4, changed refractive index across the beam width [37] -[39] . A variation of the refractive index may be as small as 10−8 [40] . Despite of very small value, such changes may produce a measurable lens effect. The lens may be created either through temperature dependence of the refraction index or through numerous other nonlinear effects including self focusing effect. The later could lead to remarkable lowering of the thresholds for other nonlinear process such as self-phase modulation or the stimulated Raman scattering [41] [42] . It should be noted, many experimental evidences exist that stimulated Raman scattering is initiated by self-focusing process [24] -[27] [36] [41] - [44] . As such, stimulated Raman scattering may take part in selectively populating of vibrational levels, consequently leading to the generation of mid-infrared emission. Indeed, the theoretical possibility to observe the process of generation of infrared radiation concurrent with stimulated Raman generation has earlier been considered by a number of authors [45] -[47] . According to this consideration, large-amplitude coherent vibrations will be produced under stimulated Raman scattering, and if these molecules have an electric dipole moment, infrared radiation will be emitted at the vibrational frequencies. We believe, despite the particular low-intensity of laser beam used in our experimental conditions, high Kerr nonlinearity of investigated organic species (liquid CCl4 and C6H6) may lead to self-focusing process, whose role in production of mid-infrared emission may be not so negligible as one could imagined. Further work is being undertaken to understand this phenomena.
3.2. Infrared Emission Spectra in the 2100 - 500 cm−1 Range
Of the great interest are the spectral features of discrete component in the light-induced infrared emission (LIRE) spectra which will be analyzed in detail. It is useful to begin with a consideration of benzene molecule, as the more complex specimen. This specimen is known to have D6h point group symmetry and 30 normal modes with 20 basic frequency (10 modes are doubly degenerated). The D6h has the centre of symmetry, so an exclusion rule exists between modes which are only Raman or IR-active. From 20 normal vibrations seven fundamentals are Raman-active and only four ones are active in infrared: three of them are in-plane vibrations (n18, n19 and n20), the fourth is the out-plane fundamental n11. However this molecule has a large number of infrared active combination, difference, and hot bands, throughout the mid-infrared region. Our observations shown, that all LIRE- active vibrations are localized in 2500 - 500 cm−1 spectral region. No signal was observed higher than 2800 cm−1. Similar observations were found for carbon tetrachloride, in which no bands were observed already above 1600 cm−1. (Data are not present). Figure 5 and Figure 6 show the infrared emission spectra of benzene in the 2100 - 500 cm−1 spectral region, where the strongest peaks are localized. The assignments to the peaks shown in the spectra of Figure 5 and Figure 6 including possible combination and overtone mode are listed in Table 2. This table presents the frequency values of the different bands observed during the illumination of benzene with use of both cw-lower-power sources, Xenon lamp and Nd:YAG laser. Table 2 does not include the smaller intensity peaks that occur between 2500 and 400 cm−1. Peak assignments were based upon frequencies correlation, symmetry arguments and assignments from Herzberg’s [48] . Mode labeling follows Herzberg’s notation. As it follows from the experimental data (see Table 2), the bands with symmetry class a2u, e2u, e1g, e2g and randomly b1u and b2u are enhanced in the LIRE spectra of benzene. As it is well-known, bands with a2u and e1u symmetry types are IR-active, while the bands with e1g and e2g symmetry are inactive in IR, being Raman-active, or/and
Table 2. Observed infrared frequencies for liquid-phase benzene and their approximate assignments.
Notes: v is variable intensity: vs and vw is very strong or very weak intensity; s, m, and w are strong, medium, and week intensity; sh means a shoulder; b means broad band; h means “hot” band; IR means infrared-active; R-Raman-active; TP-two-photon active; HR1a-hyper-Raman active, Tw (this work)―LIRE-active; *, **strongly overlapping bands; aRef. [48] ; bRef. [52] ; cRefs. [49] [50] [55] ; dRef. [53] ; fRef. [54] .
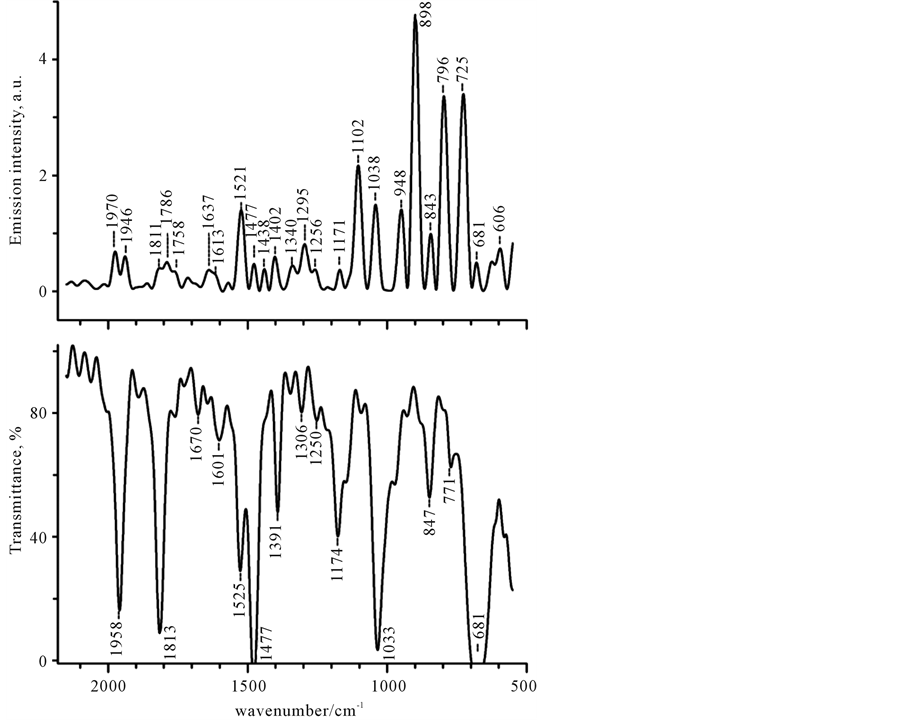
Figure 5. The IR-absorption and IR-emission spectra of C6H6 in the 2150 - 500 cm−1 region. The IR emission spectrum (upper curve) was recorded under illumination with a polychromatic light (320 - 700 nm, 220 mW). The IR-absorption spectrum is shown for comparison.
LIRE-active at the same time.
Spectrum shown in Figure 5 (upper curve) was recorded under Xe-lamp excitation. Infrared absorption (the bottom curve) is presented for comparison. As could be seen, the major part of emission peaks correlated with bond vibrations and the appropriate infrared absorption spectrum. It was therefore assumed that emission peak could be assigned to the same molecular vibration transition as those associated with the absorption band. Indeed, three basic IR-active bands (1477 (n13), 1038 (n18), and 681 (n4) cm−1) seen in Figure 5, are observed at practically the same positions, however, they have different relative intensity as compared to absorption ones.
The strongest bands are measured near 898, 796 and 725 cm−1 while the bands of a moderate intensity occur near 1521, 1102, and 1038 cm−1, as it can be seen in Figure 5. It should be noted, that all strong emission bands are not present in absorption spectrum, where only one weak band at 771 cm−1 is observed. The origin of the largest intensity peak at 898 cm−1 is unknown. It is not also observed in ordinary Raman scattering. However, it may be revealed in IR-absorption spectra of some benzene derivatives, belonging to the D3h symmetry group [49] -[51] . We found that, the frequency, as well as relative intensity, of this band strongly varied with changing the illumination conditions (see below). Two other intense peaks at 796 and 725 cm−1 may be derived from out-plane H bending motion [52] .
In spectral 1650 - 1400 cm−1 region, beside the fundamental n13, three other bands are revealed: of a moderate intensity 1521 cm−1 band and two closely spaced bands at 1438 and 1402 cm−1. The first one was identified as the IR-active n4 + n11 (e1u) mode, which is also seen in IR-absorption spectrum (see Figure 5). The latter corresponds to the Raman-active combination mode n6 + n20 (e1g), which has been observed with Raman scattering
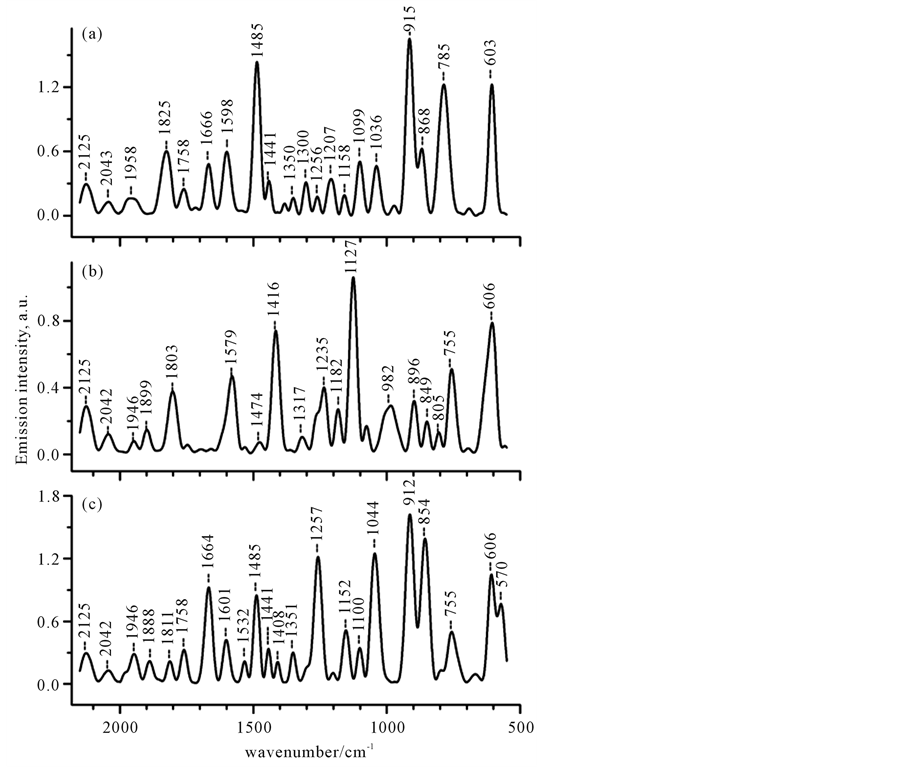
Figure 6. The effects of laser wavelengths. The optical response of liquid benzene to laser excitation at one-color excitation at (l1 = 1064) nm, 8 mW (curve a) or at (l2 = 532) nm, 4 mW (curve b), and at two-color-excitation at (l1 + l2) laser beam, 12 mW.
and is both Raman and LIRE-active. The origin of the peak at 1438 cm−1 is unknown. Besides the most enhanced bands there are many other additional features in this region, such as the small duplet peaks at 1637 and 1613 cm−1, probably corresponding to the frequencies of IR-active combination mode n14 + n18 (e1u) and Raman-active combination mode n2 + n18 (e2g), respectively.
In 1970 - 1750 cm−1 region, instead of two sharp features at 1958 and 1813 cm−1 in IR-absorption, only very weak distinct bands at 1970 and 1946 cm−1 and strongly overlapping bands at 1811, 1786, and 1758 cm−1 are observed in emission spectrum. The weak doublet around 1970, 1946 cm−1 was assigned to the splitting of 1964 cm−1 band, which corresponds to IR-active n11 + n19 (a2u) mode. The bands at 1811 cm−1 precisely match the IR-active bands at 1813 cm−1, which corresponds to n18 + n19 (a2u) mode. Possible assignments for other bands are listed in Table 2.
It should be noted that LIRE spectrum (Figure 5) recorded under Xe-lamp excitation exhibits features that are not present in the spectra recorded with a laser source (Figure 6). For example, in the case of Xe-lamp, there are no emission bands in spectrum, that are higher than 1980 cm−1, whereas Nd:YAG laser may produce several relatively intensive emission bands in this spectral region. For laser, frequencies of several bands may be shifted in the emission spectrum and relative intensity of the bands may be strongly changed as compared to Xe-lamp excitation. The linewidth in emission spectrum recorded with Xe-lamp is about 18 - 22 cm−1 FWHM (Full width of half maximum), whereas a linewidth for laser excitation is slightly wider ~22 - 28 cm−1 (curve a and c) and 26 - 30 cm−1 FWHM (curve b). The observed distinctions between Xe-lamp and laser excitation may arise from a difference in a wave-driven excitation mechanism.
Although spectra recorded at the different excited laser frequencies are very similar, they are not the same (see Figure 6). Therefore, it is interesting to compare the spectra recorded with different input frequencies. Figure 6(a), Figure 6(b), and Figure 6(c) show emission spectra for C6H6 measured at three different input frequencies, where the large-intensity peaks are displayed in the low-frequency 920 - 600 cm−1 spectral region. All these spectra are characterized by the presence of the single enhanced feature near 603 - 606 cm−1, which occurs as a symmetric single peak at 603 cm−1 or peak at 606 cm−1 with the slight asymmetric distortion toward higher frequencies or the doublet peaks at 606 and 570 cm−1 on the curves a, b and c, respectively. The 606 cm−1 band precisely matches the frequency of n18 (e2g) mode (intramolecular C-C-in-plane bending motion), which is Raman-active and is not observed in IR. Also, spectra showed in Figure 6 exhibit the common features around 900, 850 and 760 cm−1, with peak positions as well relative intensities being strongly varied with changing the exciting frequency. For example, the strongest enhancement of the band at 915 - 912 cm−1 is observed in the emission spectra measured at exciting l1 nm and l1 plus l2 nm laser beams, whereas, upon excitation with laser l2 nm beam, it occurs as a small peak with frequency red-shifted as compared to considered above, but it precisely matches the corresponding frequency in the spectrum measured upon Xe-lamp excitation. This feature has no assignments, as already mentioned above. It may correspond to the calculated “hot” band of 1038 cm−1 (a2u) [53] mode either deformation vibration of out-of-plane of C-H mode appearing in the distorted molecules of benzene derivatives [49] [51] . Thus in benzene molecule, the LIRE spectra reveal the only LIRE-active bands. The frequencies of the bands around 848 and 760 cm−1 are closely matched to corresponding frequencies of R-allowed n11 (e1g) and IR-active 771 cm−1 (a2u) modes, respectively. The relative intensity of these bands was strongly varied upon changing the input laser frequency, as can be seen in Figure 4.
In “fingerprint region” , we point out one more important common feature around 1480 cm−1, which is presented as the peak of high or moderate intensity at 1485 cm-1 respectively ( see curves a and c) and of very weak intensity at 1474 cm−1 (curve b). This peak precisely matched with the fundamental frequency IR-active n13 (e1u) mode. Meantime the emission spectrum (curve b) measured at one-color l2 nm laser beam demonstrates the strong intensity band at 1416 cm−1 which is not observed in spectra measured at l1 nm or at two-color l1 + l2 nm beams. This distinct band could be identified as the combination of n6 + n20 mode (e1g class symmetry), which is Raman-active and inactive in IR.
In spectral region 1780 - 1600 cm−1, there are no bands in the spectrum measured at l2 nm (Figure 6(b)), whereas for the l1 and l1 + l2 nm laser excitation (Figure 6(a) and Figure 6(c)), there are three additional distinct features with a different relative intensity observed near 1758, 1666 - 1664 and 1601 - 1598 cm−1. In Figure 6(a), two closely spaced peaks at 1664 and 1598 cm−1 are of the same intensity, whereas in the spectrum shown in Figure 6(c) the peak at 1664 cm−1 displays the relatively large enhancement as compared to one at 1601 cm−1. The 1664 cm−1 peak closely matches the combination frequency of n2 + n4 (a2u). The peak around 1600 cm−1 corresponds to either the combination frequency of n2+ n18 (e2g) (depolarized Raman-active vibration) or to the “quadrant” stretch vibrations of carbon ring (CC symmetric “quadrant stretching 1596 cm−1 is forbidden in IR, but allowed in Raman [51] ). At the same time, laser excitation at l2 nm produces the relatively strong single band around 1579 cm−1 with a small shoulder in the side of high frequencies (see Figure 6(b)), which however doesn’t appear in spectra shown in Figure 6(a) and Figure 6(c). This complex band is precisely matched with the calculated frequency of the other “quadrant” stretch vibrations of carbon ring, which may be revealed by IR-absorption spectroscopy in distorted molecule of substituted benzene, but could not in the spectrum of unsubstituted benzene [51] . Thus, the LIRE spectra shown in Figure 6 demonstrate the presence of a number of forbidden and/or Raman-active lines, which are inactive in IR-absorption, but are Raman and/or LIRE-active. These observations reflect the structure alterations, which may be due to one or more of the following effects:
1) Removal of D6h symmetry of free benzene molecules in the liquid state.
Because of the intermolecular forces, the structure may suffer distortion resulting thereby in lowering of their D6h symmetry and hence in changes vibrational modes. However, although some mode is not IR-active in free benzene, it becomes active in the benzene molecules in the liquid state.
2) Cluster formation.
Formation of dimers or higher-order molecules in illuminated region will lead to the increased number of bands in the infrared emission spectra. In this case the mutual exclusion rules for the single molecules will be altered, and some modes forbidden in IR for the single molecule, can become IR-active for complex.
3) Self-focusing effect.
Due to self-focusing process, benzene molecules trapped in narrow “channel” inside illuminated region (data not shown) that may produce changes in IR spectra similar to those observed on compression or during liquid to solid phase transitions.
Finally, in the high frequency region (higher 1800 cm−1), we point out the shift of out-of-plane bands as compared to IR-absorption. Thus, while absorption bands appear at 1811 (n18 + n19 (a2u)), 1906 (n11 + n14 (a2u)) and 1958 (n11 + n19 (e1u)) cm−1 for liquid benzene [48] , in the case of one-color excitation at l1 nm and l2 nm they are observed at 1825 and 1958 cm−1 or at 1803, 1899, and 1946 cm−1, respectively. In the case of two-color (l1 and l2) laser excitation, these bands are observed at 1811, 1888, and 1946 cm−1. Also, we point out that the relative intensity of these bands depended considerably on the input frequencies. It is obvious that the differences in the spectra presented in Figure 5 are qualitative rather than quantitative and originated predominantly from the interaction of the laser beam with the sample rather than thermal excitation. The most important question concerning the origin of the observed spectral changes still remains open. Further spectroscopic experiments are certainly required to clarify the mechanism of underlying phenomena.
From our experimental data it is clear, that IR emission spectra contain important information concerning the internal properties of investigated species as well as light-matter interaction.
4. Conclusions
Here we present a few selected examples demonstrating our recent efforts in finding unique applications for the LIRES technique as well as the understanding of the underlying phenomenon. As it follows from the experimental data, that mechanism of IR-emission may include several effects, such as two-wave-mixing, self-focus- ing or/and stimulated Raman scattering. The described features of the phenomenon are very important for spectroscopic applications because they have properties enlarging the information provided by traditional (linear) methods of IR absorption and RS.
We suppose that LIRES has a large measuring potential and advantages of many currently used spectroscopic methods of nonlinear optical mixing techniques (second-harmonic generation, sum- or difference-frequency generation, parametric processes or KAPC).
Acknowledgements
The financial support from the Presidium of The Russian Academy of Sciences (Program No. 23) is highly acknowledged.
Cite this paper
SofyaTerpugova,OlgaDegtyareva,ValerySavransky,EvgeniTerpugov, (2015) Light-Induced Mid-Infrared Emission of Liquid Carbon Tetrachloride and Benzene. American Journal of Analytical Chemistry,06,731-745. doi: 10.4236/ajac.2015.69070
References
- 1. De Blasé, F.J. and Compton, S. (1991) Infrared Emission Spectroscopy: A Theoretical and Experimental Review. Applied Spectroscopy, 45, 611-618.
http://dx.doi.org/10.1366/0003702914337029 - 2. Mink, J. and Keresztury, G. (1993) FT-IR Emission Spectroscopy and Its Applications. Applied Spectroscopy, 47, 1446-1451.
http://dx.doi.org/10.1366/0003702934067496 - 3. Chalmers, J.M. and Mackenzie, M.W. (1988) Emission Spectroscopy. In: Mackenzie, M.W., Ed., Advances in Applied Fourier Transform Infrared Spectroscopy, Wiley & Sons, Ltd., Chichester and New York, 170-188.
- 4. Griffiths, P.R. (1975) Chemical Infrared Fourier Transform Spectroscopy. Wiley-Interscience, New York.
- 5. Theophanides, T.M., Ed. (1984) Fourier Transform Infrared Spectroscopy: Industrial Chemical and Biochemical Applications. D. Reidel Publishing Co., Dodrecht.
http://dx.doi.org/10.1007/978-94-009-6418-1 - 6. Griffiths, P.R. and de Haseth, J.A. (1986) Fourier Transform Infrared Spectrometry. Wiley-Interscience, New York.
- 7. Moehlmann, J.G., Gleaves, J.T., Hudgens, J.W. and McDonald, J.D. (1974) Infrared Chemiluminescence Studies of the Reaction of Fluorine Atoms with Monosubstituted Ethylene Compounds. The Journal of Chemical Physics, 60, 4790-4799.
http://dx.doi.org/10.1063/1.1680982 - 8. Cook, D.J., Schlemmer, S., Balucani, N., Wagner, D.R., Harrison, J.A., Steiner, B. and Saykally, R.J. (1998) Single Photon Infrared Emission Spectroscopy: A Study of IR Emission from UV Laser Excited PAHs between 3 and 15 μm. Journal of Physical Chemistry A, 102, 1465-1481.
http://dx.doi.org/10.1021/jp9724434 - 9. Lin, L.T., Archibald, D.D. and Honigs, D.E. (1988) Preliminary Studies of Laser-Induces Thermal Emission Spectroscopy of Condensed Phases. Applied Spectroscopy, 42, 477-483.
http://dx.doi.org/10.1366/0003702884427852 - 10. Tsuge, A., Uwamino, Y. and Ishizuka, T. (1989) Applications of Laser-Induces Thermal Emission Spectroscopy to Various Samples. Applied Spectroscopy, 43, 1145-1149.
http://dx.doi.org/10.1366/0003702894203598 - 11. Hailey, D.M., Barnes, H.M., Woodward, C. and Robinson, J.W. (1971) A Catalog of Laser-Stimulated Infrared Emission Spectra. Analytica Chimica Acta, 56, 161-174.
http://dx.doi.org/10.1016/S0003-2670(01)82410-7 - 12. Hailey, D.M., Barnes, H.M. and Robinson, J.W. (1971) Infrared Fluorescence Spectroscopy as an Analytical Method: Quantitative Studies with a Long Pathlength Cell. Analytica Chimica Acta, 56, 175-183.
http://dx.doi.org/10.1016/s0003-2670(01)82411-9 - 13. Robinson, J.W. and Dake, J.D. (1974) Remote Sensing of Air Pollutants by Laser-Induced Fluorescence—A Review. Analytica Chimica Acta, 71, 277-288.
http://dx.doi.org/10.1016/S0003-2670(01)85431-3 - 14. Robinson, J.W., Hailey, D.M. and Barnes, H.M. (1969) Infrared Emission of Organic Compounds Stimulated by a Laser Beam. Talanta, 16, 1109-1111.
http://dx.doi.org/10.1016/0039-9140(69)80152-9 - 15. Terpugov, E.L. and Degtyareva, O.V. (1997) IR-Emission of Bacteriorhodopsin under Visible Light Excitation. 11th International Conference on Fourier Transform Infrared Spectroscopy, Book of Abstract M. 26.
Terpugov, E.L. and Degtyareva, O.V. (2001) Infrared Emission from Photoexcited Bacteriorhodopsin: Studies by Fourier Transform Infrared Spectroscopy. Journal of Molecular Structure, 565-566, 287-292.
Terpugov, E.L. and Degtyareva, O.V. (2001) FTIR Emission Spectra of Bacteriorhodopsin in a Vibrational Excited State. Biochemistry, 66, 1628-1637.http://dx.doi.org/10.1016/S0022-2860(00)00901-7
- 16. Terpugov, E.L. and Degtyareva, O.V. (2000) Investigation of Thin Films Using Fourier Transform Infrared Emission Spectroscopy. Proceedings of SPIE, 4129, 659-663.
http://dx.doi.org/10.1117/12.390672 - 17. Terpugov, E.L. and Degtyareva, O.V. (2001) Lysine IR-Emission Spectrum Excited by Moderately Intense Visible Radiation. Journal of Experimental and Theoretical Physics Letters, 73, 320-323.
http://dx.doi.org/10.1134/1.1374261 - 18. Gorelik, V.S., Gagrinov, A.G., Degtyareva, O.V., Savranskii, V.V. and Terpugov, E.L. (2006) Infrared Emission of Single-Cryctal Calcite under Broadband Short-Wavelength Excitation. Inorganic Materials, 42, 1251-1254.
http://dx.doi.org/10.1134/S0020168506110136 - 19. Gagarinov, A.G., Degtyareva, O.V., Khodonov, A.A. and Terpugov, E.L. (2006) Stimulated Infrared Emission All-Trans Retinal and Wild-Type Bacteriorhodopsin under CW Optical Pumping: Studies by FT-IR Spectroscopy. Vibrational Spectroscopy, 42, 231-238.
http://dx.doi.org/10.1016/j.vibspec.2006.05.002 - 20. Terpugov, E.L., Degtyareva, O.V., Gagarinov, A.G. and Savransky, V.V. (2004) Genaration of IR-Emission in Biological Films under Broad-Band Pumping. Bulletin of the Lebedev Physics Insitute (P.N. Lebede Physics Institute of the Russian Academy of sciences) (Russian), 12, 13-22.
- 21. Balashov, A.A., Vaguine, V.A., Viskovatich, A.V., Grishkovski, B., Lazarev, Y.A. and Terpugov, E. (1991) Two- Channel Fourier Spectrometer for Biophysical Studies. Proceedings of SPIE, 1575, 182-183.
http://dx.doi.org/10.1117/12.56492 - 22. Reddy, K.V, Heller, D.F. and Berry, M.J. (1982) Highly Vibrationally Excited Benzene: Overtone Spectroscopy and Intramolecular Dynamics of C6H6, C6D6, and Partially Deuterated or Substituted Benzenes. The Journal of Chemical Physics, 76, 2814-2837.
http://dx.doi.org/10.1063/1.443384 - 23. Tyson, D.G. and Jennings, B.R. (1991) Measurement of the “Optical” Kerr Effect Induces by Nanosecond Laser Pulses. Journal of Physics D: Applied Physics, 24, 645-653.
http://dx.doi.org/10.1088/0022-3727/24/5/001 - 24. Chiao, R.Y., Garmie, E. and Townes, C.H. (1964) Self-Trapping of Optical Beam. Physical Review Letters, 13, 479-482.
http://dx.doi.org/10.1103/PhysRevLett.13.479 - 25. Bloembergen, N. (1965) Nonlinear Optics. W.A. Benjamin Inc., New York.
- 26. Akhmanov, S.A. and Khokhlov, R.V. (1964) Problems of Nonlinear Optics. Nauka Publishers, Moscow.
- 27. Shen, Y.R. (1984) The Principles of Nonlinear Optics. John Wiley & Sons, New York.
- 28. Pilipetskii, N.F. and Rustamov, A.R. (1965) Observation of Self-Focusing of Light in Liquids. Journal of Experimental and Theoretical Physics Letters, 2, 55-56.
- 29. Talanov, V.I. (1970) About Self-Focusing of Light in Cubic Media. Journal of Experimental and Theoretical Physics Letters, 11, 199-201.
- 30. Kelley, P.L. (1965) Self-Focusing of Optical Beams. Physical Review Letters, 15, 1005-1008.
http://dx.doi.org/10.1103/PhysRevLett.15.1005 - 31. Alfano, R.R. and Shapiro, S.L. (1970) Observation of Self-Phase Modulation and Small-Scale Filaments in Crystals and Glasses. Physical Review Letters, 24, 592-594.
http://dx.doi.org/10.1103/PhysRevLett.24.592 - 32. Boyd, R.W., Lukishova, S.G. and Shen, Y.R. (Eds.) (2009) Self-Focusing: Past and Present Fundamentals and Prospects. Springer Science+Business Media, New York.
- 33. Bjorkholm, J.E. and Ashkin, A.A. (1974) Cw Self-Focusing and Self-Trapping of Light in Sodium Vapour. Physical Review Letters, 32, 129-132.
http://dx.doi.org/10.1103/PhysRevLett.32.129 - 34. Braun, E., Faucheux, L.P. and Libchaber, A. (1993) Strong Self-Focusing in Nematic Liquid. Physical Review A, 48, 611-622.
http://dx.doi.org/10.1103/PhysRevA.48.611 - 35. Tabiryan, N.V., Sukhov, A.V. and Zel’dovich, B.YA. (1986) Orientational Optical Nonlinearity of Liquid Crystals. Molecular Crystals and Liquid Crystals, 136, 1-139.
http://dx.doi.org/10.1080/00268948608074569 - 36. Etchegoin, P. and Phillips, R.T. (1996) Stimulated Raman Scattering Produced by Self-Focusing in Liquid Crystals. Physical Review E, 54, 2637-2646.
http://dx.doi.org/10.1103/PhysRevE.54.2637 - 37. Leite, R.C.C., Moore, R.S. and Whinnery, J.R. (1964) Low Absorption Measurement by Means of the Thermal Lens Effect Using an He-Ne Laser. Applied Physics Letters, 5, 141-143.
http://dx.doi.org/10.1063/1.1754089 - 38. Gordon, J.P., Leite, R.C.C., Moore, R.S., Porto, S.P.S. and Whinnery, J.R. (1965) Long-Transient Effects in Lasers with Inserted Liquid Samples. Journal of Applied Physics, 36, 3-8.
http://dx.doi.org/10.1063/1.1713919 - 39. Dovichi, N.J. and Harris, J.M. (1979) Laser-Induced Thermal Lens Effect for Calorimetric Trace-Analysis. Analytical Chemistry, 51, 728-731.
http://dx.doi.org/10.1021/ac50042a034 - 40. Hu, C. and Winnery, J.R. (1973) New Thermooptical Measurement Method and a Comparison with Other Methods. Applied Optics, 12, 72-79.
http://dx.doi.org/10.1364/AO.12.000072 - 41. Lallemand, P. and Bloembergen, N. (1965) Self-Focusing of Laser Beams and Stimulated Raman Gain in Liquids. Physical Review Letters, 15, 1010-1012.
http://dx.doi.org/10.1103/PhysRevLett.15.1010 - 42. Chiao, R.Y., Garmire, E., Johnson, M.A., Krinsky, S., Smith, H.A. and Townes, C.H. (1966) A New Class of Trapped Light Filaments. IEEE Journal of Quantum Electronics, 2, 467-469.
http://dx.doi.org/10.1109/JQE.1966.1074117 - 43. Akhmanov, S.A., Sukhorukov, A.P. and Khokhlov, R.V. (1968) Self-Focusing and Difraction of Light in a Nonlinear Medium. Uspekhi Fizicheskikh Nauk, 10, 609-636.
- 44. Chiao, R.Y., Gustafson, T.K. and Kelley, P.L. (2009) Self-Focusing of Optical Beam, Self-Focusing: Past and Present. In: Boyd, R.W., Lukishova, S.G. and Shen, Y.R., Eds., Topics in Applied Physics, Vol. 114, Springer Science+Business Media, LLC, New York, 129-143.
- 45. De Martini, F. (1966) Theory of the Infrared Generation by Coherently Driven Molecular Vibrations. Journal of Applied Physics, 37, 4503-4507.
http://dx.doi.org/10.1063/1.1708069 - 46. Gorelik, V.S., Zubov, V.A., Suschinski, M.M. and Chirov, V.A. (1966) About Possibility the Generation of Infrared Emission Concurrent Raman Scattering. Journal of Experimental and Theoretical Physics Letters, 4, 252-254.
- 47. Tannenwald, P.E. and Weinberg, D.L. (1967) Stimulated Raman Scattering in an Infrareds Active, Nontotally Symmetric Vibration of λ-Quartz. IEEE Journal of Quantum Electronics, 3, 334-335.
http://dx.doi.org/10.1109/JQE.1967.1074594 - 48. Herzberg, G. (1945) Molecular Spectra and Molecular Structure. Part II. Infrared and Raman Spectra of Polyatomic Molecules. Van Nostrand Comp., New York.
- 49. Moskovits, M., DiLella, D.P. and Maynard, K.J. (1988) Surface Raman Spectroscopy of a Number of Cyclic Aromatic Molecules Adsorbed on Silver: Selection Rules and Molecular Orientation. Langmuir, 4, 67-76.
http://dx.doi.org/10.1021/la00079a012 - 50. Goodman, L., Ozkabak, A.G. and Thakur, S.N. (1991) A Benchmark Vibrational Potential Surface: Ground-State Benzene. The Journal of Physical Chemistry, 95, 9044-9058.
http://dx.doi.org/10.1021/j100176a008 - 51. Lin-Vien, D., Colthup, N.B., Fateley, W.G. and Grasselli, J.G. (1991) The Handbook of Infrared and Raman Characteristic Frequencies of Organic Molecules. Chap. 17, Academic Press, Inc., San-Diego.
- 52. The Vibrations of Benzene Have Been the Subject of Intense Investigations as Summerized in Ref. and Following Works:
Sibert, E.L., Reinhardt, W.P. and Hynes, J.T. (1984) Intramolecular Vibrational Relaxation and Spectra of CH and CD Overtones in Benzene and Perdeuterobenzene. The Journal of Chemical Physics, 81, 1115-1134.
http://dx.doi.org/10.1063/1.447805
Thakur, S.N., Goodman, L. and Ozkabak, A.G. (1986) The Benzene Ground State Potential Surface. I. Fundamental Frequencies for the Planar Vibrations. The Journal of Chemical Physics, 84, 6642-6655.
http://dx.doi.org/10.1063/1.450717
Goodman, L., Berman, J.M. and Ozkabak, A.G. (1989) The Benzene Ground State Potential Surface. III. Analysis of b2u Vibrational Mode Anharmonicity through Two-Photon Intensity. The Journal of Chemical Physics, 90, 2544-2554.
http://dx.doi.org/10.1063/1.455951
Page, R.H., Shen, Y.R. and Lee, Y.T. (1988) Infrared-Ultraviolet Double Resonance Studies of Benzene Molecules in a Supersonic Beam. The Journal of Chemical Physics, 88, 5362-5376.
http://dx.doi.org/10.1063/1.454574
Ozkabak, A.G., Goodman, L. and Thakur, S.N. (1991) A Benchmark Vibrational Potential Surface: Ground-State Benzene. The Journal of Chemical Physics, 95, 9044-9058.
http://dx.doi.org/10.1021/j100176a008
Christiansen, O., Stanton, J.F. and Gauss, J. (1998) A Coupled Cluster Study of the 11A1g and 11B2u States of Benzene. The Journal of Chemical Physics, 108, 3987-4001.
http://dx.doi.org/10.1063/1.475801
Senent, M.-L., Palmieri, P., Carter, S. and Handy, N.C. (2002) The Vibrations of Benzene, Studied by “Multimode”. Chemical Physics Letters, 354, 1-8.
http://dx.doi.org/10.1016/S0009-2614(01)01327-6 - 53. Sur, A., Knee, J. and Johnson, P. (1982) The 1B2u←←1Alg Two-Photon Spectra of Several Isotopes of Benzene by Supersonic Beam-Multiphoton Ionization Spectroscopy. The Journal of Chemical Physics, 77, 654-669.
http://dx.doi.org/10.1063/1.443878 - 54. Acker, W.P., Leach, D.H. and Chang, R.K. (1989) Stokes and Anti-Stokes Hyper-Raman Scattering from Benzene, Deuterated Benzene, and Carbon Tetrachloride. Chemical Physics Letters, 155, 491-495.
http://dx.doi.org/10.1016/0009-2614(89)87192-1 - 55. Plíva, J., Johns, J.W.C. and Lu, Z. (1996) The Difference Bands v11-v4 and v10-v18 of Benzene at High Resolution. Molecular Physics, 87, 859-863.
NOTES

*Corresponding author.