American Journal of Analytical Chemistry
Vol. 4 No. 3 (2013) , Article ID: 29049 , 8 pages DOI:10.4236/ajac.2013.43016
Quick Single Run Capillary Zone Electrophoresis Determination of Active Ingredients and Preservatives in Pharmaceutical Products
Department of Chemistry, Sapienza University, Rome, Italy
Email: marina.franco@uniroma1.it
Received February 1, 2013; revised March 2, 2013; accepted March 15, 2013
Keywords: Capillary Zone Electrophoresis; Nitrogenous Compound; Parabens; Pharmaceutical Analysis; Quality Control; Validation
ABSTRACT
The paper deals with the development of a rapid and efficient Capillary Zone Electrophoresis (CZE) method for Quality Control analysis of pharmaceutical preparations containing antihistamines, decongestants, anticholinergic remedies and preservatives. Active ingredients of interest are: ChlorPheniramine Maleate (CPM), DiPhenhydramine Hydrochloride (DPH), Ephedrine hydrochloride (E), Isopropamide Iodide (II), Pheniramine Maleate (PM), Lidocaine hydrochloride (L), Tetracaine hydrochloride (T), Clopamide Hydrochloride (CH), DiHydroErgochristine (DHE), PhenylEphrine hydrochloride (PE) and Acetaminophen (A). Preservatives studied are: MethylParaben (MeP), EthylParaben (EtP), PropylParaben (PrP), ButylParaben (BuP), p-HydroxyBenzoic Acid (p-HBA). All these analytes were separated in a single run using 60 mM tetraborate buffer solution (TBS) pH = 9.2 as a BackGround Electrolyte (BGE) by using an uncoated fused silica capillary of I.D. = 50 mm and applying a voltage of 25 kV in the first part of the electropheretic run (up to 5.8 min) and 30 kV for the remaining time. The hydrodynamic pressurization of the inlet vial was 20 psi at 7.2 min. up to the end of analysis. Total separation time was of 7.5 min. The method was then successfully validated and applied to the simultaneous determination of active ingredients and preservatives. Good repeatability, linearity, and sensitivity were demonstrated. Precision of migration time (tm) was RSD% < 0.53% and of corrected peak area (Ac) was RSD% < 6.15%. The linearity evaluation gave 0.9928 < r2 < 1.000. LOD and LOQ, accuracy (recovery) and ruggedness were evaluated for each analyte demonstrating the good reliability of the method. Analyses of some pharmaceutical real samples were performed.
1. Introduction
Several analytical methods, employing different techniques, are being developed for separation of studied analytes. Nitrogenous compounds were separated by HPLC and CE (Capillary Electrophoretic) techniques. In particular, an HPLC-based analytical method for the determination (PM and E) [1] has been developed and successfully applied to nasal drops and tablets [2]. CZE-based methods [3-5] and MECK (Micellar Electrophoretic Capillary Chromatography) have been developed for determination of pseudoephedrine, acetaminophen, chlorpheniramine, ascorbic acid and dextromethorphan [6-8]. An accurate and rapid method based on CZE in TBS (pH = 8.5) for the determination of codeine, DPH, E and noscapine in a syrup formulation was described [9]. This method after validation was proposed as a routine one in Quality Control of pharmaceutical preparations. A CZE-MS method was also developed and applied in forensic field to determine E and others main drugs of abuse in hair samples [10]. Separation of CPM, PE and DPH was studied and optimized by CZE and MEKC ways by comparing selectivity of different media [11-15]. The best results were obtained by the MEKC separations. Another paper reported the CZE separation in non-aqueous media: a good resolution for 12 drugs analysis was obtained [16]. Another CZE method was proposed for simultaneous separation of five active compounds (CPM, PE, DPH, E and II). These analytes were separated under cationic form in about 8 min by using 60 mM TBS (at pH 9.2) as a BGE [17]. Recently some authors describe the CZE separation of lidocaine (L), prilocaine, procaine and tetracaine (T) in tris-phosphate buffer. The study regards the influence of capillary dimensions on the sensitivity and efficiency of a validated method [18].
Many papers are present in literature regarding determination of different parabens by RP-HPLC [19-24]. Such methods allow simultaneous parabens determination with good results, but this technique require high solvent amount. GC may be alternative used [25,26], but for parabens determination the preliminary derivatization to be determined render this techniques less attractive than HPLC.
Many papers dealt with parabens determination by different CE approaches. Some authors studied determination of preservatives in cosmetic and pharmaceutical products by MECC (Micellar Electrokinetic Capillary Chromatography) [27-35] and CEC (Capillary ElectroChromatogrphy) [36]. These methods are much more frequently applied than CZE [37,38], because of the possibility to separate p-HBA from its alkyl esters only in the presence of a stationary (or pseudo-stationary) phase. So MECC and CEC make possible the separation of all parabens by exploiting their different chain length; unfortunately these methods are time consuming and more complex to execute. CZE is the simplest method but migration time of p-HBA is much longer than parabens.
To our knowledge no publications are present in the literature regarding the simultaneous determination of eleven nitrogenous active compounds and five parabens including p-HBA by using The goal of the present study is to develop, optimize and validate a CZE-based analytical method for the simultaneous separation and determination of most commonly-used antihistamines, decongestants and long-acting anticholinergic drugs such as: CPM, DPH, E, II, PM, L, T, CH, DHE, PE, A and preservatives like as MeP, EP, PP, BP, p-HBA.
Presently, many commercial products contain these analytes in different combination. The determination of all parabens is highly important because of its commercial use can give potential contribution to the incidence of breast cancer [39-42]. The Quality Control analyses in pharmaceutical industry plan every component of the pharmaceutical mixture was extracted and determined separately. Consequently the complete analysis, performed by several steps, is very time and solvent consuming. For these reasons it is necessary to develop a new method employing techniques to analyze all components in a single step.
The CE offers many advantages: versatility, high efficiency, shorter analysis time and lower reagent consuming than HPLC or MECK techniques.
For this purpose, in this paper we describe a validated CZE method for simultaneous analyses of nitrogenous active compounds and parabens present in the pharmaceutical formulations.
2. Experimental
2.1. Apparatus
The analyses were carried by a P/ACE Beckman system (Beckman Instrument Fullerton, CA, USA) equipped with a UV-DAD detector. For ruggedness evaluation, electrophoretic separations were carried out on the Agilent 7100 CE instrument (Agilent Tecnologies, Waldbronn, Germany). The uncoated fused silica capillary (59.5 cm total length, effective length 49.5 cm, I.D. = 50 mm) used along the experiments was supplied by SGE (Melbourne, Australia). Detection wavelength was set at 214 nm. The sample injections were performed in a hydrodynamic mode (5 s under 0.5 psi).
2.2. Chemicals and Materials
All used reagents were of analytical grade purity.
In particular, MP, EP, PP, BP and p-HBA were obtained from Fluka (Buchs, Switzerland).
CPM, DPH, E, II, PM, L, T, CH, DHE, PE and A, sodium tetraborate, sodium hydrogen carbonate and Trizma® base were purchased from SIGMA-ALDRICH (Steinheim, Germany) and finally sodium hydroxide and acetonitrile were supplied by Carlo Erba (Milan, Italy). The commercially available pharmaceutical products taken into consideration were: FIENAMINA (Recordati SpA), POLARAMIN (Schering Plough SpA), BABY RINOLO (Bruno Farmaceutici SpA), INFLUMED (Iodosan SpA), TACHIFLUDEC (Angelini SpA) and TRIAMINIC FLU (Novartis Consumer Health SpA) . For solution filtering the syringe filters 0.45 mm (Millex HV, Millipore, MA, USA) were used.
2.3. Standard, Buffer and Real Samples Preparation
Tetraborate buffer was prepared dissolving the sodium tetraborate salt in distilled water. Tris-borate buffer was prepared by titrating Trizma-base with boric acid down to pH = 9.0. The carbonate buffer solution was prepared titrating sodium bicarbonate solution with sodium hydroxide to pH = 9.2. Standard stock solutions of studied analytes (at a 1 mg/ml concentration) were prepared in distilled water and stored at T = 4˚C. All the solutions used for calibrations were obtained by suitably diluting the stock solutions with a 60 mM borate buffer to get a desired analyte concentration. Except for BABY RINOLO, all the pharmaceutical samples analyzed were prepared in the following procedure: close to 400 mg (exactly weighted) of product were added of 4.00 ml acetonitrile then sonicated for 30 min after that, the supernatant solution was first centrifuged for 5 min (at 6000 rpm) and then filtered through the 0.45 µm syringe filter. Finally the solution was suitably diluted with a 60 mM TBS down concentration within the calibration linear range. The BABY RINOLO preparation, being a syrup, was simply diluted 1:1000 with a 60 mM TBS and filtered.
2.4. CZE Conditions
The electrophoretic separation was performed in normal mode with the anodic injection. The capillary, prior to its first use, was washed with 0.1 M NaOH solution for 15 min, then with water for 20 min and conditioned with BGE solution for 15 min. Daily the capillary was washed for 2 min with 0.1 M NaOH, 4 min with water and 4min with BGE solution. Two assessment runs were performed before starting the analyses. Between runs the washing time with BGE was of 2 min.
3. Results and Discussion
3.1. Method Development and Optimization
In order to propose a suitable method for routine analysis, it was necessary to evaluate the experimental conditions for the best resolution of studied analytes. In this step of work, parameters such as pH, BGE concentration, applied voltage and injection condition were explored.
3.1.1. Effect of BGE Composition, Concentration and pH
Although several buffer solutions such as carbonate, trisborate and tetraborate were taken into consideration as BGE, only the tetraborate buffer revealed the most promising to achieve the expected separation of the analytes taken into consideration in a single run. Thus, we studied how both the concentration and pH of the BGE affected the analytes separation. To this end a mixture of standard solutions were processed using tetraborate buffer differently concentrated ( from 30 to 70 mM by 10 mM steps) and each one at two different alcaline pH (8.5 and 9.2). Peak resolution, analysis time and peak broadening were evaluated: TBS 60 mM and pH = 9.2 were the best compromise value to achieve the separation of active compounds and preservatives, except the p-HBA which migrates slowly making the analysis time very long.
3.1.2. Wavelength of Detection
The most suitable wavelength for the simultaneous detection of both nitrogenous compounds and parabens was 214 nm. The UV spectra, recorded by an UV-DAD, showed this wavelength was suitable for quantitative analysis. No interfering peaks were observed analysing the real samples.
3.1.3. Effect of Applied Voltage and Hydrodynamic Pressure
The instruments used (P/ACE Beckman system and Agilent 7100) are able to create the potential gradient and applied the pressurization during the electrophoretic run.
The separation voltage was tested between 10 and 30 kV. Runs performed using low voltage (10 kV) took too long analysis time with also zone broadening. On the contrary, adopting high voltage (30 kV) the separation of nitrogenous compounds was incomplete. Satisfactory peaks resolution were obtained at 25 kV (Figure 1), but requiring a quite long analysis time. To achieve an optimal separation in a quite short time, the applied potential should be arised during electrophoretic run. In particular, increasing the applied voltage at 5.8 min from 25 to 30 kV, the separation of parabens was optimum, but p-HBA still migrated very slowly (20 min.).
In order to increase the p-HBA migration rate, we tried to apply the hydrodynamic pressure to the inlet vial during the electrophoretic run. In particular, after migration of the last paraben (MeP), the pressure of 20 psi to the inlet vial was applied. The pressurization reveal very advantageous and resulting analysis time was of 7.5 min.
For the best CZE separation of studied analytes, the optimal experimental conditions are:
• Uncoated fused silica capillary I.D. = 50 µm; total length = 59.5 cm; effective length = 49.5 cm;
• BGE solution 60 mM tetraborate buffer at pH = 9.2;
• Applied voltage 25 kV at start of run, 30 V at 5.8 min of run;
• Applied hydrodynamic pressure: 20 psi to the inlet vial at 7.2 min of run;
• Injection mode: 0.5 psi for 5 s;
• Detection wavelength 214 nm;
• Temperature 25˚C.
In these operating conditions the analysis time is 7.5 min (see Figure 2). The satisfactory separation of 16 analytes in a very short time became possible because of the rapidity and high versatility of capillary electrophoretic technique. The numerous experimental parameters which must be explored during the optimization of operating conditions for analysis, make this technique very selective and versatile.
3.2. Method Validation
In the optimized experimental conditions the proposed method was validated examining the following parameters: Precision, Linearity Range of detector response, LOD, LOQ, Accuracy (Recoveries) and Ruggedness.
3.2.1. Precision
The intra-day and inter-day repeatability of migration time and corrected peak area were evaluated analyzing the standard mixtures for 7 consecutive injections. The RSD% data are collected in Table 1.
3.2.2. Calibration Range
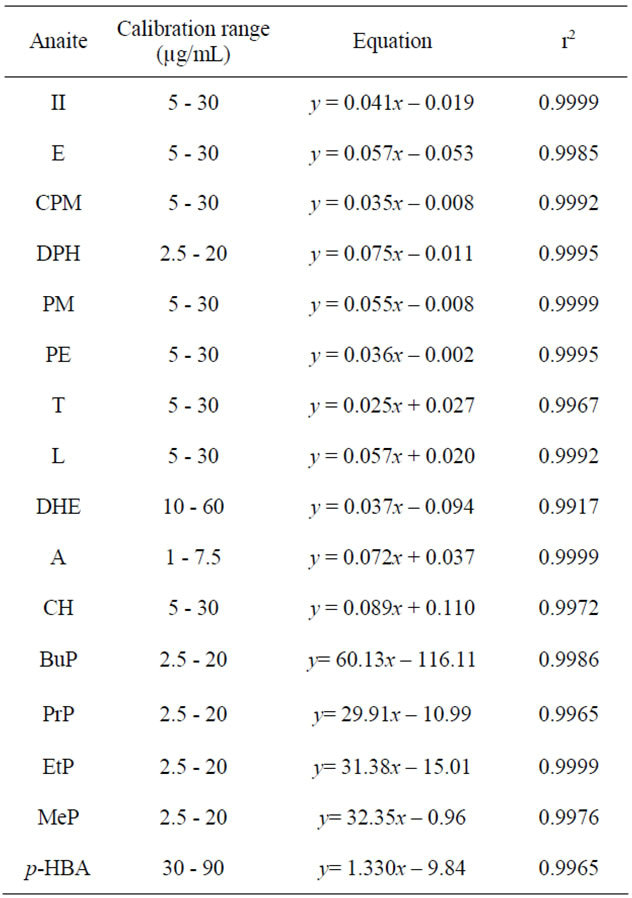
Five standard solutions containing sixteen analytes of interest were injected in triplicate. The resulting equations and relative linear correlation coefficient (r2) values are collected in Table 2.
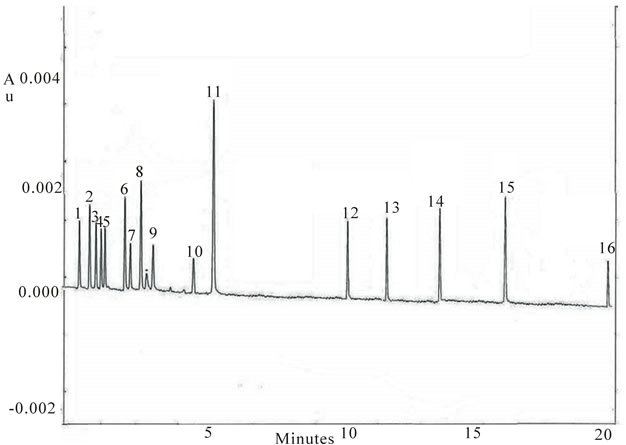
Figure 1. Electropherogram of standard mixture. Peak identification: (1) II, (2) E, (3) CPM, (4) DPH, (5) PM, (6) PE, (7) T, (8) L, (•) EOF, (9) DHE, (10) A, (11) CH, (12) BuP, (13) PrP, (14) EtP, (15) MeP, (16) p-HBA. Experimental conditions: Borate buffer 60 mM pH = 9.2; V = 25 kV (I = 80 μA); T = 25˚C; injection: 0.5 psi for 5 s; fused silica capillary I.D. = 50 µm, L = 59.5 cm, l = 49.5 cm; instrument P/ACE MDQ System (Beckman).
3.2.3. LOD and LOQ
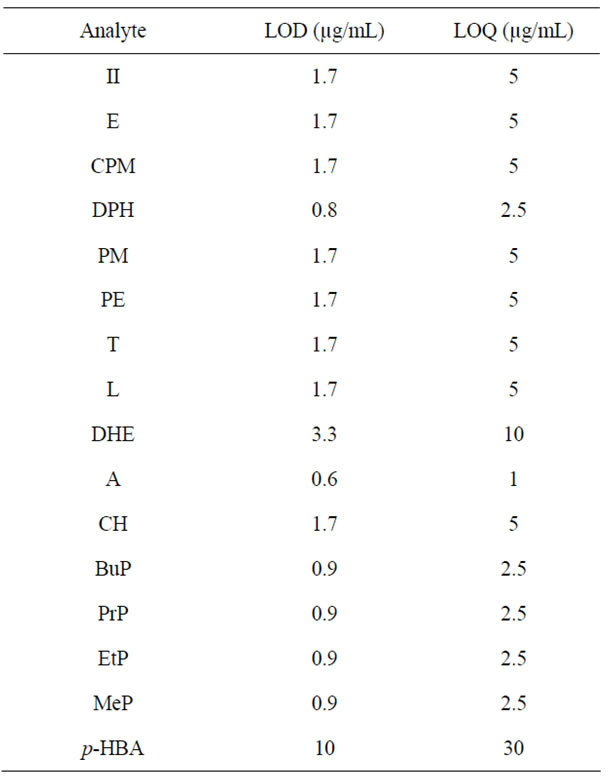
The LOD determined for all components, corresponds to the lowest concentration of analyte that can be confidently detected by the method, determined on the signalto-noise ratio (S/N) of 3. The LOQ corresponds to the lowest concentration of analyte that can be determined with suitable precision and accuracy, defined as S/N ratio of 10. These two parameters are collected in Table 3. The values are very similar to those reported in the literature data, obtained in analyses performed with the spectrophotometric UV-DAD detector (LOD: 0.3 - 10 μg/ml and LOQ: 1.0 - 10 μg/ml).
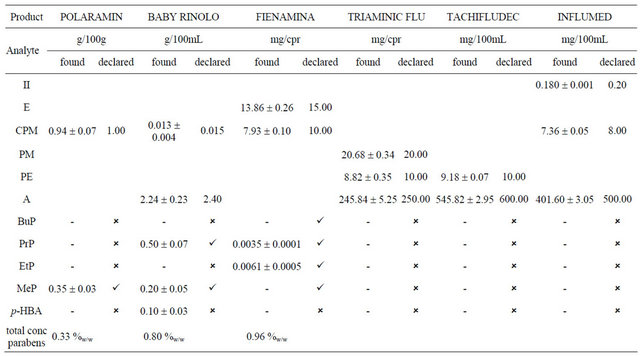
3.2.4. Analyses of Real Samples
For each pharmaceutical product, the found and declared quantity was reported in Table 4. For the products containing parabens, it was necessary to declare quantity found as %w/w according to the European regulation [43]. Analyses of real samples proved applicability of this method both determination of active ingredients both simultaneous separation and determination of active-com-
Table 1. Precision of both the migration time (tm ) and the corrected peak area (Ac) at low, intermediate and high concentration level, of all considered analytes under optimized experimental condition.
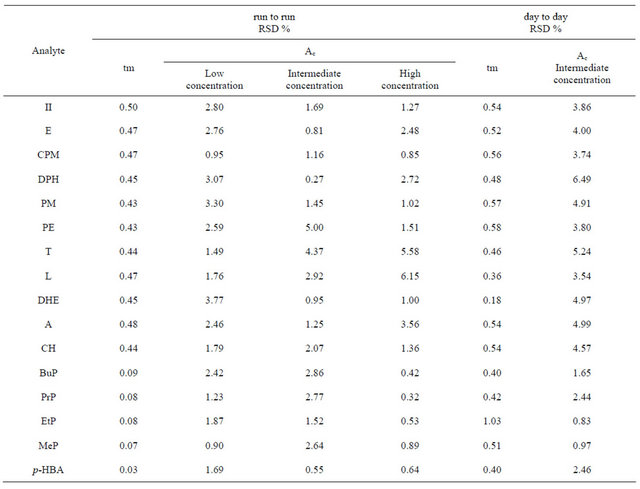

Figure 2. Electropherogram of standard mixture. Peak identification: as in Figure 1. Experimental conditions: Borate buffer 60 mM, pH = 9.2, V = 25 kV ( I = 80 μA); V = 30 kV ( I = 100 μA) at t = 5.80 min; p = 20 psi at t = 7.2 min; T = 25˚C; injection: 0.5 psi for 5 s; capillary and instrument: as in Figure 1.
Table 2. Method linearity data.
pounds and parabens. A typical electropherogram of commercial pharmaceutical preparation (Baby Rinolo syrup) is shown in Figure 3.
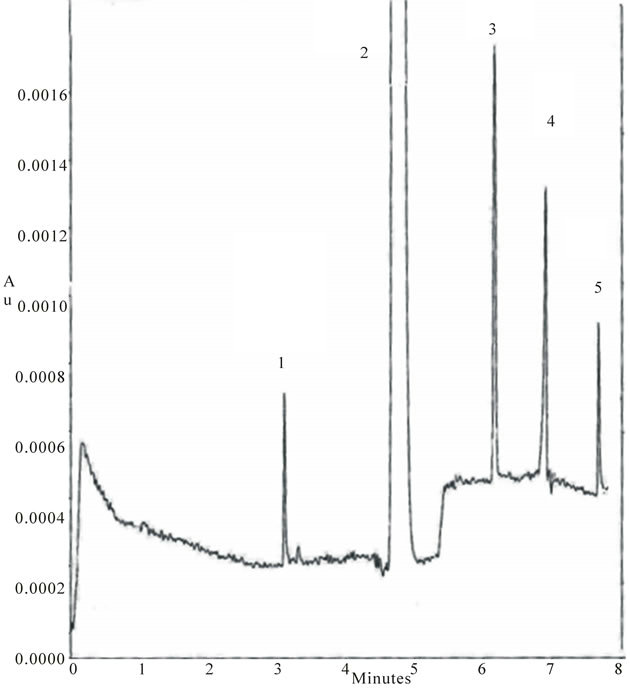
Figure 3. Electropherogram of real sample Baby Rinolo. Experimental conditions: as in Figure 2. Peak identification: (1) CPM (2) A (3) PrP (4) MeP (5) p-HBA.
Table 3. LOD and LOQ.
3.2.5. Accuracy
To evaluate method accuracy, the recovery assays on the commercial products were carried out. An aliquot of the
Table 4. Commercial product analysis.
real sample was analyzed according to the optimized method. Then, an identical aliquot of the real sample was fortified with known amounts of standards. The mixture was analyzed and the resulting concentration value was compared to the value obtained from analysis of sample without fortification. The obtained recoveries are ranging from 86.6% to 102.4%, demonstrating high accuracy.
3.2.6. Robustness
To this end, measurements were repeated by using an Agilent 7100 apparatus in optimized experimental conditions. This instrumentation adopt a differently shapedcartridge and the capillary total length is 48.0 cm, the effective length 39.5 cm (shorter than optimum length of capillary utilized on the Beckman instrument). The electropherogram obtained on Agilent apparatus, injectting the standard mixture at 50 mbar for 5 sec, is shown in Figure 4. Precision (run-to-run) of migration time and corrected peak area are ranging respectively from 0.03% to 0.97% and from 1.01% to 2.95% demonstrating the robustness of this method.
4. Conclusion
The study reports CZE method developed for the simultaneous separation and determination of eleven of the most common antihistamines, decongestants, anticholinergic remedies and five parabens. The best resolution was obtained in a very short time (about 7.5 min) using a simple tetraborate buffer as BGE in uncoated fused silica
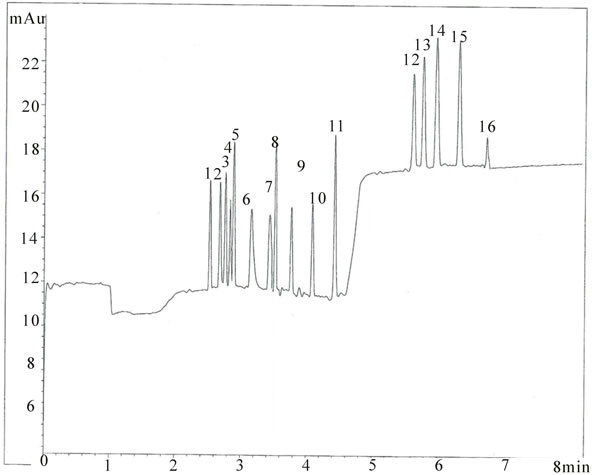
Figure 4. Electropherogram of standard mixture. Peak identification and experimental conditions as in Figure 2 except V = 30 kV at t = 4.6 min and pressurization of inlet vial at t = 6.6 min; fused silica capillary I.D. 50 μm. Instrument Agilent 7100.
capillary. Proposed method was applied to the real samples analysis using only a simple pre-treatment and dilution. Validation parameters confirmed the suitability of this procedure for the pharmaceutical analysis.
The developed method offers a valid alternative for routine analysis in pharmaceutical Quality Control.
REFERENCES
- J. T. He, X. H. Zhao, Y. Chen and L. Fang, Chinese Journal of Pharmaceutical Analysis, Vol. 28, No. 1, 2008, pp. 143-145.
- F. Buiarelli, F. Coccioli, R. Jasionowska and A. Terracciano, “Development and Validation of an MEKC Method for Determination of Nitrogen-Containing Drugs in Pharmaceutical Preparations,” Electrophoresis, Vol. 29, No. 17, 2008, pp. 3519-3523. doi:10.1002/elps.200700934
- L. Zhang, Q. Hu, G. Chen and Y. Fang, “Simultaneous Determination of the Active Ingredients in Composite Pseudoephedrine Hydrochloride Tablets by Capillary Electrophoresis,” Analytical Chemistry Acta, Vol. 424, No. 2, 2000, pp. 257-262. doi:10.1016/S0003-2670(00)01117-X
- B. Y. Yang, J. Y. Mo, X. Y. Yang and L. S. Wang, Sepu, Vol. 17, No. 5, 1999, pp. 477-479.
- Z. P. Zang, X. G. Chen and Z. D. Hu, Journal of LiquidChromatography and Related Technologies, Vol. 20, No. 19, 1997, pp. 3225-3245.
- W. P. Wang, Y. Li, Z. D. Hu and X. G. Chen, “Rapid and Ultrasensitive Determination of Ephedrine and Pseudoephedrine Derivatizated with 5-(4,6-Dichloro-S-triazin-2- ylamino) Fluorescein by Micellar Electrokinetic Chromatography with Laser-Induced Fluorescence Detection,” Journal of Chromatography, Vol. 1102, No. 1-2, 2006, pp. 273-279. doi:10.1016/j.chroma.2005.10.015
- J. P. Xie, J. Y. Zhang, J. Q. Liu, J. N. Tian, X. G. Chen and Z. D. Hu, Biomedical Chromatography, Vol. 19, No. 1, 2005, pp. 9-14.
- J. P. Xie, J. Y. Zhang, J. Q. Liu, J. N. Tian, X. G. Chen and Z. D. Hu, “Micellar Electrokinetic Chromatography with Laser-Induced Fluorescence Detection for Sensitive Determination of Ephedrine and Pseudoephedrine,” Journal of Separation Science, Vol. 27, No. 14, 2004, pp. 1211- 1214. doi:10.1002/jssc.200401756
- M. R. Gomez, L. Sombra, R. A. Olsina, L. D. Martinez and M. F. Silva, “Development and Validation of a Capillary Electrophoresis Method for the Determination of Codeine, Diphenhydramine, Ephedrine and Noscapine in Pharmaceuticals,” Farmaco, Vol. 60, No. 1, 2005, pp. 85-90. doi:10.1016/j.farmac.2004.11.002
- R. Gottardo, F. Bortolotti, G. De Paoli, J. Pascali, I. Miksik and F. Tagliaro, “Hair Analysis for Illicit Drugs by Using Capillary Zone Electrophoresis-Electrospray Ionization-Ion Trap Mass Spectrometry” Journal of Chromatography A, Vol. 1159, No. 1-2, 2007, pp. 185-189. doi:10.1016/j.chroma.2007.01.011
- M. R. Gomez, R. A. Olsina, L. D. Martinez and M. F. Silva, Journal of Pharmaceutical and Biomedical Analysis, Vol. 30, No. 3, 30, 2002, pp. 791-799.
- L. Suntornsuk, “Separation of Cold Medicine Ingredients by Capillary Electrophoresis,” Electrophoresis, Vol. 22, No. 1, 2001, pp. 139-143. doi:10.1002/1522-2683(200101)22:1<139::AID-ELPS139>3.0.CO;2-D
- L. Suntornsuk, O. Pipitharome and P. Wilairat, Journal of Phamaceutical and Biomedical Analysis, Vol. 33, No. 3, 2003, pp. 441-449.
- A. F. Marchesini, M. R. Williner, V. E. Mantovani, J. C. Robles and H. C. Goicoechea, “Separation and Determination of Pseudoephedrine, Dextromethorphan, Diphenhydramine and Chlorpheniramine in Cold Medicines by Nonaqueous Capillary Electrophoresis,” Journal of Pharmaceutical and Biomedical Analysis, Vol. 39, No. 1-2, 2005, pp. 285-289. doi:10.1016/j.jpba.2005.02.032
- M. D. Mertzman and J. P. Foley, “Comparison of Dodecoxycarbonylvaline Microemulsion, Solvent-Modified Micellar and Micellar Pseudostationary Phases for the Chiral Analysis of Pharmaceutical Compounds,” Electrophoresis, Vol. 26, No. 21, 2005, pp. 4153-4163. doi:10.1002/elps.200500351
- H. Siren, T. Hiissa and Y. Min, Analyst, Vol. 125, No. 9, 2000, pp. 1561-1568.
- F. Buiarelli, M. Franco, R. Jasionowska and G. Pelagalli, “CZE Separation of Nitrogenous Drugs in Cationic Form,” Analytical Methods, Vol. 6, No. 2, 2010, pp. 753-757. doi:10.1039/b9ay00277d
- D. Ilko and U. Holzgrabe, “Influence of the Capillary Diameter on the Separation Efficiency and Sensitivity: A Systematic Approach,” Electrophoresis, Vol. 33, No. 11, 2012, pp. 1494-1498. doi:10.1002/elps.201100575
- L. Nu˜nez, J. L. Tadeo, A. I. García-Valcárcel and E. Turiel, Journal of Chromatography A, Vol. 1214, 2008, p. 178.
- M. R. Lee, C. Y. Lin, Z. G. Li and T. F. Tsai, “Simultaneous Analysis of Antioxidants and Preservatives in Cosmetics by Supercritical Fluid Extraction Combined with Liquid Chromatography-Mass Spectrometry,” Journal of Chromatography A, Vol. 1120, No. 1-2, 2006, pp. 244-251. doi:10.1016/j.chroma.2006.01.075
- Q. Zhang, M. Lian, L. Liu and H. Cui, Analytica Chimica Acta, Vol. 537, 2005, p. 31.
- A. Myint, Q. Zhang, L. Liu and H. Cui, Analytica Chimica Acta, Vol. 517, 2004, p. 119.
- I. Garcia, M. C. Ortiz, L. Sarabia, C. Vilches and E. Gredilla, Journal of Chromatography A, Vol. 992, No. 11, 2003, pp. 1-2.
- R. Hajkova, P. Solich, M. Pospisilova and J. Sicha, Analytica Chimica Acta, Vol. 467, No. 91, 2002, pp. 1-2.
- M. Saraji and S. Mirmahdied, “Single-Drop Microextraction Followed by In-Syringe Derivatization and GC-MS Detection for the Determination of Parabens in Water and Cosmetic Products,” Journal of Separation Science, Vol. 32, No. 7, 2009, pp. 988-995. doi:10.1002/jssc.200800635
- M. C. Pietrogrande and G. Basaglia, “GC-MS Analytical Methods for the Determination of Personal-Care Products in Water Matrices,” Trends in Analytical Chemistry, Vol. 26, No. 11, 2007, pp. 1086-1094. doi:10.1016/j.trac.2007.09.013
- R. Driouich, T. Takayanagi, M. Oshima and S. Motomizu, Journal of Chromatography A, Vol. 903, No. 1-2, 2000, pp. 271-278.
- B. Baalbaki, M. D. Blanchin and H. Fabre, Analytica Chimica Acta, Vol. 463, No. 1, 2002, p. 15.
- H. Y. Huang, Y. C. Lai, C. W. Chiu and J. M. Yeh, Journal of Chromatography A, Vol. 993, No. 1-2, 2003, p. 153.
- P. E. Mahuzier, K. D. Altria and B. J. Clark, “Selective and Quantitative Analysis of 4-Hydroxybenzoate Preservatives by Microemulsion Electrokinetic Chromatography,” Journal of Chromatography A, Vol. 924, No. 1-2, 2001, pp. 465-470. doi:10.1016/S0021-9673(01)00717-8
- Y. H. Lin, S. S. Chou, F. Sheu and Y. T. Shyu, Journal of Chromatographic Science, Vol. 38, 2000, pp. 345-352.
- R. A. Frazier, E. L. Inns, N. Dossi, J. M. Ames and H. E. Nursten, “Development of a Capillary Electrophoresis Method for the Simultaneous Analysis of Artificial Sweeteners, Preservatives and Colours in Soft Drinks,” Journal of Chromatography A, Vol. 876, No. 1-2, 2000, pp. 213- 220. doi:10.1016/S0021-9673(00)00184-9
- J. Safra and M. Psopisilová, “Separation and Determination of Ketoprofen, Methylparaben and Propylparaben in Pharmaceutical Preparation by Micellar Electrokinetic Chromatography,” Journal of Pharmaceutical and Biomedical Analysis, Vol. 48, No. 2, 2008, pp. 452-455. doi:10.1016/j.jpba.2008.01.030
- F. Han, Y. Z. He and C. Z. Yu, “On-Line Pretreatment and Determination of Parabens in Cosmetic Products by Combination of Flow Injection Analysis, Solid-Phase Extraction and Micellar Electrokinetic Chromatography,” Talanta, Vol. 74, No. 5, 2008, pp. 1371-1377. doi:10.1016/j.talanta.2007.09.007
- S. He, Y. Zhao, Z. Zhu, H. Liu, M. Li, Y. Shao and Q. Zhuang, Talanta, Vol. 69, 2006, p. 166.
- A. De Rossi and C. Desiderio, “Fast Capillary Electrochromatographic Analysis of Parabens and 4-Hydroxybenzoic Acid in Drugs and Cosmetics,” Electrophoresis, Vol. 23, No. 19, 2002, pp. 3410-3417. doi:10.1002/1522-2683(200210)23:19<3410::AID-ELPS3410>3.0.CO;2-I
- E. Blanco, M. C. Casais, M. C. Mejuto and R. Cela, Electrophoresis, Vol. 29, 2008, p. 3229.
- U. D. Uysal and T. Güray, “Determination of Parabens in Pharmaceutical and Cosmetic Products by Capillary Electrophoresis” Journal of Analytical Chemistry, Vol. 63, No. 10, 2008, pp. 982-986. doi:10.1134/S1061934808100109
- E. J. Routledge, J. Parker, J. Odum, J. Ashby and J. P. Sumpter, “Some Alkyl Hydroxy Benzoate Preservatives (Parabens) Are Estrogenic,” Toxicology and Applied Pharmacology, Vol. 153, No. 1, 1998, pp. 12-19. doi:10.1006/taap.1998.8544
- S. Oishi, “Effects of Propyl Paraben on the Male Reproductive System,” Food and Chemical Toxicology, Vol. 40, No. 12, 2002, pp. 1807-1813. doi:10.1016/S0278-6915(02)00204-1
- R. Golden, J. Gandy and G. Vollmer, “A Review of the Endocrine Activity of Parabens and Implications for Potential Risks to Human Health,” Critical Reviews in Toxicology, Vol. 35, No. 5, 2005, pp. 435-458. doi:10.1080/10408440490920104
- D. Philipa, P. Darbre and W. Harvey, “Paraben Esters: Review of Recent Studies of Endocrine Toxicity, Absorption, Esterase and Human Exposure, and Discussion of Potential Human Health Risks,” Journal of Applied Toxicology, Vol. 28, No. 5, 2008, pp. 561-578. doi:10.1002/jat.1358
- European Economic Community (ECC) Instruction No. 93/95, Official Journal of the European Communities, Brussels, 1993, pp. 32-37.