American Journal of Analytical Chemistry
Vol. 3 No. 6 (2012) , Article ID: 20034 , 12 pages DOI:10.4236/ajac.2012.36054
Raman Optical Activity and Raman Spectra of Amphetamine Species—Quantum Chemical Model Calculations and Experiments
1Department of Chemistry, Technical University of Denmark, Lyngby, Denmark
2ReForensics, Lincoln, UK
3Biophysical Chemistry Group, Department of Chemistry, H.C. Ørsted Inst., University of Copenhagen, DK Copenhagen, Denmark
Email: *rwb@kemi.dtu.dk, shim@kemi.dtu.dk, lyric29p@aol.com, abdali@chem.dk.dk
Received April 19, 2012; revised May 23, 2012; accepted May 31, 2012
Keywords: Amphetamine; Raman; ROA; DFT; Molecular Orbital; Drugs; Forensic
ABSTRACT
Theoretical calculations and preliminary measurements of vibrational Raman optical activity (ROA) spectra of different species of amphetamine (amphetamine and amphetamine-H+) are reported for the first time. The quantum chemical calculations were carried out as hybrid ab initio DFT-molecular orbital calculations by use of the Gaussian 03W program, based on complete geometry minimizations of the conformational energy of the S-(+)-amphetamine molecule, the S-(+)-amphetamine-H+ ion, and the R-(–)-amphetamine molecule. Following this, harmonic frequency calculations have been made, providing information about the cation vibrational bands, expected in salts of single anions (chlorides) as well as in salts of anions with internal bonds (sulfates, hydrogen phosphates, etc.). It shows that the kind of anion should be given better attention, as so far it has often not been the case, when the spectra are employed for identification purposes. The DFT calculations show that the most stable conformations are those allowing for close contact between the aromatic ring and the amine hydrogen atoms. The internal rotational barrier within the same amphetamine enantiomer has a considerable influence on the Raman and ROA spectra. As predicted the experimental ROA spectra were found to depend on the chirality. Two street samples, provided by the London Police, were also measured and compared to the calculated ROA spectra. The street samples were found to contain different enantiomers of the protonated amphetamine-H+ sulfate. According to the present study the AMPH+ ion in aqueous sulfate solution seems to adopt a conformation in which the phenyl and ammonium groups are in transpositions, similar to what has been found in the solid state.
1. Introduction
Theoretical calculations and preliminary measurements of vibrational Raman optical activity (ROA) spectra of different species of amphetamine (amphetamine and amphetamine-H+) are reported for the first time. Amphetamine (AMP) is a chiral compound, DL-amphetamine, with CAS no. [300-62-9] and a melting point of about 138˚C - 146˚C. The stereochemistry is such that the molecule can be found with two enantiomeric forms: a) the R-amphetamine (CAS reg. no. [156-34-3]), which also can be found named R-(-)-amphetamine, L-AMP or levo-AMP, and b) the S-amphetamine (CAS reg. no. [51- 64-9]), which also can be named S-(+)-amphetamine, D-AMP or dextro-AMP. The two enantiomeric forms differ from each other by the three-dimensional geometry around the asymmetric C* atom (C8), as expressed in the formula C6H5-CH2-C*H(CH3)NH2. Consequently, difference in their biological functions can also be found, e.g. the S-(+)-isomer exhibits higher cardiovascular effect, but, greater pharmacologic potency than the corresponding R-(–)-isomer, perhaps up to 10 times [1-6]. This is why it is important that determination of AMP species should be carried out by methods that are capable of providing information on the enantiomeric purity and chirality. However, the amphetamine molecule has not, according to our knowledge, been chirally examined, except by electronic circular dichroism (CD), which showed that the AMP-CD signal was too weak to be conclusive [7]. Therefore, the following study can be considered as the first of its kind on the AMP molecules.
The interest in AMP is due to its effect on the nervous system, but mostly for its worldwide illegal abuse. It is one of the most common drugs for misuse found in the illegal market, and with various qualities due to the uncontrolled purity; a feature which unfortunately has been associated with mortal consequences. Identification of the provenience of a drug is of considerable interest from a forensic point of view and for legal matters. The purity and quality vary due to the illegality and lack of control of the market [8]. Medicaments on the market may in particular contain mixtures of S-(+)-isomer and R-(–)-isomeric forms—in varying amounts of one species with respect to the other—a matter that could influence the activity of the sample when used. Determination of the ratio of one enantiomer to the other, or the content of impurities in a sample has been a subject for different biophysical methods. However, we have earlier shown that confusions in determination of these molecules and in describing them were surprisingly more common than expected [9]. In that work, we showed that by using Raman and surface enhanced Raman spectroscopy (SERS) combined with quantum chemical DFT calculations, it was possible to demonstrate the differences between what people almost agreed on to be AMP and what really has been measured. The confusion among previously reported results occurred mainly in the differentiation between amphetamine itself and the protonated chloride or sulfate salts, formed because amphetamine is a weak base (pKa is ~9.8) and thus has the ability to become protonated and occur as salts. The need for identifying this drug and its related species has been sought for long time, in that the available methods are either not very accurate, e.g. due to limited selectivity (as it is the case for colorimetric tools), or they are time consuming, costly and/or require high concentrations of the sample (like in the case of chromatographic, NMR and X-ray methods).
Our attempt here is to use Raman and Raman optical activity (ROA) measurements, combined with quantum chemical calculations in order to achieve a thorough vibrational optical activity determination. This determination method was used to compare the results on two street samples, which the London Police office has provided. According to our knowledge, calculated and measured ROA spectra of AMP or protonated AMP have never been reported. This fact could be explained by the lack of sensitive and reliable ROA instruments, becoming commercially available only recently [10-12]. The attempt here to fill the gap is therefore of importance, especially also with respect to impurities associated with chirality. In the following, two species will be subject of the ROA study: AMP and AMPH+, which intentionally were chosen because, as mentioned above, they are found in most cases commonly referred to as AMP.
Today, Raman spectroscopy is a well-established tool for determination of structural changes of molecules regardless whether these molecules are found in gas, liquid or solid state, and it has been proven powerful for molecular studies, too. On the other hand, ROA, until a decade ago has suffered from the lack of commercial instrumentation, a matter that limited this tool to few research laboratories [13]. Nevertheless, ROA has been shown capable of providing rich information, especially about molecular structures, e.g. backbone, secondary and even tertiary structures [14-18]. In ROA, circularly polarized light is utilized, and chiroptical information about the examined molecule can be obtained. The detected signal is simply the intensity difference of right and left circularly polarized light. This may involve either measurement set-ups utilizing only incident circularly polarized (ICP) light, or only scattered circularly polarized (SCP) light, or the difference in both circularly polarized light of the incident and the scattered intensity, referred to as being dual circularly polarized (DCP). In our measurements we used the SCP setup. The theory of ROA has already been fully established, a few years after the phenomenon was reported [18], but a quantum-chemical calculation was first realized almost 20 years later [19], and the method became even more reliable once the development of the method for calculating frequency dependent polarizabilities [20] was found. Although ROA quantum-chemical calculations are still representing a challenge, the absolute configurations of CHFClBr [21, 22] and deuterated neopentane have already been achieved [23].
Experimentally, it has been demonstrated by e. g. Barron’s group at Glasgow University, that ROA spectra could be measured for many kinds of molecules of life, e.g. proteins, carbohydrates, nucleic acids and viruses. Most importantly, ROA can be obtained from aqueous solutions, i.e. mimicking the biological environment of the samples [24-27]. However, due to the nature of ROA, its signal is 3-5 orders of magnitude weaker than the conventional Raman signal, and thus, it usually requires high concentrations, e.g. above mM concentrations, and long acquisition times, e.g. several hours to obtain ROA spectra without noise. It is worth mentioning here that the rapid development of combining ROA with SERS into SEROA, both experimentally [28-31] and theoretically [32-34] so that it could soon make this tool attractive even for industrial applications.
Nomenclature
We have earlier found the Raman spectra of AMP, obtained by quantum chemical calculations or experimentally to be sensitive to the internal rotational degree of freedom around the C7-C8 bond [9]. The rotational geometry can influence the structure of the molecule, so that changes can be seen in the vibrational spectrum, as it will be shown below for the ROA spectra. We studied the internal rotations in AMP, i.e. rotation of the bonds attached to the chiral C8 atom, as it can be seen in Figure 1. To help illustrating the presentation of this work,
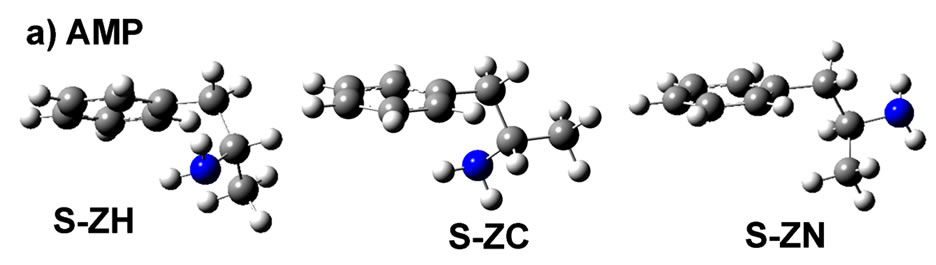
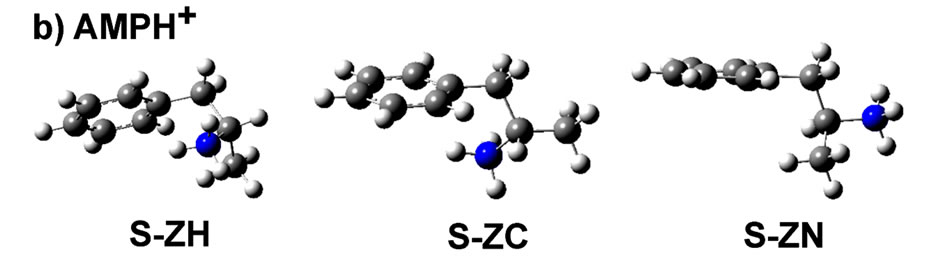
Figure 1. Calculated structures of lowest energy of a) AMP and b) AMPH+ for S-ZH, S-ZC and S-ZN conformations in the gas phase. The Z-letter in this notation represents the general skeleton shape of the molecule, seen from the viewer side. C1-C6 are the atoms of the ring, and C7, C8 and C9 are those seen to the right. C7 is attached to the ring through C1, N is attached to C8 and C9 is that of the methyl group. The planar Z-letter therefore is made from the atoms C1-C7-C8 and the final atom, respectrively H or C9 or N bound to C8. As an example in S-ZC the final atom is C9.
we will refer to the molecule by a notation that represents: 1) its enantiomer, e.g. S; 2) its skeleton shape, which when seen in the figure plan appears as the letter Z in Figures 1; and 3) the arrangement of the atoms that are attached to C8, i.e. N, C and H. Here, the numbering of the atoms should be considered as C1-C6 to represent the carbon atoms of the ring, and C7 and C8 are those to follow, right after the ring. Accordingly, the different conformers, studied in this work, can be denoted S-ZN, S-ZC and S-ZH, for both AMP and for the amphetammonium ion (designated AMPH+), as shown in Figures 1(a) and (b), respectively. Among the denoted stereoiso-meric/conformational geometries, the S-ZC conformer was found to be the most stable form in the AMP molecule in the gas phase [35]. In the AMPH+ sulfate [36,37] and di-hydrogen phosphate [38] crystal structures the conformation was found to be S-ZN.
2. Experimental
2.1. Sample Preparation
Samples of di-D-amphetammonium sulfate (di-D-AMPH+ sulfate) and DL-amphetammonium sulfate (DL-AMPH+ sulfate) were purchased from Sigma Aldrich. A concentration of 80 mM was prepared by dissolving 5.3 mg of di-D-AMPH+ sulfate and 5.9 mg of DL-AMPH+ sulfate in 180 μL and 200 μL of H2O, respectively.
Two street drug powder samples (Drug A and Drug B), provided by the London Police, were prepared by directly dissolving them in water, similarly to the standard samples, to obtain concentrations of 60 and 64 mg/mL, respectively. It has been found that these samples contained impurities, which gave a high background level of fluorescence in the spectra [9]. This necessitated cleaning of the sample solutions by centrifugation and filtering, carried out by microspinning for 5 min at 1000 rpm in filter vials (Lida Microspin Filter, 0.2 μm PES, PP w/RCV + cap, Cat# 8508-00). By these operations, amounts of estimated 10 % were lost but the fluorescence was reduced by about a factor of 0.01. The solutions were then kept and measured in closed 2 mL glass vials.
2.2. ROA Spectral Acquisition
The ROA spectra were obtained by using a ChiralRAMAN (Biotools Inc., USA) instrument, which simultaneously provides Raman and ROA spectra of the sample. In this SCP-type of instrument, the right (IR) and left (IL) circularly polarized scattered light beams are subsequently measured under identical conditions. The sum of the intensities (IR + IL) represents the Raman intensity, whereas their difference (IR – IL) represents the raw ROA intensity. The dimensionless circular intensity difference (CID or Δ) is defined as Δ = (IR – IL)/(IR + IL). The denominator is the conventional Raman scattering intensity. The ROA spectra shown below were obtained using a laser source of wavelength 532 nm, a power of 300 mW at the sample and an acquisition time of 10 hours, and they are baseline corrected. To prevent heat deposition in the sample, two shutters were mounted in the beam path, one before and one after the sample, stepwise synchronized with the spectral acquisition time. The acquisition was stopped when no improvement in the signal to noise ratio (S/N) was found. The noise level was unfortunately quite high for the used thin solutions.
2.3. Quantum Chemical Calculations
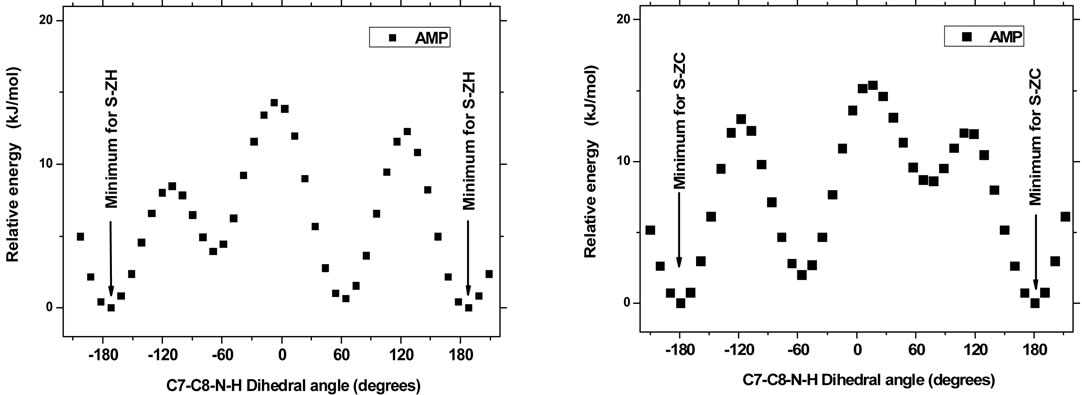
The quantum chemical geometry optimizations were obtained by calculations using the Gaussian 03W program package [39]. The calculations were repeated by use of the Spartan program package [40,41] with the same methods and basis sets. The harmonic frequencies and the corresponding first order spectra were found by use of Gaussian, including all three types of internal rotational conformations (around the C7-C8 bond) for both AMP and AMPH+, as shown in Figure 1. The AMP molecule has furthermore a quite marked energy dependence on the rotation around the C8-N bond. This behavior was studied by energy barrier calculations and the results are shown in Figure 2. In order to account properly for the electron correlation effects in the conjugated molecular system, the time-efficient density functional theory (DFT) approach was employed, including the B3LYP hybrid method, which incorporates a mixture of restricted Hartree-Fock and DFT exchange terms and the third order Becke parameterized gradient-corrected correlation functional of Lee, Yang and Parr. To represent orbitals basis sets of the 6-311G+(d,p) type were used.
The vibrational frequencies were computed from the second derivatives of the energy with respect to the Cartesian nuclear coordinates and then transforming to massweighted coordinates. Due to the fact that the surroundings, e.g. solvents, were ignored in these gas phase calculations, the wavenumber scales were—as often in such calculations —found somewhat higher than the experimental measurements. Empirical scale factors of the order of 0.95 has often been applied to obtain acceptable fitting to the experimental bands. In the present work we did not apply any empirical scale factor, and neither was any solvent nor continuum included. The band shape of the lines was modelled, using the Gaussian standard broadening procedure, in the far-from-resonance approximation at room temperature.
 (a)
(a)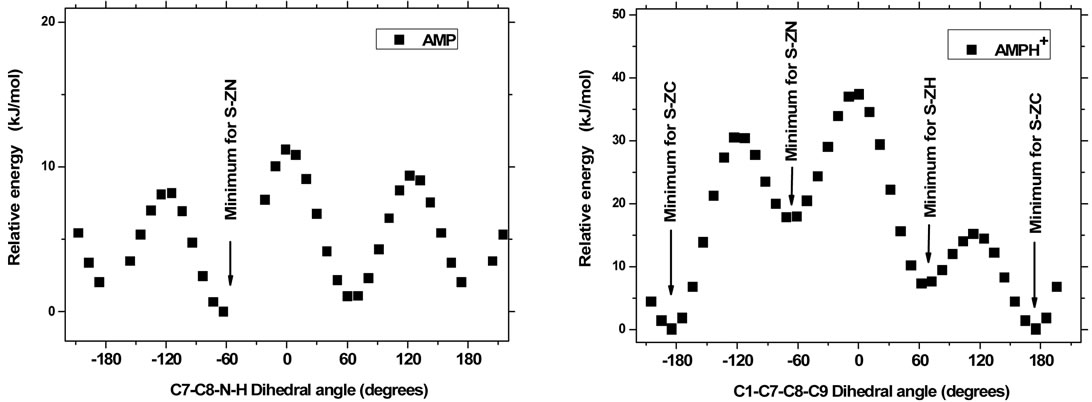 (b)
(b)
Figure 2. The AMP molecule - fixed in one of the minimum S-ZH, S-ZC or S-ZN conformations, respectively, has a rotational degree of freedom around the C8-N bond. Depending on preselected values of the dihedral angle C7-C8-N-H (abscissa), the molecule minimum energy varies considerably, as can be seen from plots (a, b and c). The amplitude variation is large when the amino group has contact with the aromatic ring (a and b) and smaller when the amino has no contact (c). For the ion AMPH+—because of the 3-fold repetition symmetry of the NH3+ group around the C8-N bond—the situation is more simple: The minimum energy corresponds to the situation in which two ammonium protons approach the ring in the S-ZC conformation, see plot (d). All energy points shown correspond to conformations in the gas phase, totally minimized except for the fixing of the abscissa to the shown values.
3. Results and Discussion
3.1. Structures
The quantum chemical calculation results are reported in Tables 1-2 and in the figures. The optimized structures and the corresponding minimized energies of AMP and AMPH+ are given in Table 1 and Figure 1. Comparing the energy values, the S-ZC conformations of both AMP and AMP-H+ clearly represent the most stable conformation, see Figure 1.
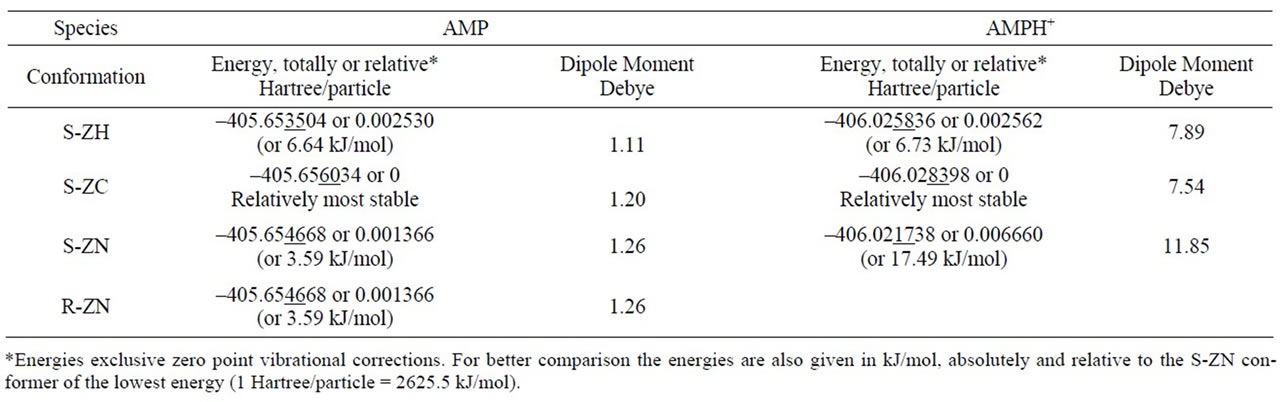
Table 1. Minimum energies and dipole moments of the optimized structures of AMP and AMPH+, calculated by use of 6-311G+(d,p)/B3LYP/DFT modelling. The corresponding calculated ROA spectra of the S-species can be seen in Figure 5.
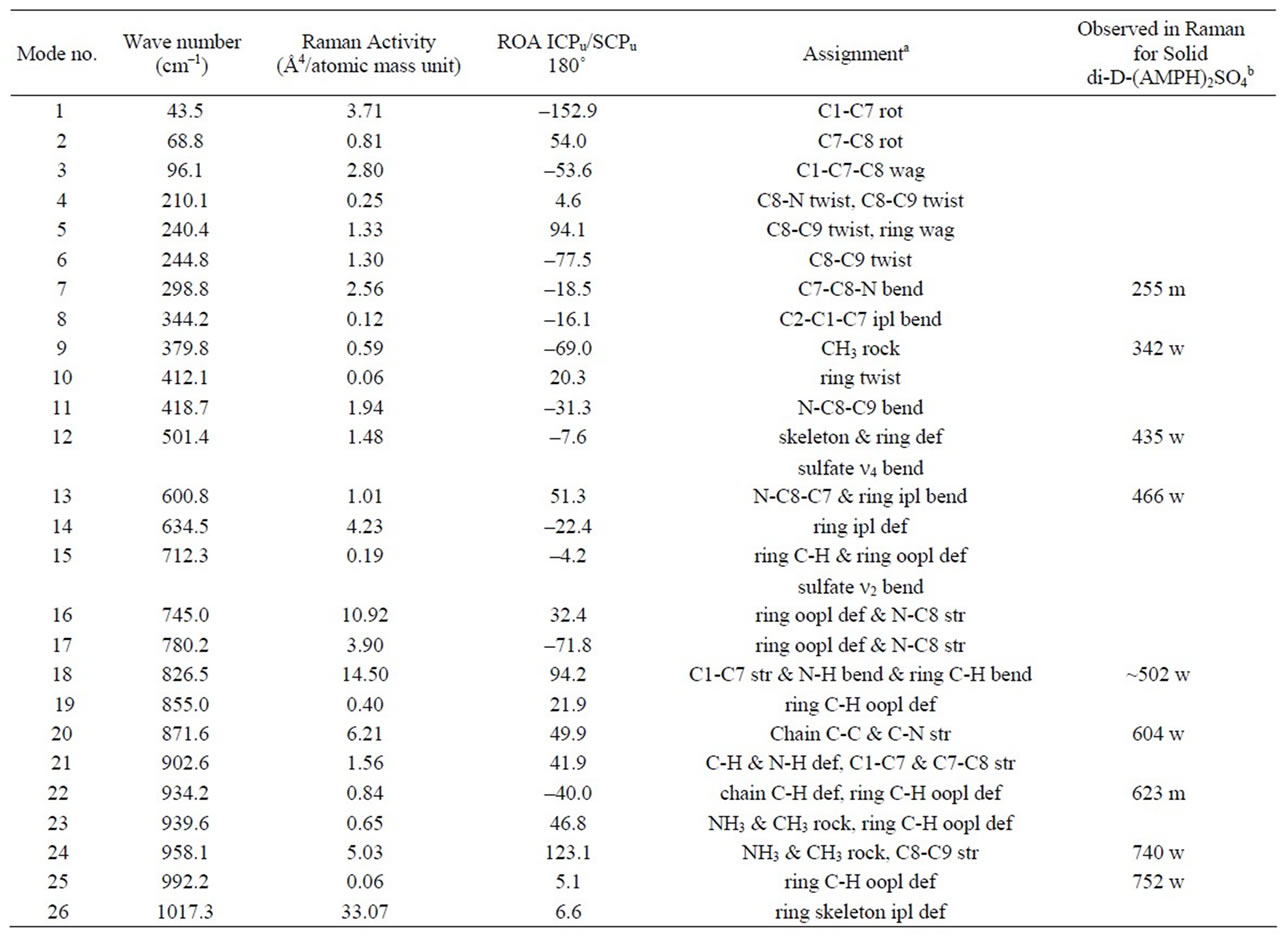
Table 2. Calculated vibrations of the AMPH+ ion in the S-ZN conformation according to gas phase 6-311G+(d,p)/B3LYP/ DFT modelling. Assignments are given for the modes that are also compared to measured Raman spectra of solid di-DAMPH+ sulfate [(D-AMPH)2SO4]. The columns are giving mode number, wavenumber, Raman intensity, ROA intensity, assignment of the mode and tentative assignment of the measured Raman spectrum (wavenumber, band intensity, respectively).
When studying the geometry of different AMP conformers, it was found that rotation of the NH2 amino group around the C8-N bond had an appreciable influence on the minimum energy. We investigated this influence by fixing the AMP molecule in each of the minimum S-ZH, S-ZC or S-ZN conformations, respectively, and minimizing the energy under the constraint that the dihedral C7-C8-N-H angles should stay at preselected values. These results were obtained with the Spartan program [40] using the same basis sets, and giving identical results. The dependence of the molecule minimum energy versus the dihedral angle (abscissa) is shown in Figure 2, plots (a, b and c). A considerable (amplitude) variation can be seen. The energy is low when a proton of the amino group has a near contact with the aromatic ring (plots a and b) and smaller when the amino has no contact (c).
The AMPH+ ion was found to behave somewhat differently, due to the 3-fold repetition symmetry of the ammonium NH3+ group around the C8-N bond. The situation is simpler: The minimum energy, see Figure 2, plot (d) corresponds to the situation in which two ammonium protons in the S-ZC conformation approach the aromatic ring.
We can compare this AMP calculation result to the results of Godfrey et al. [35]. These authors also found ZC as the most stable conformer in the gas phase: Their “structure I” with the dihedral angle of 174˚ was given as the most stable geometry both experimentally (millimetrewave rotational spectroscopy) and by means of their MP2/6-31G(d,p) modelling. This result compares well with our molecule, see Figure 2(b). From their spectroscopic experiments Godfrey et al. [35] also—as is to be expected—found small amounts of another comformation (named “structure II”) with the dihedral angle of –54 (energy 1.4 kJ/mol). This agrees also well with our Figure 2(b). The explanation for the high stability of the ZC conformation seems to be due to the internal close contact between the aromatic electrons and one of the amino protons. This non-classical hydrogen bonding [35] feature is displayed in Figure 3 (the distance between C1 and H was around 2.675 Å).
For the AMPH+ ion in the gas phase, the agreement between model calculations and the experimental X-ray crystal structures is less obvious. We explain this in the following way: When the ion structure was optimized as a separate ion in the gas phase, the stabilization came from the close contact (around 2.675 Å) between C1 and one of the ammonium protons, see Figure 3. In the known crystal structures [36-38] the anions interfere with the AMPH+ cations, making the ZN conformation favorable. The stabilization energy must come from the crystal lattice.
3.2. ROA Spectroscopy
In ROA spectroscopy, or generally in vibrational optical
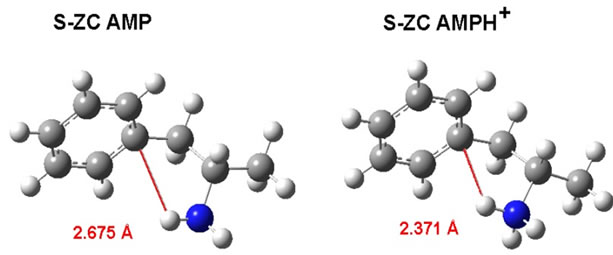
Figure 3. Comparison between the minimum calculated distance between the C1 and the amino H in the gas phase AMP molecule and the AMPH+ion. The reason for the stabilisation of these conformations seem to be the internal close contact between the aromatic electrons and the protons. In the known crystal structures the anions interfere and make S-ZN AMPH+ favorable.
activity spectroscopy, the large number of probed vibrational transitions makes it unlikely that a change in conformation of a chiral molecule should result in oppositely signed bands in the entire ROA spectrum [42]. Therefore, it should be possible to achieve knowledge on the absolute configuration from associating measurements of the enantiomers with quantum chemical calculations.
When the ROA spectra were calculated by the Gaussian program for both AMP and AMPH+ species the output came out in several ways, one of them given as the invariant ICPu/SCPu (180˚) in units of 104 Å5/AMU (AMU = atomic mass units). As mentioned in section 1, for ROA experiments there are three possible polarization schemes of measurement and calculation. These schemes are referred to as ICP, SCP or DCP, respecttively), depending on the experiment. Since we used the SCPu setup and a collecting angle of 180˚, where “u” denotes unpolarized scattering, the invariant ICPu/SCPu (180˚) is the relevant one here.
As a check of the absolute configurations, we calculated the minimized energies of the two opposite enantiomers, R(–) and S(+), for example of the AMP ZN configuration. The results are included in Table 1. The optimized model of the S-ZN is the one shown in Figure 1; R-ZN looked exactly like the mirror image. The calculated corresponding ROA spectra of these AMP R-ZN and S-ZN conformers are given in Figure 4. As the theory predicts the spectra were completely opposite to each other, throughhout the whole wavenumber range (0 - 3500 cm–1), Also, to our satisfaction, the minimum energy and dipole moment were observed with identical values (Table 1).
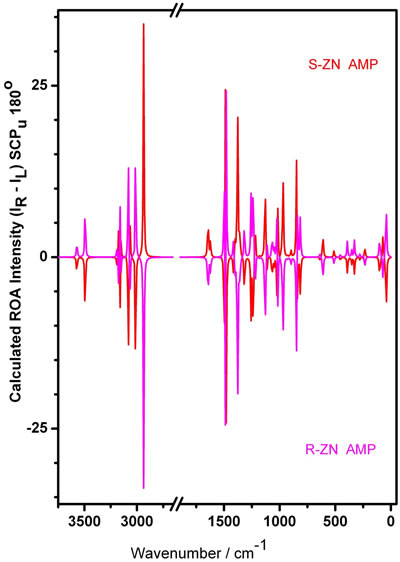
Figure 4. Quantum Chemical DFT/B3LYP/6-311G+(d,p) calculated ROA spectra for the S-ZN (red) and the R-ZN AMP molecule conformer in the gas phase (magenta). The region where no significant vibration is noticed has been omitted.
Calculated ROA spectra of the three different AMP and three different AMPH+ species are compared in Figure 5. The spectra of all conformers of AMPH+ and AMP differ considerably from each other in the whole wave-number range. Protonation of the amino-group has a large influence on the ROA spectra (compare the spectra of the same color). This is quite similar to the behaviour found for the Raman spectra [9]. Interestingly also the ROA spectra of AMP or AMPH+ respectively, depend on the internal rotation around the C7-C8 bond. This can only be interpreted as a result of the conformational isomerism, as depicted in Figure 1. It means that, even within the same species i.e. AMP or AMPH+, spectral differences arise as a result of different coupling schemes among the group vibrations depending on the geometry. Such a behavior has been seen before [43]. This reveals that such differences are exclusively attributable to the internal rotations, as any chirality difference within the same species would have appeared in opposition to each other, as seen in Figure 4.
To compare these theoretical results with experiments we note that most available samples are amphetamine salts. A measured Raman spectrum of the solid di-D-AMPH+
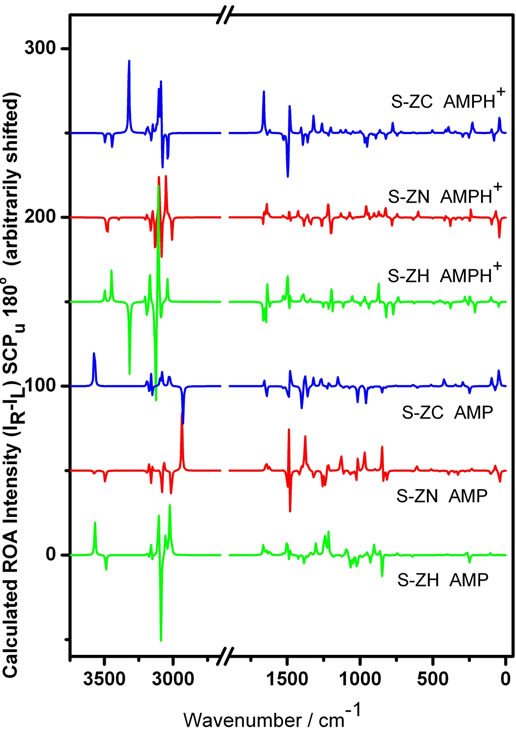
Figure 5. Calculated ROA spectra for three different conformations of AMPH+ (above) and AMP (below) using quantum chemical DFT/B3LYP calculations. Gaussian 6-311G+(d,p) and 6-311G(d,p) split valence basis sets were used for AMP and AMPH+, respectively. The differences due to internal rotation are obvious when comparing the spectra. The region where no significant vibration is noticed has been omitted.
sulfate is shown in Figure 6. The correspondence between this experimental Raman spectrum and a Raman spectrum calculated with a DFT/B3LYP/6-311G(d,p) model has been discussed previously [9]. In the present study the Raman and the ROA spectra for the AMPH+ ion were calculated with a better model. Some of the results (for the S-ZN AMPH+ ion) are reproduced in Table 2. The calculated ROA data can be seen in column 4 together with experimental data in the last column. Assignments for all 66 vibrations of the AMPH+ ion in the S-ZN conformation are given in the 5th column of Table 2, based on animated modes given by the Gaussian software [39]. These 66 modes are compared to the experimental data—in the last column—see also Figure 6. The assigning of these observed bands to the calculated modes has been done based on best wavenumber matching and also on the strengths of the peaks. Differences are noticed between the measured and the calculated wavenumber values of the modes. This is to be expected and is probably due to the insufficient modelling of the solid salt by an ion gas phase model, even though the calculated conformation has the same specific internal rotation (S-ZN) as found in the salt [36,37]. Differences may also be due to the sulfate (hydrogen bonded to the ammonium group) and the presence of fluorescing impurities.
To compare the calculated ROA results with experiments, we measured ROA spectra of amphetamine-H+ sulfate standards purchased from Sigma-Aldrich and of two street “amphetamine” samples, Drug A and Drug B, dissolved in water. ROA spectra of Drug A and Drug B, depicted in red and blue, respectively, are compared in Figure 7. Unfortunately the signals were relatively weak compared to the noise. Remarkably however, these two samples seem to be different enantiomers of the same species, as seen most noticeably in the regions 1100-950 and 1650 - 1450 cm–1. The spectral bands in these “finger-print” regions are mainly due to N-H angle deformation, ring C-C stretching and C-H in ring plane angle deformations, according to our calculations (see Table 2). The region around 1000 cm–1 is highly characteristic for AMPH+, as it has been discussed before [9].
With regard to ROA spectra of the standard samples, the DL-AMPH+ sulfate solution, as expected, did not show any ROA activity: Equal amounts of the R and S conformations cancel the ROA signal. In contrast to this the di-D-AMPH+ sulfate standard solution gave an ROA spectrum that is shown in Figure 8, compared to the two street samples, Drugs A and B. Previously Raman spectra for the same samples were studied [9] and bands observed at 1006 cm–1 and 981 cm–1 have been assigned to the AMPH+ and  ions, respectively (see also Table 2). It is worth mentioning that in spite of the fact that the
  ion has no direct chirality, its 981 cm–1 band can still be seen in the ROA spectrum. This is attributed to an
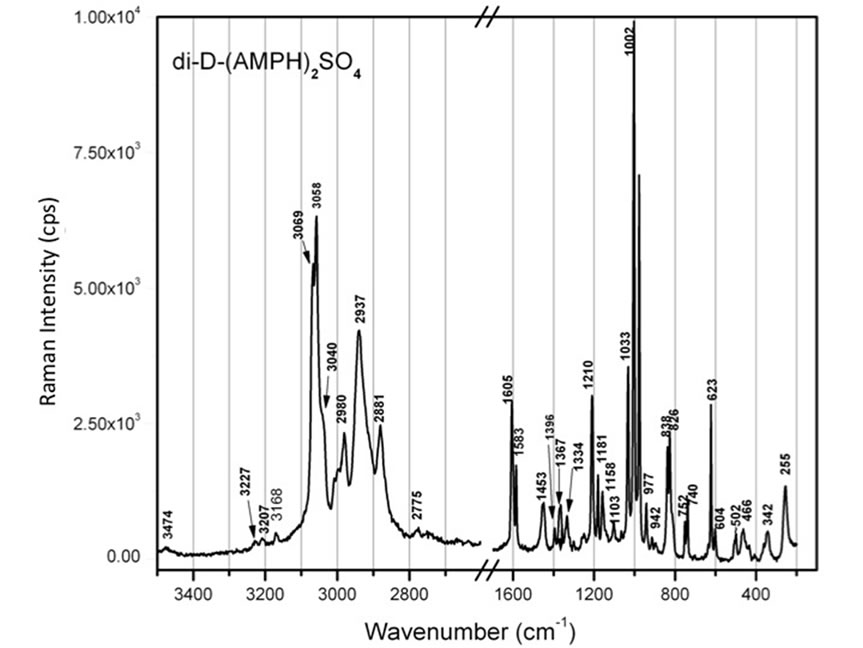
Figure 6. Raman spectrum of solid di-D-AMPH+ sulfate, obtained on a LABRAM instrument with 514.5 nm laser light excitation [9]. The region where no significant vibration is noticed has been omitted.
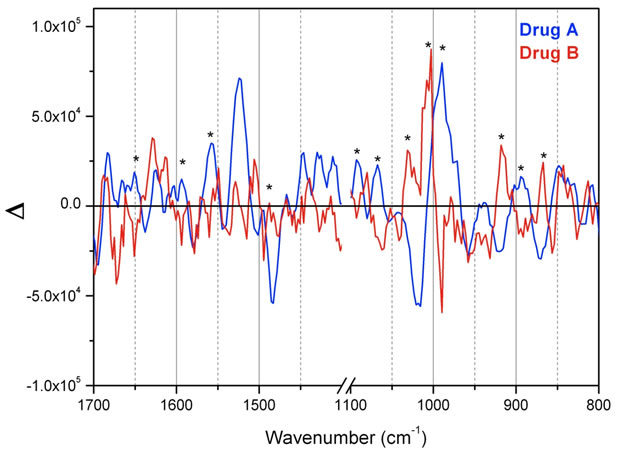
Figure 7. ROA spectra of street samples dissolved in water: Drug A (blue) and Drug B (red). It seems from these spectra, as indicated with asterisks, that many peaks occur with opposite sign, shape and intensity, signalling opposite chirality. This is obvious especially in the 1050-950 cm–1 region. Some regions have been omitted.
interionic effect. It is known that interionic interactions may introduce chirality into non-chiral molecules or ions bound to chiral species. Here, the sulfate ions must certainly be interacting with the chiral AMPH+ ions by virtue of hydrogen bonds in the solution, somewhat similar to what was seen in the solid state [37,38]. The appearance of the signal in both of the spectra of Drugs A and B indicates that it is not likely to be an artefact.
When comparing the spectra in Figure 8, strong similarities between the standard sample and one of the street
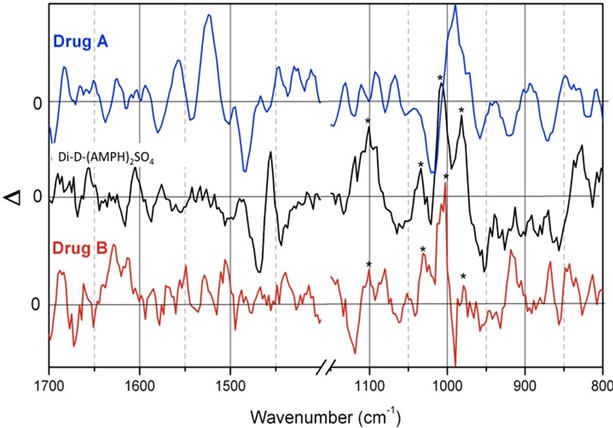
Figure 8. ROA spectra of street sample solutions (in water) of Drug A and Drug B, compared to a solution of a purchased standard di-D-AMPH+ sulfate sample. The peaks marked with asterisks show quite a resemblance between the standard sample (black) and one of the street samples, Drug B (red), especially in the 1100-800 cm–1 region. The three ordinate scale magnitudes can be judged by compareson to Figure 7. For clarity some regions have been omitted.
samples (Drug B) can be noted (peaks marked with asterisks). This feature is most apparent in the lower wavenumber region (1100 - 800 cm–1). Unfortunately the noise level was too high to give details, suggesting that more studies deserve to be carried out on stronger concentrations.
The measured ROA spectrum of the di-D-AMPH+ sulfate is compared to the calculated results in Figure 9 (see also Figure 5). It appears to be most satisfactorily
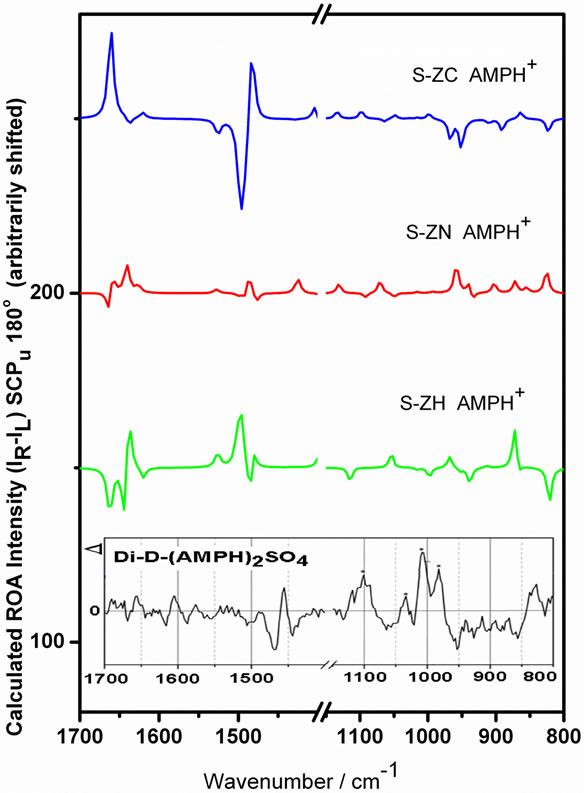
Figure 9. Calculated ROA spectra of AMPH+ ions in different conformations, compared to a solution of standard di-D-AMPH+ sulfate. The peaks marked with asterisks are the ones that resemble peaks in the street sample, Drug B.
modelled by the calculated S-ZN AMPH+ spectrum, especially when taking notice more to the shapes than to exact matching of the wavenumbers. This is not surpriseing as the S-ZN form from the crystal may still be stabilised in solution via formation of hydrogen bonds, etc. The similarity between the experimental di-D-AMPH+ sulfate results and the AMPH+ S-ZN modelling has also been found for the Raman and SERS spectra [9].
4. Conclusions
The ROA spectra of chiral molecules can provide information about the absolute configuration, when one or both enantiomers are available. In this study we have obtained Raman and ROA spectra of different species of amphetamine (amphetamine and amphetamine-H+), in which internal rotations and chirality were included. Spectra of street drug samples have been compared to standard samples, showing them to possibly be different enantiomers of the same compound even though they give almost identical Raman spectra [9]. Also the standard sample solution is likely to contain the AMPH+ ion in the S-ZN conformation, interacting with the sulfate ions.
Quantum Chemical DFT model calculations (geometry minimizations followed by calculation of Raman optical activity spectra) indicate that obtained preliminary ROA spectra can be used to assign the S(+)-amphetamine molecule and the S(+)-amphetamine-H+ ion to their different conformational states; the difference between these states being their internal rotation, i.e. the arrangements of the atoms or groups (H, CH3 or NH2/NH3+) bound to the C8 atom. This is the first time that ROA spectra of amphetamine compounds have been given. The spectra were used to characterize two street drug samples as being most likely opposite enantiomers of the same compound: Amphetamine-H+ sulfate. This compound (purchased and used as a standard solution) was found to adopt the S-ZN conformation in aqueous solution with C8 adopting the S-chirality and with the NH3+ group completing the letter Z in our notation for the different conformations.
5. Acknowledgements
Dr. Thomas Nørbygaard is thanked for help and advice during the ROA measurements. Director Ib Henriksen’s Foundation is thanked for maintenance of the Raman instrumentation. The Danish Fundamental Research Foundation as well as the Danish Agency for Science, Technology and Innovation (#09-065038/FTP) helped contribute funding for this project.
REFERENCES
- E. Meyer, J. F. Van Bocxlaer, I. M. Dirinck, W. E. Lambert, L. Thienpont and A. P. De Leenheer, “Tissue Distribution of Amphetamine Isomers in a Fatal Overdose,” Journal of Analytical Toxicology, Vol. 21, No. 3, 1997, pp. 236-239.
- I. M. Dirinck, E. Meyer, J. F. Van Bocxlaer, W. E. Lambert and A. P. De Leenheer, “Application of Gas Chromatography-Fourier Transform Infrared Spectrometry to the Analysis of Amphetamine Analogues,” Journal of Chromatography, Vol. 819, No. 1-2, 1998, pp. 155-159. doi:10.1016/S0021-9673(98)00524-X
- H. H. Maurer, T. Kraemer, D. Springer and R. F. Staack, “Chemistry, Pharmacology, Toxicology, and Hepatic Metabolism of Designer Drugs of the Amphetamine (Ecstasy), Piperazine, and Pyrrolidinophenone Types. A Synopsis,” Therapeutic Drug Monitoring, Vol. 26, No. 2, 2004, pp. 127-131. doi:10.1097/00007691-200404000-00007
- T. Kraemer and H. H. Maurer, “Determination of Amphetamine, Methamphetamine and Amphetamine-Derived Designer Drugs or Medicaments in Blood and Urine,” Journal of Chromatography B: Biomedical Sciences and Applications, Vol. 713, No. 1, 1998, pp. 163-187. doi:10.1016/S0378-4347(97)00515-X
- F. T. Peters, T. Kraemer and H. H. Maurer, “Drug Testing in Blood: Validated Negative-Ion Chemical Ionization Gas Chromatographic-Mass Spectrometric Assay for Determination of Amphetamine and Methamphetamine Enantiomers and Its Application to Toxicology Cases,” Clinical Chemistry, Vol. 48, No. 9, 2002, pp. 1472-1485.
- H. Hegedüs, A. Gergely, T. Veress and F. Zsila, “Determination of the Enantiomeric Purity of Amphetamine after Derivatization with Sanger’s Reagent (2,4-Dinitrofluorobenzene) by Simultaneous Dual Circular Dichroism and Ultraviolet Spectroscopy,” Fresenius’ Journal of Analytical Chemistry, Vol. 364, No. 8, 1999, pp. 749-752.
- N. Purdie, “Applications of Circular Dichroism,” In: N. Purdie and H. G. Brittain, Eds., Analytical, Elsevier, Amsterdam, 1994, pp. 241-278.
- C. Weyermann, Y. Mimoune, F. Anglada, G. Massonnet, P. Esseiva and P. Buzzini, “Applications of a Transportable Raman Spectrometer for the in Situ Detection of Controlled Substances at Border Controls,” Forensic Science International, Vol. 209, No. 1, 2011, pp. 21-28. doi:10.1016/j.forsciint.2010.11.027
- R. W. Berg, T. Nørbygaard, P. C. White and S. Abdali, “Ab Initio, Raman and SERS Spectral Analyses of Amphetamine Species,” Applied Spectroscopy Reviews, Vol. 46, No. 2, 2011, pp.107-131. doi:10.1080/05704928.2010.520180
- W. Hug and G. A. Hangartner, “A Novel High-throughput Raman Spectrometer for Polarization Difference Measurements,” Journal of Raman Spectroscopy, Vol. 30, No. 9, 1999, pp. 841-852. doi:10.1002/(SICI)1097-4555(199909)30:9<841::AID-JRS456>3.0.CO;2-1
- L. A. Nafie, B. E. Brinson, X. Cao, D. A. Rice, O. M. Rahim, R. K. Dukor and N. J. Halas, “Near-Infrared Excited Raman Optical Activity,” Applied Spectroscopy, Vol. 61, No. 10, 2007, pp. 1103-1106. doi:10.1366/000370207782217752
- H. Lia and L. A. Nafie, “Simultaneous Acquisition of All Four Forms of Circular Polarization Raman Optical Activity: Results for α-Pinene and Lysozyme,” Journal of Raman Spectroscopy, Vol. 43, 2012, pp. 89-94.
- S. Abdali and E. W. Blanch, “Surface Enhanced Raman Optical Activity (SEROA), TUTORIAL REVIEW,” Chemical Society Review, Vol. 37, No. 5, 2008, pp. 980- 992. doi:10.1039/b707862p
- L. D. Barron and L. Hecht, “Vibrational Raman Optical Activity: From Fundamentals to Biochemical Applications,” In: N. Berova, K. Nakanishi and R. Woody, Eds., Circular Dichroism: Principles and Applications, Chapter 23, 2nd Edition, Wiley-VCH, 2000, pp. 667-702.
- L. D. Barron, L Hecht, I. H. McColl and E. W. Blanch, “Raman Optical Activity Comes of Age,” Molecular Physics, Vol. 102, No. 8, 2004, pp. 731-744. doi:10.1080/00268970410001704399
- L. D. Barron, “Structure and Behaviour of Biomolecules from Raman Optical Activity,” Current Opinion in Structural Biology, Vol. 16, No. 6, 2006, pp. 638-643. doi:10.1016/j.sbi.2006.08.004
- L. D. Barron, F. Zhu, L. Hecht, G. E. Tranter and N. W. Isaacs, “Raman Optical Activity: An Incisive Probe of Molecular Chirality and Biomolecular Structure,” Journal of Molecular Structure, Vol. 834-836, 2007, pp. 7-16. doi:10.1016/j.molstruc.2006.10.033
- L. D. Barron and A. D. Buckingham, “Rayleigh and Raman Scattering from Optically Active Molecules,” Molecular Physics, Vol. 20, No. 6, 1971, pp. 1111-1119. doi:10.1080/00268977100101091
- P. L. Polavarapu, “Ab Initio Raman and Raman Optical Activity Spectra,” Journal of Physical Chemistry, Vol. 94, No. 12, 1990, pp. 8106-8112. doi:10.1021/j100384a024
- K. Ruud, T. Helgaker and P. Bour, “Gauge-Origin Independent Density-Functional Theory Calculations of Vibrational Raman Optical Activity,” Journal of Physical Chemistry A, Vol. 106, No. 32, 2002, pp. 7448-7455. doi:10.1021/jp026037i
- J. Costante, L. Hecht, P. L. Polavarapu, A. Collet and L. D. Barron, “Absolute-Configuration of Bromochlorofluoromethane from Experimental and Ab-Initio Theoretical Vibrational Raman Optical-Activity,” Angewandte Chemie International Edition in English, Vol. 36, No. 8, 1997, pp. 885-887. doi:10.1002/anie.199708851
- P. L. Polavarapu, “The Absolute Configuration of Bromochlorofluoromethane,” Angewandte Chemie International Edition in English, Vol. 41, No. 23, 2002, pp. 4544-4546. doi:10.1002/1521-3773(20021202)41:23<4544::AID-ANIE4544>3.0.CO;2-S
- J. Haesler, I. Schindelholz, E. Riguet, C. G. Bochet and W. Hug, “Absolute Configuration of Chirally Deuterated Neopentane,” Nature, Vol. 446, No. 7135, 2007, pp. 526- 529. doi:10.1038/nature05653
- L. D. Barron, L. Hecht, E. W. Blanch and A. F. Bell, “Solution Structure and Dynamics of Biomolecules from Raman Optical Activity,” Progress in Biophysics and Molecular Biology, Vol. 73, 2000, pp. 1-49. doi:10.1016/S0079-6107(99)00017-6
- L. D. Barron, E. W.; Blanch, I. H. McColl, C. D. Syme, L. Hecht and K. Nielsen, “Structure and Behaviour of Proteins, Nucleic Acids and Viruses from Vibrational Raman Optical Activity,” Spectroscopy, Vol. 17, 2003, pp. 101- 126. doi:10.1155/2003/787940
- L. D. Barron, “Molecular Light Scattering and Optical Activity,” 2nd Edition, Cambridge University Press, Cambridge, 2004. doi:10.1017/CBO9780511535468
- W. Hug, “Raman Optical Activity,” In: J. M. Chalmers and P. R. Griffiths, Eds., Handbook of Vibrational Spectroscopy, Vol. 1, Wiley, New York, 2002.
- S. Abdali, “Observation of SERS Effect in Raman Optical Activity, a New Tool for Chiral Vibrational Spectroscopy,” Journal of Raman Spectroscopy, Vol. 37, 2006, pp. 1341-1345. doi:10.1002/jrs.1541
- C. Johannessen, P. C. White and S. Abdali, “Resonance Raman Optical Activity and Surface Enhanced Resonance Raman Optical Activity Analysis of Cytochrome c,” Journal of Physical Chemistry A, Vol. 111, No. 32, 2007, pp. 7771-7776. doi:10.1021/jp0705267
- C. Johannessen and S. Abdali, “Surface Enhanced Raman Optical Activity as an Ultra Sensitive Tool for Ligand Binding Analysis,” Spectroscopy, Vol. 21, No. 3, 2007, pp. 143-149. doi:10.1155/2007/454102
- N. A., Brazhe, A. R. Brazhe, O. V. Sosnovtseva and S. Abdali, “Novel Chiroptical Analysis of Hemoglobin by Surface Enhanced Resonance Raman Optical Activity Spectroscopy,” Chirality, Vol. 21, No. 1E, 2009, pp. 307- 312. doi:10.1002/chir.20820
- B. G. Janesko and G. E. Scuseria, “Surface Enhanced Raman Optical Activity of Molecules on Orientationally Averaged Substrates: Theory of Electromagnetic Effects,” Journal of Chemical Physics, Vol. 125, No. 12, 2006, pp. 124704-124716. doi:10.1063/1.2345368
- L. Jensen, “Surface-Enhanced Vibrational Raman Optical Activity: A Time-Dependent Density Functional Theory Approach” Journal of Physical Chemistry A, Vol. 113, 2009, pp. 4437-4444. doi:10.1021/jp811084x
- R. Acevedo, R. Lombardini, N. J. Halas and B. R. Johnson, “Plasmonic Enhancement of Raman Optical Activity in Molecules near Metal Nanoshells,” Journal of Physical Chemistry A, Vol. 113, No. 16, 2009, pp. 13173-13183. doi:10.1021/jp9037232
- P. D. Godfrey, S. J. McGlone and R. D. Brown, “The Shapes of Neurotransmitters by Millimetrewave Spectroscopy: Amphetamine,” Journal of Molecular Structure, Vol. 599, No. 1-3, 2001, pp. 139-152. doi:10.1016/S0022-2860(01)00842-0
- R. Bergin and D. Carlström, “Crystal and Molecular Structure of Amphetamine Sulfate,” Acta Crystallographica, Vol. B27, 1971, pp. 2146-2152.
- K. Pogorzelec-Glaser, J. Kaszynska, A. Rachocki, J. Tritt-Goc, N. Pislewski and A. Pietraszko, “The Crystal Structure and Evidence of the Phase Transition in d-Amphetamine Sulfate, as Studied by X-Ray Crystallography, DSC and NMR Spectroscopy,” New Journal of Chemistry, Vol. 33, No. 9, 2009, pp. 1894-1900. doi:10.1039/b815325f
- H. Herbert, “X-Ray Structure of (+)-AmpH+ H2PO4−,” Acta Crystallographica, Vol. B34, 1978, pp. 611-615.
- M. J. Frisch, G. W. Trucks, H. B. Schlegel, G. E. Scuseria, M. A. Robb, J. R. Cheeseman, J. A. Montgomery Jr., T. Vreven, K. N. Kudin, J. C. Burant, J. M. Millam, S. S. Iyengar, J. Tomasi, V. Barone, B. Mennucci, M. Cossi, G. Scalmani, N. Rega, G. A. Petersson, H. Nakatsuji, M. Hada, M. Ehara, K. Toyota, R. Fukuda, J. Hasegawa, M. Ishida, T. Nakajima, Y. Honda, O. Kitao, H. Nakai, M. Klene, X. Li, J. E. Knox, H. P. Hratchian, J. B. Cross, V. Bakken, C. Adamo, J. Jaramillo, R. Gomperts, R. E. Stratmann, O. Yazyev, A. J. Austin, R. Cammi, C. Pomelli, J. W. Ochterski, P. Y. Ayala, K. Morokuma, G. A. Voth, P. Salvador, J. J. Dannenberg, V. G. Zakrzewski, S. Dapprich, A. D. Daniels, M. C. Strain, O. Farkas, D. K. Malick, A. D. Rabuck, K. Raghavachari, J. B. Foresman, J. V. Ortiz, Q. Cui, A. G. Baboul, S. Clifford, J. Cioslowski, B. B. Stefanov, G. Liu, A. Liashenko, P. Piskorz, I. Komaromi, R. L. Martin, D. J. Fox, T. Keith, M. A. Al-Laham, C. Y. Peng, A. Nanayakkara, M. Challacombe, P. M. W. Gill, B. Johnson, W. Chen, M. W. Wong, C. Gonzalez, and J. A. Pople, “Gaussian 03,” Revision E.01, Gaussian, Inc., Wallingford CT, 2004.
- Spartan’10, version 1.1.0. Wavefunction, Inc. Irvine, CA. 2010.
- Y. Shao, L. F. Molnar, Y. Jung, J. Kussmann, C. Ochsenfeld, S. T. Brown, A. T. B. Gilbert, L. V. Slipchenko, S. V. Levchenko, D. P. O’Neill, R. A. DiStasio Jr, R. C. Lochan, T. Wang, G. J. O. Beran, N. A. Besley, J. M. Herbert, C. Y. Lin, T. Van Voorhis, S. H. Chien, A. Sodt, R. P. Steele, V. A. Rassolov, P. E. Maslen, P. P. Korambath, R. D. Adamson, B. Austin, J. Baker, E. F. C. Byrd, H. Dachsel, R J. Doerksen, A. Dreuw, B. D. Dunietz, A. D. Dutoi, T. R. Furlani, S. R. Gwaltney, A. Heyden, S. Hirata, C.-P. Hsu, G. Kedziora, R. Z. Khalliulin, P. Klunzinger, A. M. Lee, M. S. Lee, W. Z. Liang, I. Lotan, N. Nair, B. Peters, E. I. Proynov, P. A. Pieniazek, Y. M. Rhee, J. Ritchie, E. Rosta, C. D. Sherrill, A. C. Simmonett, J. E. Subotnik, H. L. Woodcock III, W. Zhang, A. T. Bell, A. K. Chakraborty, D. M. Chipman, F. J. Keil, A. Warshel, W. J. Hehre, H. F. Schaefer III, Jing Kong, A. I. Krylov, P. M. W. Gill and M. Head-Gordon, “Advances in Methods and Algorithms in a Modern Quantum Chemistry,” Physical Chemistry Chemical Physics, Vol. 8, No. 27, 2006, 3172-3191. doi:10.1039/b517914a
- P. L. Polavarapu, “Why IS IT IMPORtant to Simultaneously Use More Than One Chiroptical Spectroscopic Method for Determining the Structures of Chiral Molecules?” Chirality, Vol. 20, No. 5, 2008, pp. 664-672. doi:10.1002/chir.20475
- R. W. Berg, M. Deetlefs, K. R. Seddon, I. Shim, and J. Thompson, “Raman and Ab Initio Studies of Simple and Binary 1-Alkyl-3-methylimidazolium Ionic Liquids,” Journal of Physical Chemistry B, Vol. 109, No. 40, 2005, pp. 19018-19025. doi:10.1021/jp050691r
NOTES
*Corresponding author.