American Journal of Analytical Chemistry
Vol. 3 No. 3 (2012) , Article ID: 18256 , 7 pages DOI:10.4236/ajac.2012.33027
Donnan Electric Potential Dependence of Intraparticle Diffusion of Malachite Green in Single Cation Exchange Resin Particles: A Laser Trapping-Microspectroscopy Study
1Department of Chemistry, Graduate School of Science, Hokkaido University, Sapporo, Japan
2Institute of Marine Environment and Resources, Haiphong City, Vietnam
3Department of Chemistry, Graduate School of Science, Hiroshima University, Higashihiroshima-City, Japan
4Department of Chemical Sciences and Engineering, Graduate School of Chemical Sciences and Engineering, Hokkaido University, Sapporo, Japan
Email: *kitamura@sci.hokudai.ac.jp
Received December 28, 2011; revised February 3, 2012; accepted February 14, 2012
Keywords: Donnan Electric Potential; Intraparticle Diffusion; Cation-Exchange Reaction; Single Microparticle; Laser Trapping-Microspectroscopy
ABSTRACT
A laser trapping-microspectroscopy technique combined with excitation energy transfer from a fluorescent cationic dye (Rhodamine B, RB+) to a non-fluorescent cationic dye (Malachite Green, MG+) was employed to study pH effects on the diffusion coefficients of MG+ (D(MG+)) in single cation-exchange resin microparticles with the diameters of 16 mm. When RB+-pre-adsorbed resin particles were soaked in an aqueous MG+ solution, the RB+ fluorescence was quenched gradually with the soaking time. The time course of the quenching efficiency of RB+ by MG+ was then used to evaluate the D(MG+) value in the particle. The D(MG+) value increased from 1.1 × 10⁻¹¹ to 4.3 × 10⁻¹¹ cm2∙s–1 on going the solution pH value from 9 to 4. The results were explained reasonably by a Donnan electric potential model.
1. Introduction
Ion-exchange processes are known to undergo via three steps: 1) mass transfer of ions in the external solution phase to the resin surface (film diffusion); 2) diffusion of ions inside the resin phase (particle diffusion); and 3) exchange of ions in the vicinity of the exchange groups [1-3]. Since the ion-exchange reactions at the exchange groups in the resin phase are in general very fast, the rate determining step is predicted to be either film diffusion or particle diffusion, depending on various experimental conditions: solution pH, temperature, the molecular size of an ion, the pore-size of the three-dimensional network of a resin, and so forth. Besides these factors governing the ion-exchange processes, the role of the Donnan electric potential in the ion-exchange processes has been sometimes discussed [4-9]. In practice, since the Donnan electric potential generated at the resin/solution boundary influences the particle diffusion processes of ions, its effects on ion-exchange reactions have been hitherto studied theoretically and experimentally for both film membrane [4,7] and bead systems [8,9]. In micrometer-sized spherical ion-exchange resin particles, particular, the electric potential effects on the particle diffusion processes are expected to play a more decisive role compared with those in film membrane systems, since the electric potential is generated three-dimensionally at the spherical particle/solution boundary. To obtain an inside look at the electric potential effects on the diffusion processes of ions, in situ and single microparticle measurements on the diffusion coefficients of ions are of primary importance. However, a study on the ion-exchange processes of ions in single resin particles has been rarely conducted owing to limitation of an experimental technique. In 1998, we reported the direct observation method of particle diffusion of an organic cation dye in single ion-exchange resin microparticles on the basis of an excitation energy transfer method combined with a laser trappingmicrospectroscopy technique [10]. In our previous report, we employed divinylbenzene-styrene polymeric resin particles (diameter (d) ~ 20 μm) having  as an ion-exchange group and Malachite Green (MG+) as an organic cation dye, and reported that the diffusion coefficient (D) of MG+ in the resin particle was as slow as 8 × 10–11 cm2∙s–1 in an aqueous pH = 4 solution. The experimental system studied is very unique since one can evaluate directly the D values of MG+ in single resin microparticles, although MG+ is a model ion and not necessarily important as an actual ion-exchange reaction. Nevertheless, the methodology determining the diffusion coefficients of ions in single resin particles is very important for elucidating the factors governing the ion-exchange processes. The D(MG+) value in a single
  resin particle in an aqueous pH = 4 solution has been determined successfully as mentioned above [10], while pH effects on D(MG+) have not been studied yet, which would provide information on Donnan electric potential effects on D(MG+) in single ion-exchange microparticles. In the present paper, we report pH effects on the diffusion coefficient of MG+ in single
  type cation-exchange microparticles in the solution pH range of 4 - 9 in special reference to the Donnan electric potential effects on D(MG+).
2. Experimental
2.1. Chemicals and Sample Preparation
Malachite Green (MG+, Kanto Chemicals, G grade) and Rhodamine B (RB+, Tokyo Kasei, GR grade) were used as supplied. Pure water (conductivity > 17 MW∙cm) was obtained from a GSR-200 system (Advantec Toyo) or Elix Advantage Water Purification System (M Millipore). A cation-exchange resin, made of a divinylbenzene-styrene copolymer (cross-linking density = 8%) having  groups (CK08H), was used as an ion-exchange material and prepared by repeated soaking of the corresponding
  resin (1 g, MCI-GEL, CK08S, Mitsubishi Chemicals Co. Ltd.) in 100 mL of 2 mol/dm3 (= M) HCl solution for 1 h. The resin was washed thoroughly by deionized water and dried in air at room temperature. The pH of an aqueous MG+ solution was adjusted by adding a 0.1 M NaOH or HCl solution and was measured by using a Horiba pH meter D-51.
2.2. Experimental Procedures
A RB+ pre-adsorbed resin (RB+-resin) was prepared by soaking the CK08H resin (20 mg, dry weight) in an aqueous RB+ solution (100 mL, [RB+] = 1.0 × 10⁻⁷ M) in 1 week for homogeneous distribution of RB+ in the resin particles [11]. Under the present experimental conditions, since the total mole number of RB+ (~10–8 mole/100 mL) is far below the ion-exchange capacity of the resin (9 × 10⁻⁵ equiv/20 mg), all of the RB+ ions are distributed homogeneously in the resin phase. After filtration of the particles, the RB+-resin was dried in air at room temperature and, then, 1.5 mg of the RB+-resin was soaked in 50 mL of an aqueous MG+ solution ([MG+] = 1.0 × 10⁻⁷ M) for a given period. At a given soaking time (t), an aliquot of the colloidal solution was sampled onto a slide glass and covered with a cover slip, which was set on the stage of an optical microscope. A single resin particle was manipulated by a laser trapping technique [12], and the absorption spectrum of RB+/MG+ and/or the fluorescence spectrum of RB+ in the single resin particle were measured by a laser trapping-microspectroscopy system.
2.3. Optical Setup for Laser Trapping-Microspectroscopy
A laser trapping-microspectroscopy system used in the present study is shown in Figure 1 [10]. For fluorescence measurements, a 150-W Xe light beam (L2273, Hamamatsu Photonics) was introduced to an optical microscope (Optiphoto 2, Nikon) coaxially with a 1064-nm laser beam for trapping (CW Nd3+: YAG laser, SL902T, Spectron) and irradiated to a single laser-trapped particle through an oil-immersed objective lens. The excitation wavelength for RB+ was selected at 532 nm by a band-pass filter (532FS03-25, Andover) to avoid absorption of incident light by MG+ and to minimize inner filter effects by RB+ absorption. In the actual experiments, a low magnified objective lens (×40) was used for both trapping and fluorescence excitation, and the spot size of the excitation beam was adjusted to be slightly larger than the particle diameter by using an iris. This gave rise to excitation of RB+ in the whole volume of the particle. The fluorescence from the laser-trapped particle was collected by the same objective lens and led to a multichannel photodetector (PMA-11, Hamamatsu Photonics) to record the fluorescence spectrum.
For absorption microspectroscopy of individual microparticles, the Xe light beam mentioned above was used as probe light (objective lens, ×100; probe beam size, ~1 mm). The Xe light beam being passed through a laser trapped particle was collected by the condenser lens of the microscope, reflected by the half-mirror set under the microscope stage and, then, led to the detector system to record the transmitted light intensity (I) as shown in Figure 1. The incident light intensity (Io) was determined under the same optical conditions without a resin particle.
2.4. Experimental Model
For determination of the diffusion coefficient of Malachite Green (MG+, a non-fluorescent organic dye) in the CK08H resin, we employed direct excitation energy transfer from RB+ to MG+ whose model was shown schematically in Scheme 1. First, the  resin was
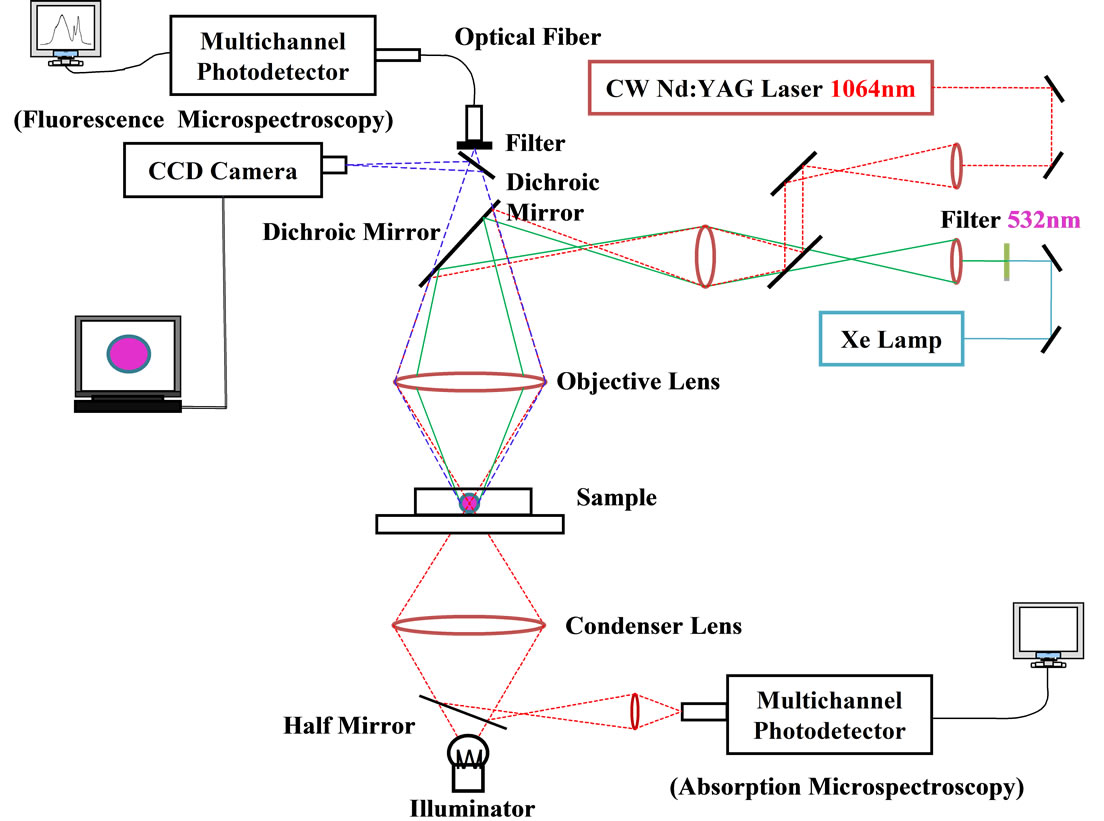
Figure 1. A block diagram of a laser trapping-absorption/fluorescence microspectroscopy system.

Scheme 1. Schematic illustration of diffusion of MG+ in a RB+-pre-adsorbed single cation-exchange microparticle.
homogeneously adsorbed by RB+. By an appropriate choice of the experimental conditions, the total amount of RB+ adsorbed on the single particle can be controlled below the ion-exchange capacity of the resin as mentioned before (Step 1).
Second, the RB+-pre-adsorbed resin particles (RB+- resin) were soaked in an aqueous MG+ solution for a given period (Step 2). It is very important to note that the total mole number of MG+ in the solution is set to adsorb all of the MG+ molecules onto the surface layers of the particles in the initial stage of soaking and, afterward, no MG+ molecule is provided from the water phase to the resin phase. Thus, the MG+ molecules adsorbed in the surface layer of the particle diffuse into the interior with time, t (Step 3). When the average distance between RB+ and MG+ in the MG+-diffused layer in the resin particle becomes shorter than the Förster energy transfer distance (discussed later again) [13], the RB+ fluorescence is quenched by MG+, while the RB+ molecules in the inner part without MG+ still show fluorescence. When MG+ is distributed to the whole volume of the particle, the RB+ fluorescence is quenched completely by excitation energy transfer from RB+ to MG+. The fluorescence intensity from the whole single RB+-resin particle should decrease in accord with the diffusion length of MG in the particle (q, see also Scheme 1). Since q is determined by the diffusion rate of MG+, the diffusion coefficient of MG+ in the particle can be determined on the basis of the time dependence of the quenching efficiency of the RB+ fluorescence by MG+.
3. Results and Discussion
3.1. Time Courses of the Absorption and Fluorescence Spectra of Single RB+-Resin Particle during Soaking in an MG+ Solution
Figure 2 shows the time course of the absorption spectrum of a single RB+-resin particle (diameter (d) ~ 16 μm) during soaking in an aqueous MG+ solution ([MG+] = 1.0 × 10⁻⁷ M, pH = 6.56). At t = 0, RB+ in the resin particle shows the absorption maximum at around 570 nm. Under present experimental conditions, since the total mole number of MG+ in the aqueous phase (5 × 10⁻⁹ mole/50 mL) is set far below the ion-exchange capacity of the resin (6.75 × 10⁻⁶ equiv/1.5 mg) as mentioned before, all of the MG+ molecules distribute completely from the water phase to the resin phase within the first 5 min as confirmed by the disappearance of the green color of the MG+ solution: Step 2 in Scheme 1. Upon diffusion of MG+ from the surface layer to the resin interior, the absorbance of MG+ at around 634 nm increased gradually with t without any appreciable changes in the spectral band shapes of both RB+ and MG+ as seen in Figure 2: Step 3 in Scheme 1. It is worth noting that the total mole number of MG+ in the particle is constant during soaking. Therefore, the increase in the absorbance of MG+ at around 634 nm with t is ascribed to that in the optical path length (l) in the single microparticle due to diffusion of MG+. Upon MG+ diffusion from the surface layer to the particle interior, the thickness of the diffusion layer of MG+ (θ in Scheme 1) increases and this gives rise to that in the optical path length for the absorption measurements: l. The increase in the MG+-diffused layer (i.e., l), however, also brings about dilution of the MG+ concentration in the MG+-diffused volume. For a spherical sample, it has been reported that the absorbance change of a solute is more sensitive to the change in l compared with that by the dilution effect [14], the absorbance increases with t as seen in Figure 2. After 150 min soaking, the absorbance of MG+ became constant, indicating homogeneous diffusion of MG+ in the RB+-resin particle.
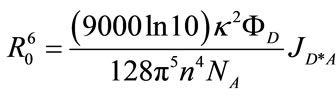
Figure 3 shows a typical example of the time course of the fluorescence spectrum of a single RB+-resin particle during soaking in an aqueous MG+ solution ([MG+] = 1.0 × 10⁻⁷ M, pH = 6.96). The results clearly demonstrate that the RB+ fluorescence is quenched with t without any change in the spectral band shape, indicating diffusion of MG+ into the RB+-resin particle interior and subsequent excitation energy transfer from RB+ to MG+ in the MG+- diffused layer in the particle. Under the present conditions, the observed absorbance of RB+ (1.1 at 565 nm, t = 0 - 150 min in Figure 2) and MG+ (~0.6 at 634 nm, t = 150 min in Figure 2) correspond to the amount of RB+ and MG+ in the resin particle to be 1.3 × 10⁻¹⁴ and 1.0 × 10⁻¹⁴ mole/particle, respectively. These values indicate that the average distance between RB+ and MG+ in the resin particle at t = 150 min is ~50 Å, which is shorter than the critical energy transfer distance (R0 ~ 60 Å [15]) in the present RB+-MG+ system. Therefore, quenching of the RB+ fluorescence in the resin during soaking in the MG+ solution is the reasonable consequence and the data in Figure 3 are worth analyzing in more detail.
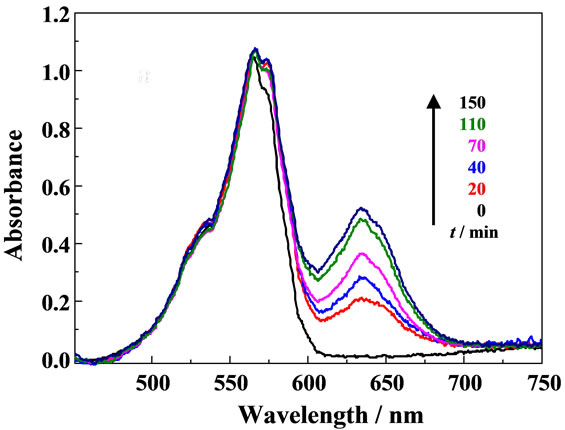
Figure 2. A time course of the absorption spectrum of a RB+-resin particle (d ~ 16 mm) in an aqueous MG+ solution ([MG+] = 10–7 M) at pH = 6.56.
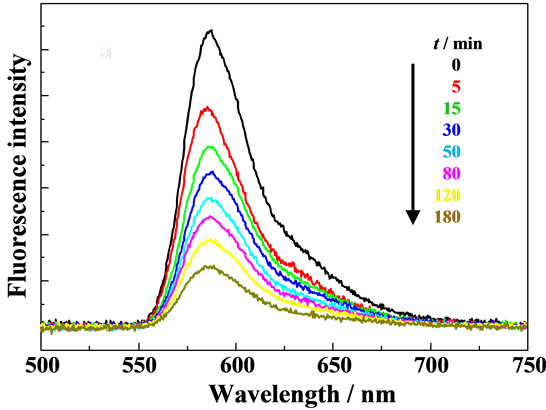
Figure 3. Fluorescence quenching of RB+ during soaking of a single RB+-resin particle in an aqueous MG+ solution ([MG+] = 10–7 M) at pH = 6.96.
3.2. Determination of the Diffusion Coefficients of MG+ in Single Resin Particles
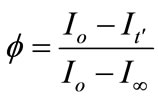
For determination of the diffusion coefficient of MG+ (D(MG+)) in the resin phase by the present excitation energy transfer technique, we define the fluorescence quenching efficiency (f) as given in Equation (1),
 (1)
(1)
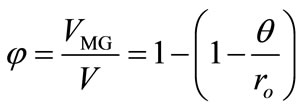
where Io, It', and I¥ are the RB+ fluorescence intensities before soaking the particle in the MG+ solution (t = 0), at a given soaking time (t = t'), and at t = t¥, respectively. On the other hand, the f value is also given by the volume ratio of the MG+-diffused layer ( ) to the whole particle (V) and, thus, Equation (1) can be rewritten by Equation (2),
 (2)
(2)
where ro is the radius of a particle and q is the thickness of the MG+-diffused layer in the particle (see also Scheme 1). Since we observe the quenching efficiency and f is governed by the diffusion length of MG+ from the surface layer to the particle interior, one can assume the one-dimensional diffusion equation: θ = [2D(MG+)t]1/2. On the basis of the data in Figure 3, we determined the time course of f during soaking the RB+-resin particle in the aqueous MG+ solution as shown in Figure 4. The quenching efficiency increased with t and reached ~100% at t ~ 180 min. As shown in Figure 5, furthermore, we obtained a good linear relationship between q and t1/2 relevant to the data in Figure 4 and evaluated the D(MG+) value to be 1.2 × 10⁻¹¹ cm2∙s–1 at pH = 6.96. Therefore, experiments and analysis similar to those in Figures 4 and 5 can provide D(MG+) under given conditions.
3.3. pH Effects on D(MG+) in Single Resin Microparticles
It has been reported that the pKa value of MG+ is 6.9 [16] and the dimethylamino group in MG+ is protonated at pH < 2 forming MG2+, while MG+ is likely to be hydrolyzed to produce carbinol (MG-OH) at a high pH solution as shown in Scheme 2 [17,18]. In the present experiments, therefore, we studied pH effects on D(MG+) in the pH range of 4 < pH < 9.
It is worth emphasizing that, in the actual experiments, the solution pH value varies upon soaking the RB+-resin
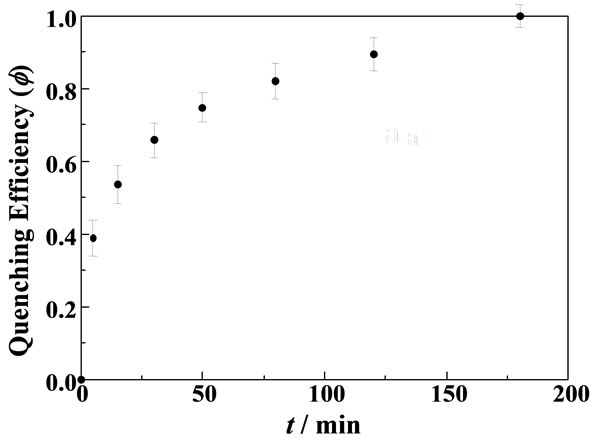
Figure 4. A time course of the fluorescence quenching efficiency of the RB+ fluorescence relevant to the data in Figure 3.
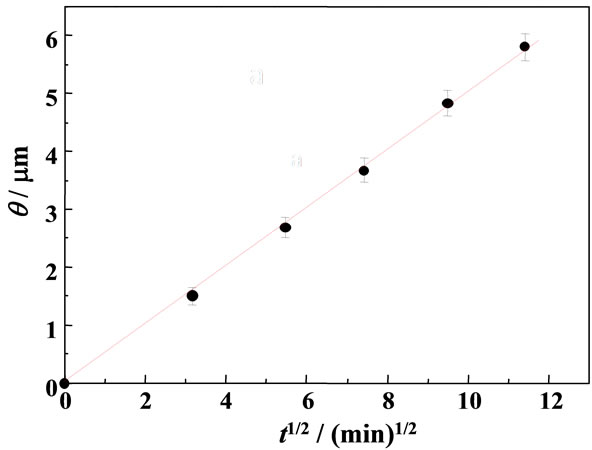
Figure 5. A relationship between q and t1/2 determined for the data shown in Figures 3 and 4.
in an aqueous MG+ solution during the first 5 min. As an example, when RB+-resin particles were soaked in an MG+ solution, the pH value became lowered from 6.94 (pHt=0, solution pH before soaking in an MG+ solution) to 4.82 in the first 5 min of soaking (pHt=¥) as summarized in Table 1: DpH = pHt=0 – pHt=¥ = 2.12. This indicates that soaking of RB+-resin particles in the MG+ solution releases H+ from the resin phase to the water phase. In the following, therefore, we discuss the pH effects on both acid-base equilibria of MG+ and D(MG+) on the basis of the pHt=¥ values as listed in Table 1.
Figure 6 shows the pH effects on D(MG+) in the pHt=¥ range of 4 - 9. As seen in the figure, the D(MG+) value was dependent strongly on pHt=¥ and increased from 1.2 × 10⁻¹¹ at pHt=¥ = 7.18 to 4.3 × 10⁻¹¹ cm2∙s–1 at pHt=¥ = 3.92. Knowing the pKa value of MG+ to be 6.9, the large increase in the D(MG+) in the acidic side, in particular, in the pHt=¥ range of 4 - 5, is due essentially to the pH effects on the D value of MG+ itself and not to the contribution of acid-base equilibria of MG+ in Scheme 2: MG-OH. At pHt=¥ > ~7, on the other hand, the main contribution of the chemical species to the observed
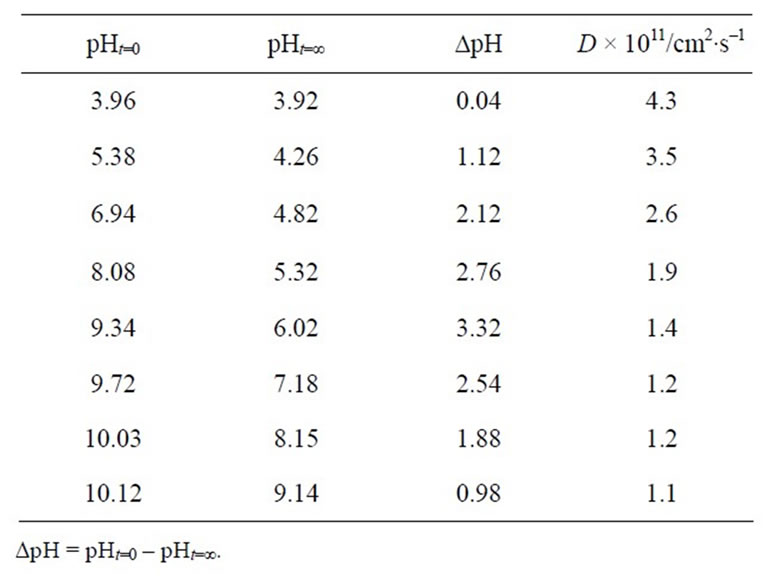
Table 1. pH dependence of the diffusion coefficient of MG+ (D(MG+)/cm2∙s–1) in single RB+-resin particles (d ~ 16 mm).
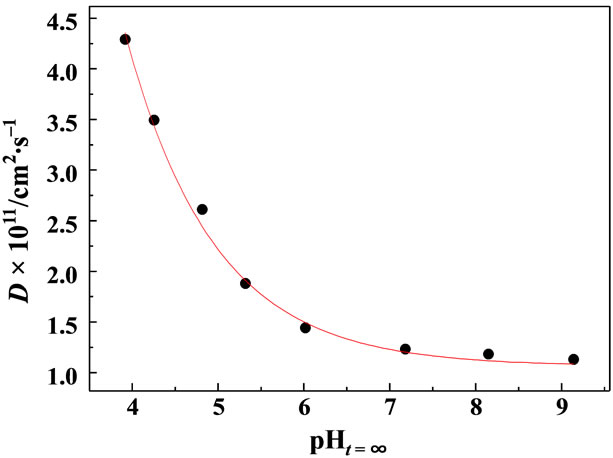
Figure 6. Effects of pH on the diffusion coefficient of MG+ in single RB+-resin particles (d ~ 16 mm).
phenomena should be MG-OH, and MG-OH will be adsorbed on the resin surface probably due to the hydrophobic interactions with the polymer resin backbone. Therefore, we suppose that the D values observed in pHt=¥ = 8 - 9 do not correspond to those of MG+.
Both adsorption of MG+ on the surface layers of the resin particles and change in the solution pH in pHt=¥ = 7.2 - 3.9 seen in Table 1 and, thus, H+ release from the resin phase to the water phase (∆pH) undergo simultaneously in the first 5 min of soaking. Since [MG+] in the water phase is set at 1.0 × 10⁻⁷ M as mentioned above, the amount of H+ released from the particles is much higher than the total amount of MG+ adsorbed on the particles, giving rise to generation of a negative electric potential across the particle/water boundary as shown schematically in Scheme 3: Donnan electric potential. By lowering the initial solution pH value (i.e., pHt = 0), the amount of H+ released from the particle phase to the water phase should decrease. In practice, the pH change of the solution was ∆pH = 0.04 when the resin particles were soaked in a pHt=0 ~ 4 solution. This indicates that the surface negative Donnan electric potential difference between the particle and water phases decreases by lowering the solution pH and, thus, the D(MG+) value increases on going the solution pHt=¥ from 7 to 4. The Donnan electric potential difference (DE) is given as in Equation (3) [7,9],
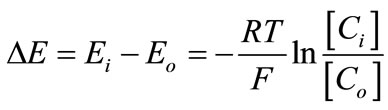 (3)
(3)
where the subscripts of i and o represent the resin and water phases, respectively, and [C] is the mobile ion (i.e., H+) concentration. Equation (3) indicates that the DE value is an exponential function of pH. In practice, the data in Figure 6 can be fitted almost satisfactorily by a single exponential function as shown by the red curve in the figure. Therefore, it is concluded that the solution pH dependence of D(MG+) is explained reasonably by the Donnan electric potential generated across the particle/ water interface. The present method for individual ionexchange particles is certainly powerful enough to discuss the factor determining the ion-exchange processes in resin particles.
4. Conclusions
In situ measurements of the intraparticle diffusion coefficients of MG+ in single cation exchange resin particles were demonstrated successfully on the basis of a direct excitation energy transfer method combined with a laser trapping-microspectroscopy technique. It was shown that the solution pH affected strongly on the D(MG+) value. In practice, the D(MG+) value increased from 1.2 × 10⁻¹¹ to 4.3 × 10⁻¹¹ cm2∙s–1 on going the solution pHt=∞ from 4 to 7 and was almost independent of pH at pHt=∞ > 7. Although the solution pH governs the acid-base equilibria of MG+, the main contribution to the ion-exchange reaction is MG+ at 4 < pHt=∞ < 7. Therefore, the results on D(MG+) in pHt=∞ = 4 - 5 provide the pH/Donnan electric potential effects on D(MG+) at a single resin particle level. The solution pH at pHt=¥ < 7 played important role in determining D(MG+) through a variation of the Donnan electric potential across the resin/water boundary. By lowering the solution pHt=¥, the effects of the Donnan electric potential on the diffusion processes of MG+ become lower and this brings about an increase in the diffusion coefficient of MG+ in pHt=¥ < 7. It is worth emphasizing that Donnan electric potential effects on the
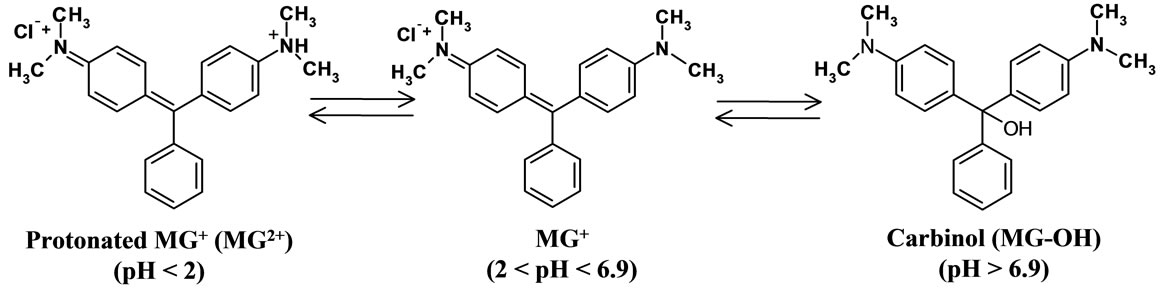
Scheme 2. Acid-base equilibria of MG+ in water.
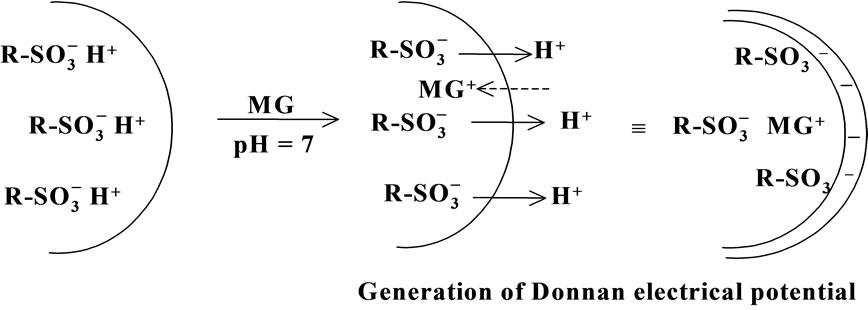
Scheme 3. Schematic illustration of a Donnan electric potential model.
ion-exchange processes will be more important with a decrease in a resin particle size, since it influences three-dimensionally in the spherical resin particle. We convince that the present particle-resolved technique will play important roles in such studies.
5. Acknowledgements
N. K. is grateful for a Grant-in-Aid from the Ministry of Education, Culture, Sports, Science and Technology, Japan (No. 23245015) for partial support of the research.
REFERENCES
- O. Samuelson, “Ion Exchange Separations in Analytical Chemistry,” John-Wiley, New York, 1963.
- F. Helfferich, “Ion Exchange,” McGraw-Hill, New York, 1962.
- C. E. Harland, “Ion Exchange: Theory and Practice,” The Royal Society of Chemistry, Cambridge, 1994.
- O. V. Bobreshova, A. V. Parshina, K. A. Polumestnaya, N. G. D’yachkova and L. A. Zagorodnykh, “Interfacial Potential Difference in Electromembrane Systems with MA-41 Anion-Exchange Membranes and Alkaline Solutions of Glycine,” Russian Journal of Electrochemistry, Vol. 43, No. 11, 2007, pp. 1321-1325. doi:10.1134/S1023193507110171
- V. M. Bhandari, “Implications of Weak Donnan Potential in Ion-Exchange Reactions. An Alterante Strategy for Modeling Sorption Processes,” Separation Sciences and Technology, Vol. 33, No. 13, 1998, pp. 2009-2024. doi:10.1080/01496399808545043
- P. Ramírez, A. Alcaraz, S. Mafé and J. Pellicer, “Donnan Equilibrium of Ionic Drugs in pH-Dependent Fixed Charge Membranes: Theoretical Modeling,” Journal of Colloid and Interface Science, Vol. 253, No. 1, 2002, pp. 171- 179. doi:10.1006/jcis.2002.8508
- K. Nomura, “Separation of the Diffusion Potential within a Membrane and the Donnan Potential on the Basis of a Measurement of Transient Membrane Potentials,” Bulletin of Chemical Society Japan, Vol. 69, No. 9, 1996, pp. 2533-2537. doi:10.1246/bcsj.69.2533
- C. A. Burns, J.-F. Boily, R. J. Crawford and I. H. Harding, “Cd(II) Binding by Particulate Low-Rank Coals in Aqueous Media: Sorption Characteristics and NICA-Donnan Models,” Journal of Colloid and Interface Science, Vol. 278, No. 2, 2004, pp. 291-298. doi:10.1016/j.jcis.2004.06.001
- H. Yao, Y. Takada and N. Kitamura, “Electrolyte Effects on CdS Nanocrystal Formation in Chelate Polymer Particles: Optical and Distribution Properties,” Langmuir, Vol. 14, No. 3, 1998, 595-601. doi:10.1021/la970480g
- H.-B. Kim, S. Habuchi, M. Hayashi and N. Kitamura, “Direct Excitation Energy Transfer as a Technique for in Situ Measurements of Ion-Exchange Processes in Single Polymer Particles,” Analytical Chemistry, Vol. 70, No. 1, 1998, pp. 105-110. doi:10.1021/ac970808a
- H.-B. Kim, M. Hayashi, K. Nakatani, N. Kitamura, K. Sasaki, J. Hotta and H. Masuhara, “In Situ Measurements of Ion-Exchange Processes in Single Polymer Particles: Laser Trapping Microspectroscopy and Confocal Fluorescence Microspectroscopy,” Analytical Chemistry, Vol. 68, No. 3, 1996, pp. 409-414. doi:10.1021/ac951058c
- N. Kitamura and F. Kitagawa, “Optical Trapping-Chemical Analysis of Single Microparticles in Solution,” Journal of Photochemistry and Photobiology C: Photochemistry Reviews, Vol. 4, No. 3, 2003, pp. 227-247. doi:10.1016/j.jphotochemrev.2003.09.004
- J. R. Lakowicz, “Principles of Fluorescence Spectroscopy,” Plenum Press, New York, 1983.
- H.-B. Kim, S. Yoshida and N. Kitamura, “Effects of Sample Dimension and Dye Distribution Characteristics in Absorption Microspectroscopy,” Analytical Chemistry, Vol. 70, No. 1, 1998, pp. 51-57. doi:10.1021/ac970572a
- The critical energy transfer distance (R0) is calculated by the following equation,
 where k, n, and NA are the dipole orientation factor (assumed to be κ2 = 2/3), the refractive index of a medium, and the Avogadro number, respectively.
  is the fluorescence quantum yield of an energy transfer donor (i.e., RB+) and JD*A represents the spectral overlap between the fluorescence spectrum of RB+ and the absorption spectrum of MG+. See also ref. .
 - S. J. Culp and F. A. Beland, “Malachite Green: A Toxicological Review,” International Journal of Toxicology, Vol. 15, No. 3, 1996, pp. 219-238. doi:10.3109/10915819609008715
- N. Nakashima, K. Yoshihara and F. Willig, “Time-Resolved Measurements of Electron and Energy Transfer of Rhodamine B Monolayer on the Surface of Organic Crystals,” Journal of Chemical Physics, Vol. 73, No. 8, 1980, pp. 3553-3559. doi:10.1063/1.440738
- M. Van der Auweraer, B. Verschuere and F. C. DeSchryver, “Absorption and Fluorescence Properties of Rhodamine B Derivatives Forming Langmuir-Blodgett Films,” Langmuir, Vol. 4, No. 3, 1988, pp. 583-588. doi:10.1021/la00081a016
NOTES
*Corresponding author.