Open Journal of Modern Neurosurgery
Vol.2 No.3(2012), Article ID:21173,9 pages DOI:10.4236/ojmn.2012.23008
The Haematological Profile of Patients with Multiple Sclerosis
1Department of Bio-Medical Sciences, Faculty of Health and Wellness Science, Cape Peninsula University of Technology, Cape Town, South Africa
2National Health Laboratory Services and University of Stellenbosch, Tygerberg Hospital, Tygerberg, South Africa
3Division of Chemical Pathology, University of Stellenbosch, Tygerberg Campus, Tygerberg, South Africa
Email: *matshat@cput.ac.za
Received March 9, 2012; revised April 18, 2012; accepted May 15, 2012
Keywords: Multiple Sclerosis; Haematological Profile; Expanded Disability Status Scale; C-Reactive Protein
ABSTRACT
Background: Patients with multiple sclerosis experience various disabilities, depending on the number and placement of lesions in the brain. Red blood cells with impaired membrane fluidity, as has been reported in patients with multiple sclerosis are known to be further targeted by phospholipase A2 during inflammatory activation. Objectives: The objective of the present study was therefore to investigate the haematological profile of patients with multiple sclerosis and to correlate this with their functional disability and inflammatory status. Methods: Differential full blood counts of 31 patients with multiple sclerosis and 30 ageand gender-matched control subjects were determined on a Beckman Coulter. The functional disability status of each patient was measured using the Kurtzke Expanded Disability Status Scale. C-reactive protein was determined on a Beckman auto-analyser. Results: The haemoglobin was significantly decreased in patients: 13.9 ± 1.40 g/dl, controls: 14.7 ± 1.60 g/dl, P = 0.01, while platelets were increased in patients: 292 ± 133 × 109/l, controls: 258 ± 88.0 × 10⁹/l, P = 0.04. The number of red blood cells correlated inversely with the Kurtzke Expanded Disability Status Scale (R = –0.41; P = 0.02). Platelets correlated inversely with the haemoglobin (P = 0.04) and positively with Visual and Brainstem Scores (P < 0.01, P = 0.07 respectively), but inversely with the Sensory Score (P = 0.02). Conclusions: It is not clear from the results whether the compromised red blood cell profile in patients was due to unknown agents involved in the disease aetiology or from the resulting inflammatory responses, but the inverse correlation between the red blood cell count and the Kurtzke Expanded Disability Status Scale, a measure of neuronal function, suggested a relationship between red blood cell count and disease outcome. Furthermore, the inverse correlation of platelets with the haemoglobin suggested immunological involvement. Platelets, similar to white blood cells, supply fatty acids for pro-inflammatory eicosanoid synthesis.
1. Introduction
Lesion formation in brain tissue from patients with multiple sclerosis (MS) results in demyelination followed by impairment of nerve transmission. Although the cause of MS is unknown, an immune and/or viral component may be contributing to the inflammatory condition experienced by patients [1,2]. Most infections of the central nervous system (CNS) emanate from the circulation [1]. Leukocytes may therefore play an important role in the development and progression of inflammatory diseases such as MS [3]. These disorders are characterised by the presence of activated T-lymphocytes and cytokines at the site of tissue injury as well as in the circulation [3]. The lymphocytes bind to cerebral endothelial cells, migrate across the blood vessel walls and enter the CNS parenchyma [1,4]. The extravasation of T-lymphocytes across the blood-brain-barrier has been found to be central to the process of demyelination in patients with MS [1]. Elimination of pathogens by leucocytes is frequently accompanied by tissue damage due to the extracellular release of lytic factors such as inflammatory cytokines and antibodies [1,4]. Neurons have a low regenerative capacity [1]. The myelin yield from normal appearing white matter from patients with MS has been reported to be reduced as compared to age-matched control brains [5]. Reports have also shown metabolic abnormalities such as changes in the fatty acid composition in myelin as well as in white blood cell (WBC) and red blood cell (RBC) membranes from patients. Red blood cells with impaired membrane fluidity, as has been reported in patients with MS [6], are known to be targeted by phospholipase A2 [7,8]. Phospholipase A2 is secreted during inflammatory activation and releases arachidonic acid from membrane phospholipids for inflammatory eicosanoid production. Any changes in the RBC profile, especially in its oxygen-carrying capacity, could be expected to contribute to the disease aetiology.
Diagnostic criteria for MS (McDonald Diagnostic Criteria) include the integration of magnetic resonance image assessment (MRI) with clinical and para-clinical methods [9,10]. Thereafter, disability can be measured by a neurologist against a disability status scale, such as the Kurtzke Expanded Disability Status Scale (EDSS) [11]. Patients with MS can experience loss of any function that is controlled by the central nervous system, and the EDSS includes functional systems to measure these as well. Clinical features include loss of sensation, muscle weakness, spasticity, visual loss, in-coordination, cognitive impairment, pain, as well as bladder and bowel disturbances [9,12,13]. While the disease progre ssion can be measured against the EDSS, a different feature of MS, inflammation, may be measured by C-reactive protein (CRP). C-reactive protein is an acute phase plasma protein and it has been used as a marker for infection and inflammation in patients with MS [14,15]. Although these markers do not always correlate with short-term disease progression [14], they have been shown to correlate with infectious episodes and clinical relapses in patients with MS [16]. Therefore, the aim of the present study was to analyze the haematological profile from patients with MS and to correlate these with disease outcome as measured by the Kurtzke EDSS and inflammation as measured by the CRP.
2. Materials and Methods
Study Population
Ethics approval for the study was obtained from the Health Sciences Research Ethics Committee of the Cape Peninsula University of Technology. Patients with MS were contacted and recruited through the MS Society, Western Cape Branch, South Africa. Written informed consent was obtained from all participants. The study population consisted of 31 female patients and 30 ageand gender-matched control subjects. The median and quartile range for age of diagnosis were: 37 (20) years and time since diagnosis were 7 (11) years. Participants using fatty acid supplements, interferon or cortisone were excluded from the study. The functional disability status of each patient was measured by a neurologist or a trained clinician using the Kurtzke Expanded Disability Status Scale (EDSS) [11]. Higher values for the EDSS indicate greater disability; a 0 score indicates no disability at all and 10 indicates death due to MS.
Blood sample analysis: Venous blood from participants was collected into anti-coagulant EDTA tubes and differential full blood counts were determined on a Beckman Coulter. C-reactive protein concentrations were determined on a Beckman auto-analyser.
Statistical analysis: A statistics programme, STATISTICA 9 (StatSoft Inc.) was used to perform all statistical analyses. Descriptive data are presented as median (quartile range). For asymmetrical data Mann Whitney U was used to compare distributions between the cases and control subjects. Correlations were calculated using Spearman’s Rank correlation coefficient.
3. Results
The reference ranges for haematological tests investigated in this study are summarized in Table 1.
Differences in the haematological profile between control subjects and patients with multiple sclerosis are summarized in Table 2: The haemoglobin (HGB) was significantly decreased in patients (controls; median ± quartile range: 14.7 ± 1.60 g/dl; patients: 13.9 ± 1.40 g/dl; P = 0.01). Furthermore, both the red blood cell count (RBCs) and haematocrit (HCT) was non-significantly decreased in patients. Platelets were significantly increased in patients (controls; median ± quartile range: 258 ± 88.0 × 10⁹/l; patients: 292 ± 133 × 109/l; P = 0.04). The neutrophil percentage was non-significantly increased in patients, while the lymphocyte percentage and both the eosinophil count and percentage were non-significantly decreased in patients.
Correlations between the haematological profile and the Kurtzke Expanded Disability Status Scale in patients with multiple sclerosis are summarized in Table 3: The RBC count showed significant inverse correlations with both the EDSS and Bowel and Bladder FSS; R = –0.41; P = 0.02 and R = –0.45; P = 0.01 respectively. The HGB and HCT showed non-significant inverse correlations with the EDSS and/or Bowel and Bladder FSS. The LUC percentage showed a significant inverse correlation with the Brainstem FSS (R = –0.37; P = 0.04), while the neutrophil percentage showed a nonsignificant positive correlation with the Cerebellar FSS. The platelets showed a significant positive correlation with the Visual FSS (R = 0.54, P < 0.01) and a non-significant positive correlation with the Brainstem FSS, and a significant inverse correlation with the Sensory FSS (R = –0.42, P = 0.02)
Correlations between C-reactive protein and the haematological profile in control subjects and patients with multiple sclerosis are summarized in Table 4: The CRP showed non-significant positive correlations with the HGB and basophil count in control subjects. It showed a non-significant positive correlation with the RDW and an inverse correlation with the monocyte count and percentage in patients with MS.
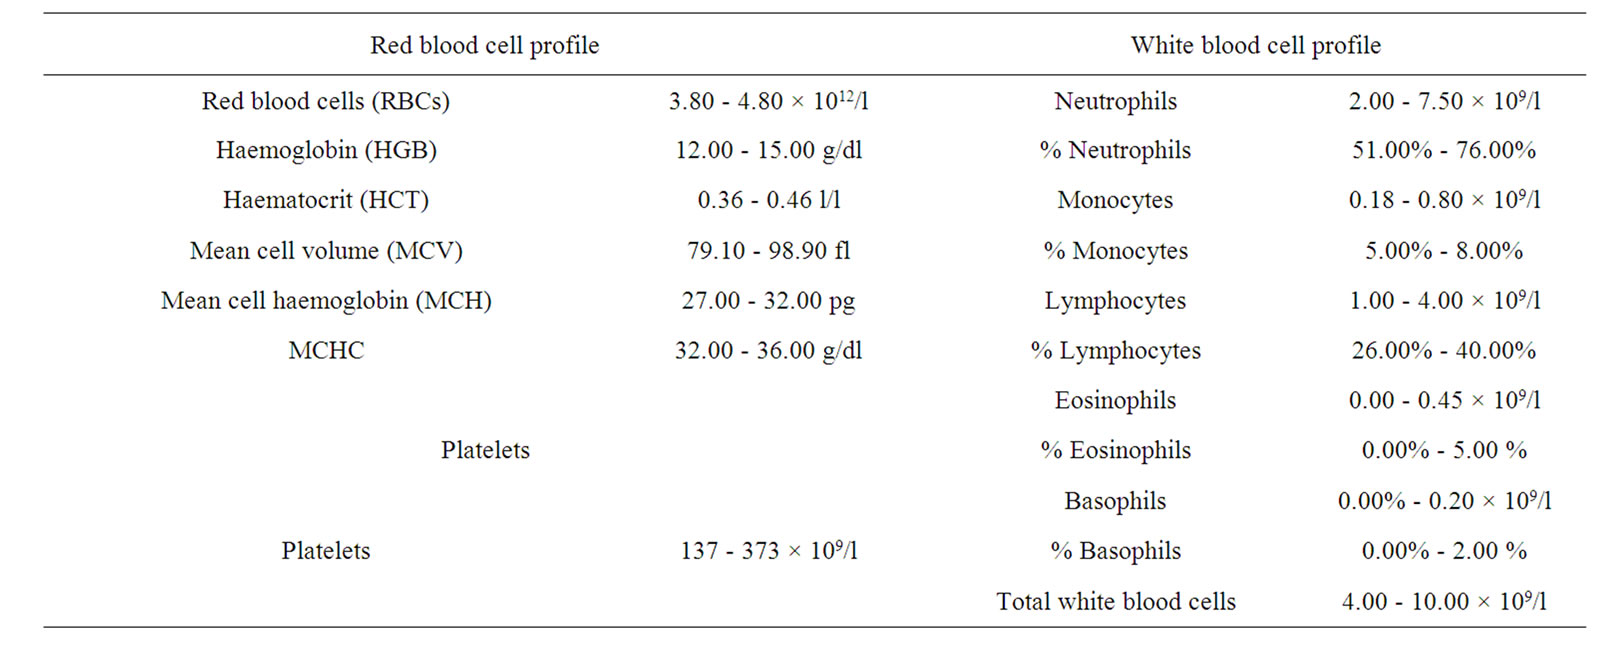
Table 1. The reference ranges for haematological tests.
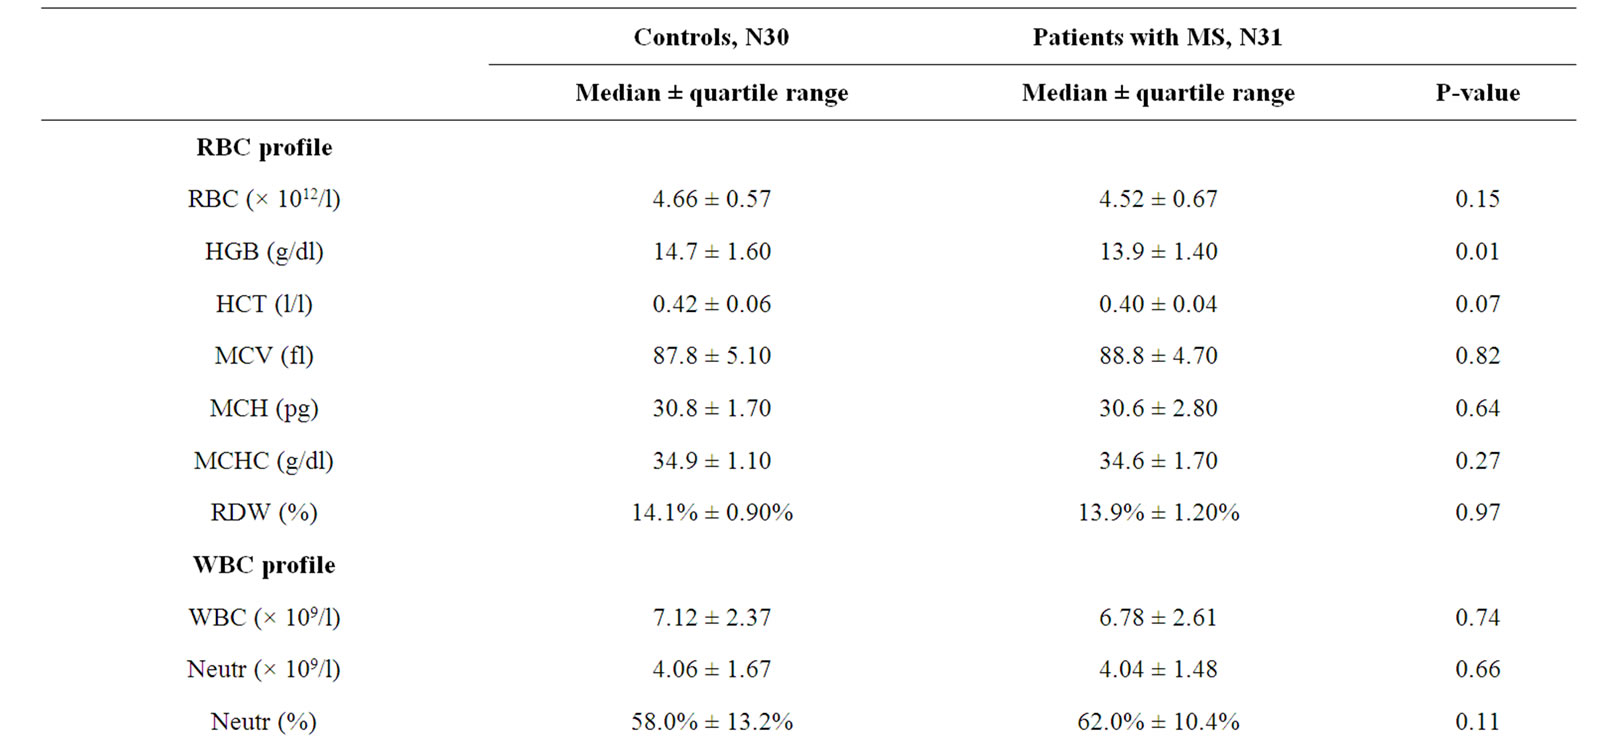
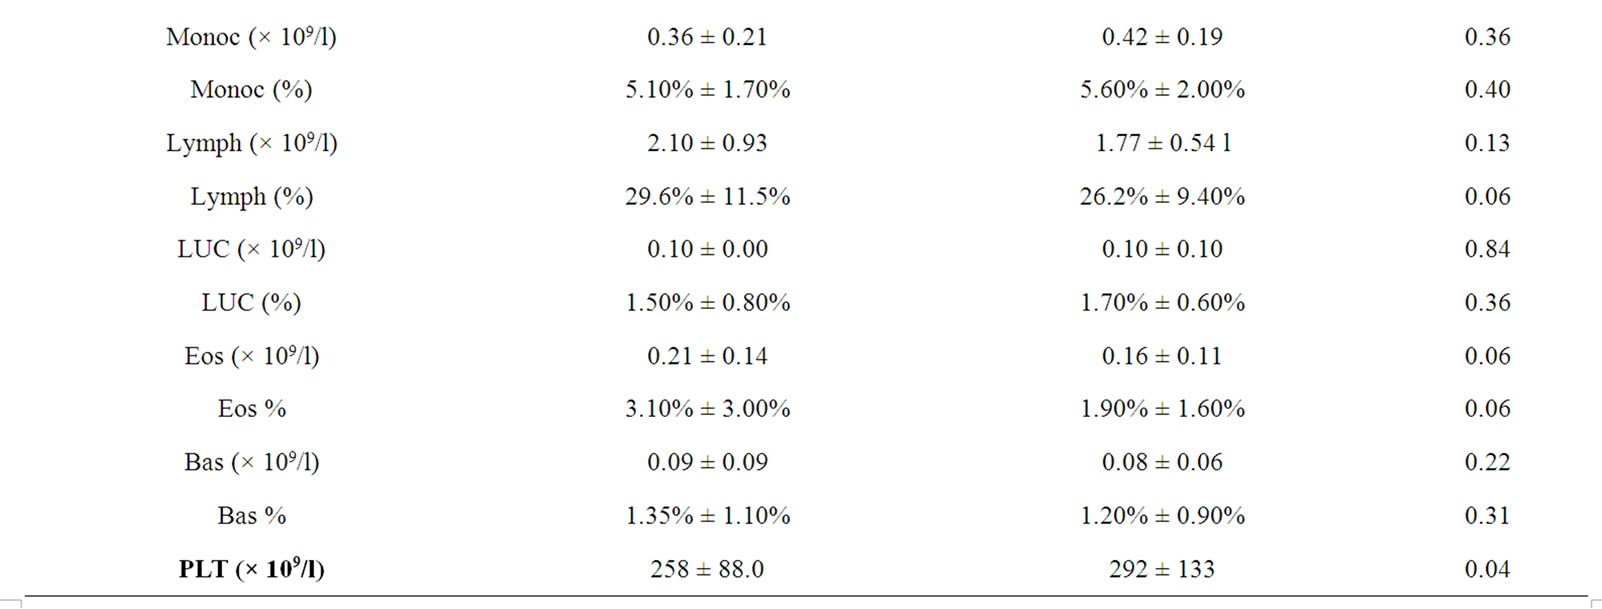
Table 2. Differences in the haematological profile between control subjects and patients with multiple sclerosis.
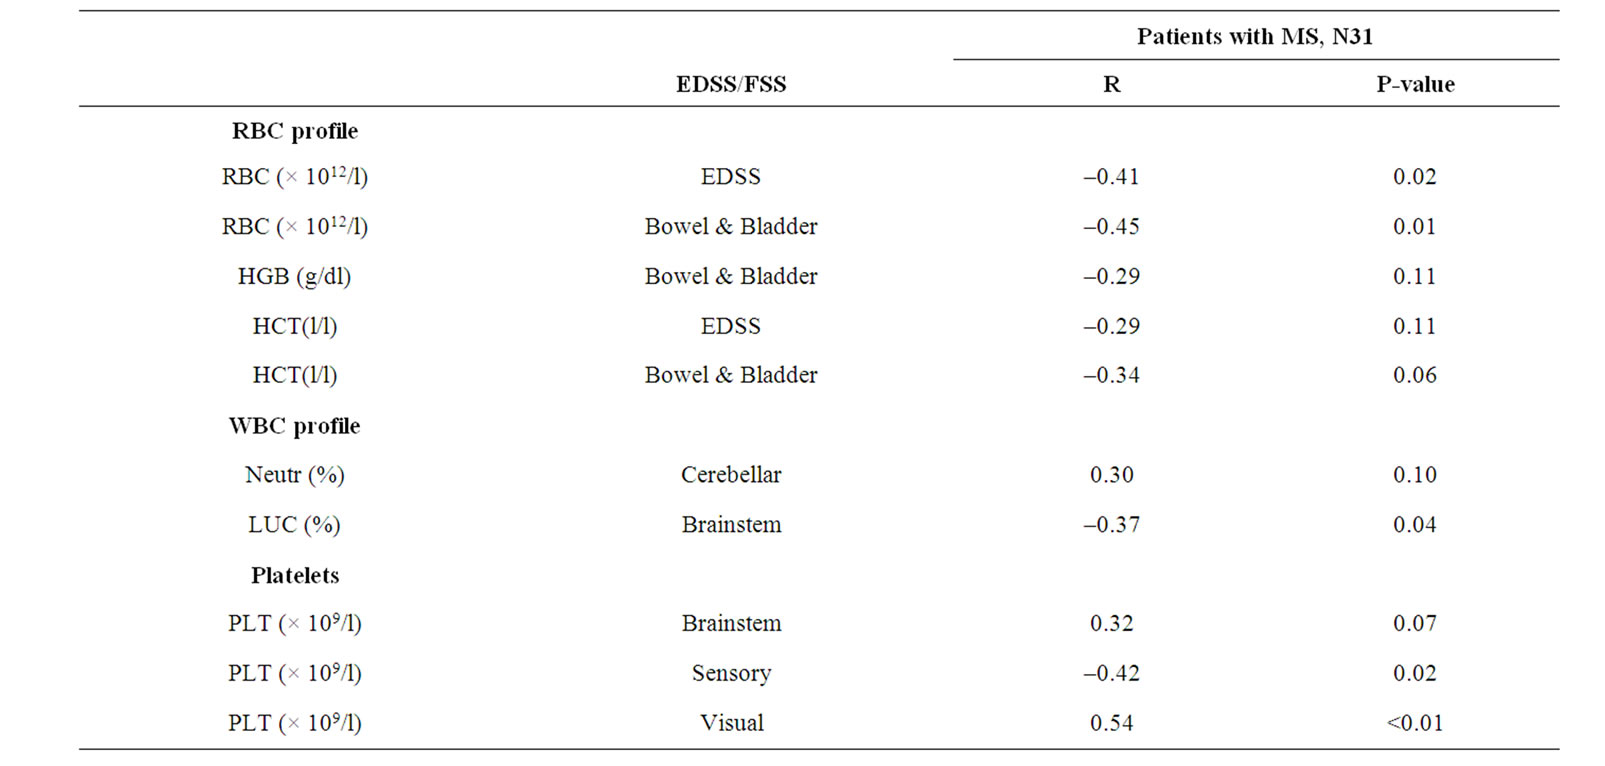
Table 3. Correlations between the haematological profile and the Kurtzke Expanded Disability Status Scale in patients with multiple sclerosis.
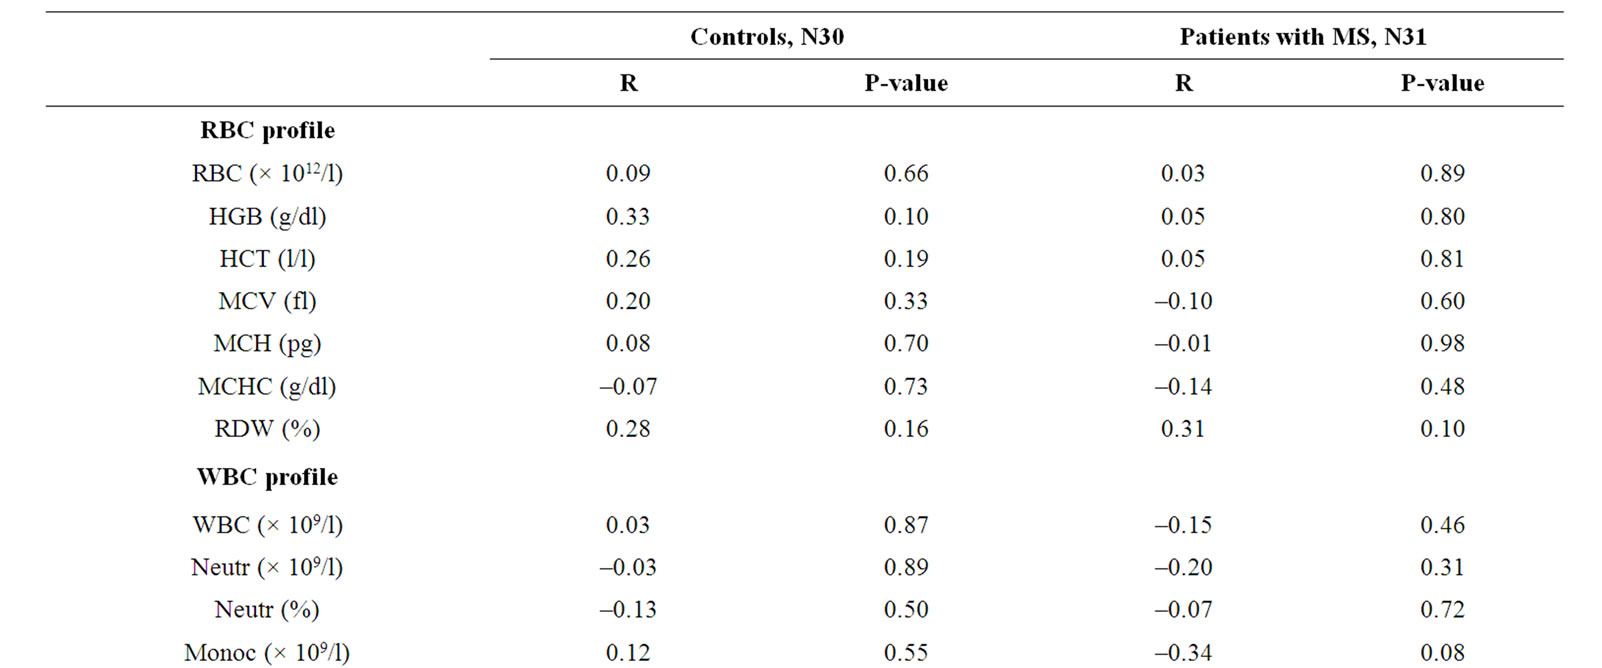
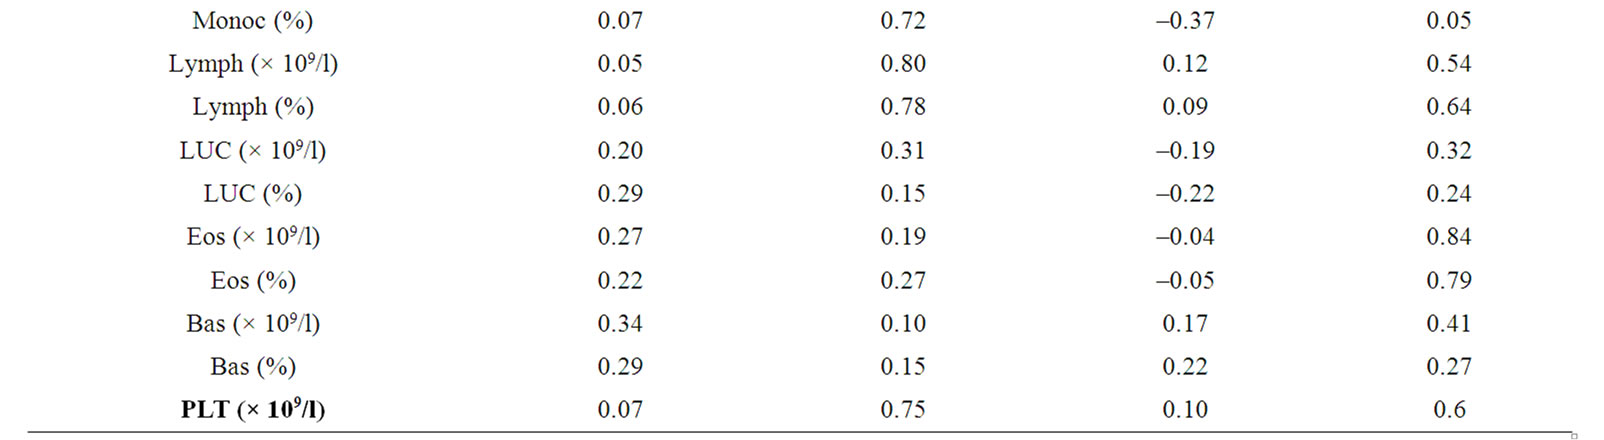
Table 4. Correlations between C-reactive protein and the haematological profile in control subjects and patients with multiple sclerosis.
Correlations between the haematological profile and history including aging, years since diagnosis and years diseased in control subjects (age only) and patients with multiple sclerosis are summarized in Table 5: Both the RBCs and the HCT showed significant inverse correlation with years since diagnosis, R = –0.46; P < 0.01 and R = –0.38; P = 0.04 respectively. Neither the control group nor the patients showed a correlation between RBCs and age in years. The neutrophil percentage showed an inverse correlation with age in patients with MS, R = –0.36, P = 0.04.
Correlations between platelet count and the haematological profile in control subjects and patients with multiple sclerosis are summarized in Table 6: The platelet count showed an inverse correlation with the HGB in patients with MS (R = –0.37; P = 0.04). It showed positive correlations with the WBC, neutrophil and monocyte counts in both study groups. However, it showed a positive correlation with the lymphocyte count in control subjects, but an inverse correlation in patients with MS (controls: R = 0.38; P = 0.04; patients: R = –0.39; P = 0.03 respectively).
4. Discussion
Results from this study showed that the RBC count correlated inversely with the EDSS, showing a worsening of symptoms with a decrease in the RBC counts. Although the RBC count was not significantly decreased in patients with MS they were non-significantly decreased and furthermore showed an inverse correlation with time since diagnosis but not with age in either patients or controls, suggesting a trend towards RBC vulnerability in patients and also showing some similarity to the reduced myelin yield reported in normal appearing white matter from patients with MS [5]. MS is an inflammatory disease in which long-chain fatty acid metabolic abnormalities
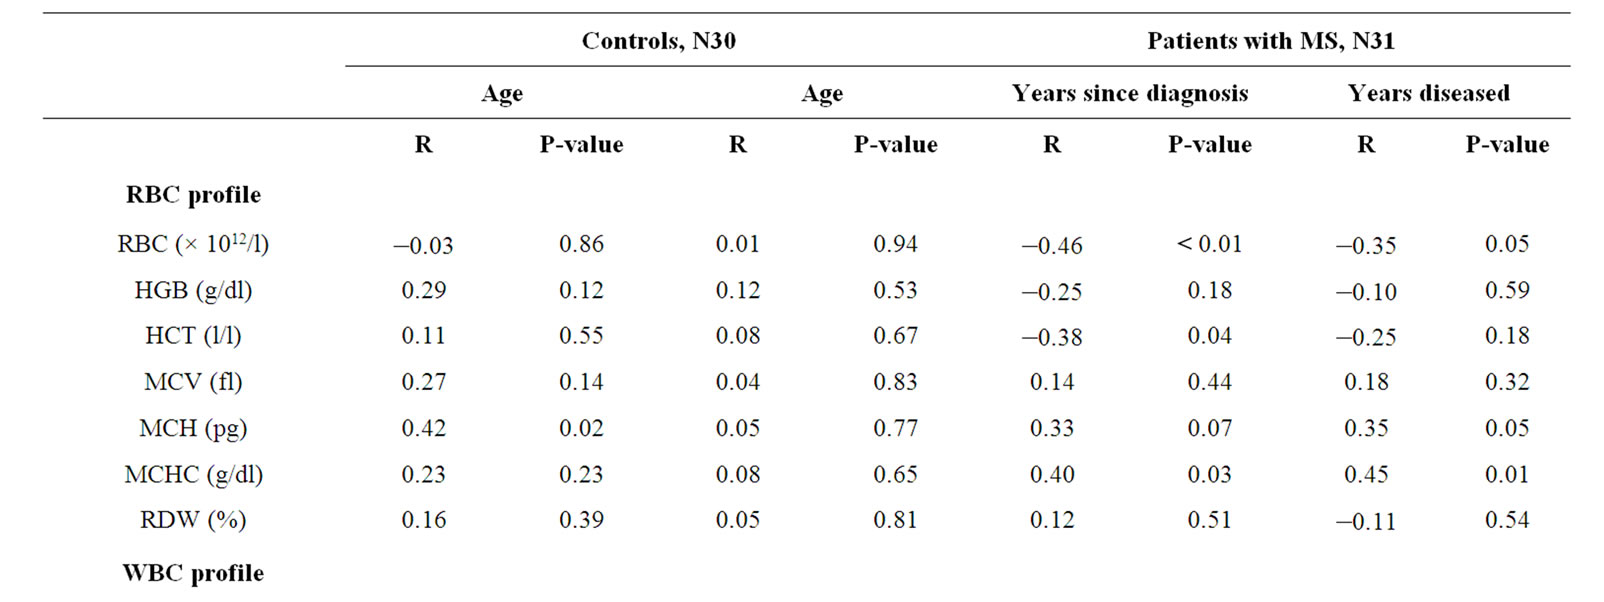
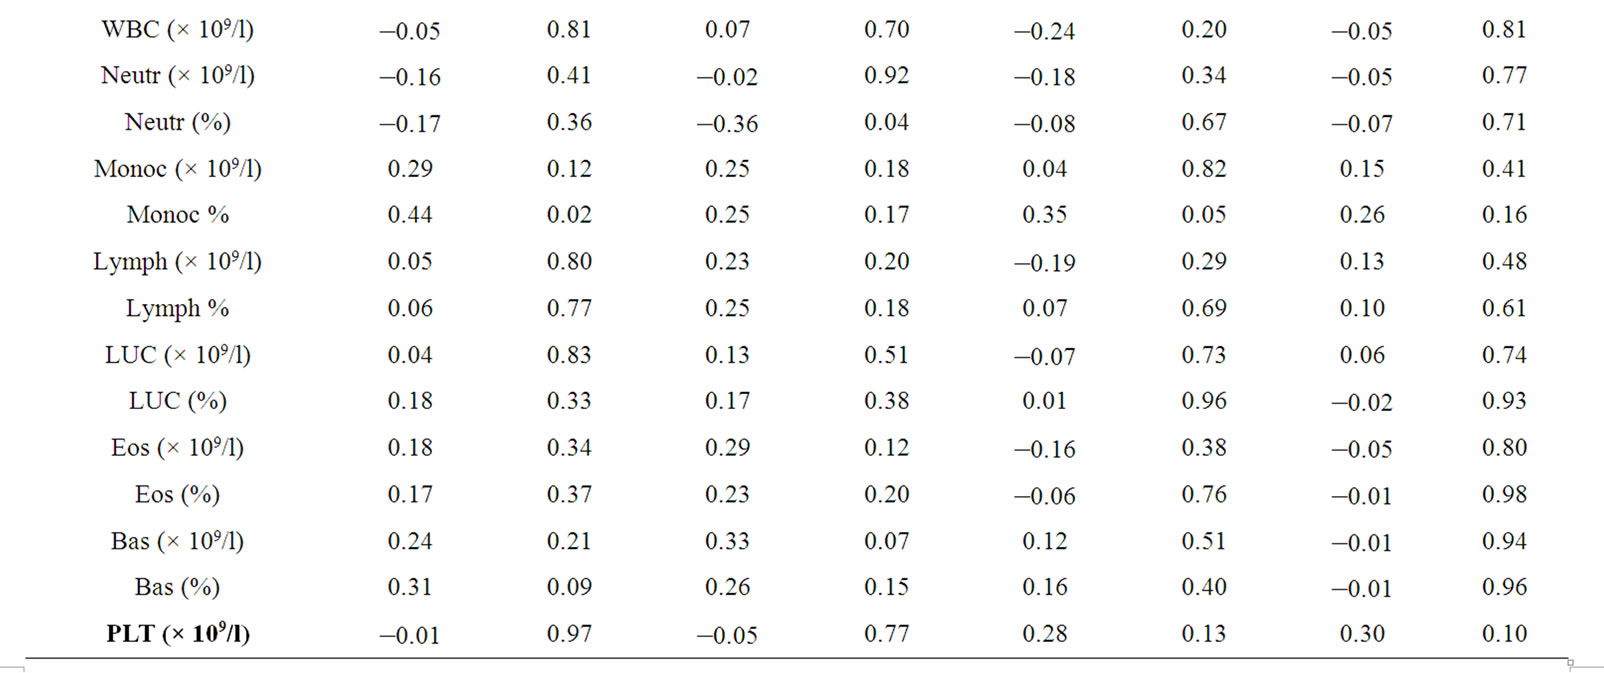
Table 5. Correlations between the haematological profile and history including aging, years since diagnosis and years diseased in control subjects (age only) and patients with multiple sclerosis.
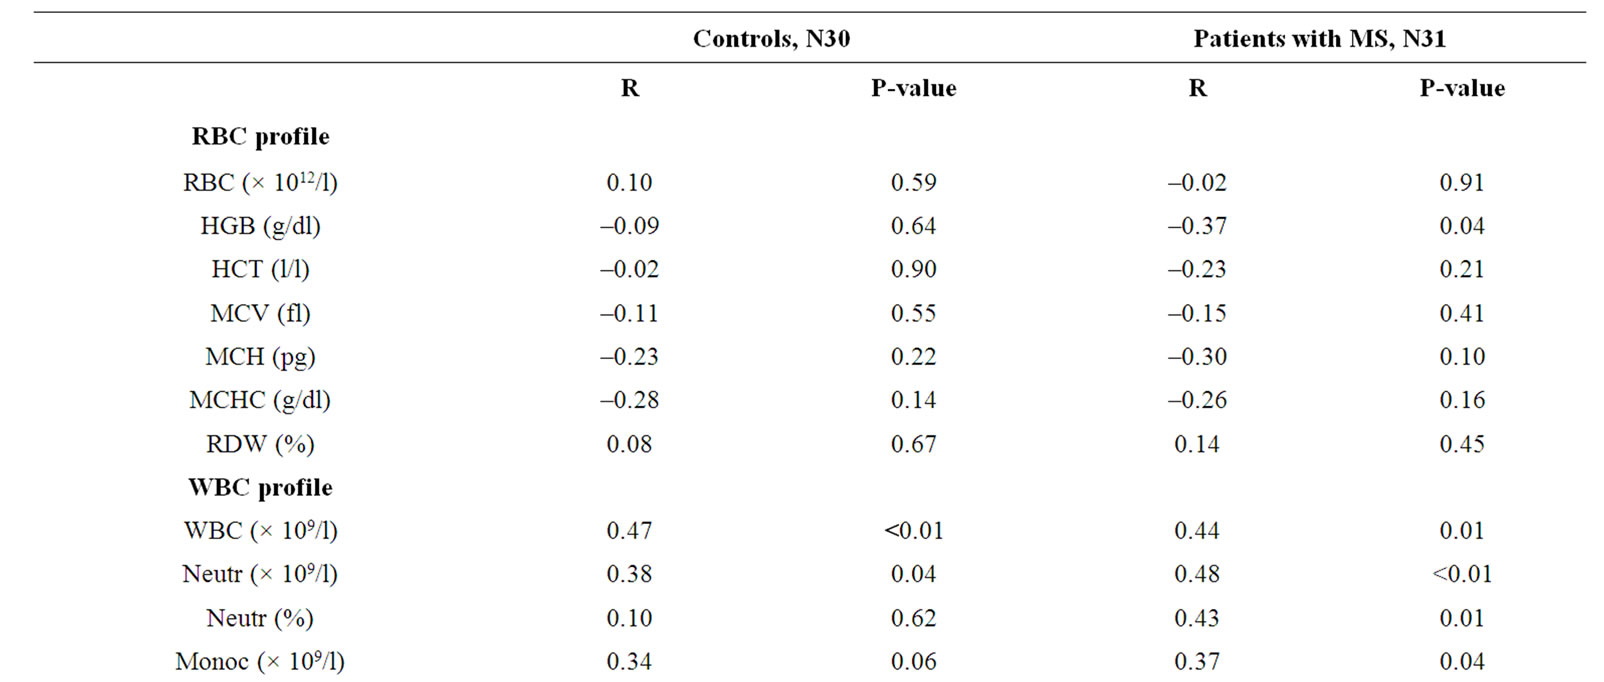

Table 6. Correlations between platelet count and the haematological profile in control subjects and patients with multiple sclerosis.
have been reported in RBC membranes [17,18] as well as in myelin from patients with MS [19,20]. These fatty acids are precursors for eicosanoid production, but they are also important in cell membrane structure and function such as membrane fluidity. Red blood cells are vulnerable to hydrolysis by serum phospholipase A2 when membrane fluidity and deformability are compromised [7,8], and impaired membrane fluidity has been reported in RBC from patients with MS [6]. These results, taken together with the significant decrease in haemoglobin concentration in patients with MS reported in this study, suggested that RBCs do undergo some damage during increased inflammatory conditions. Some evidence for this is the weak positive correlation of the CRP, as a measure of inflammation with the HGB in control subjects, but which was not found in patients with MS. These results suggested that the RBCs increased their HGB concentration under normal conditions during inflammatory activation, but that in patients with MS, either a possible metabolic abnormality in the RBCs and/or an effect of the inflammatory process on the RBC itself existed.
Results from previous studies differ substantially regarding HGB concentrations in patients with MS. Kocer et al. [21] reported non-significantly lower HGB concentrations in patients with MS as compared to healthy controls, P = 0.07. In the group with MS, HGB concentrations were low in 12 subjects (34.3%) and in the control group the HGB concentrations were low in 2 subjects (6.7%). Similarly, Van Rensburg et al. [22] reported significantly lower HGB concentrations in a sub-group of patients with MS, diagnosed at a young age (19 - 32 years) as compared to a group diagnosed at a later age (35 - 51 years). In contrast, Brooks et al. [23] and Sfagos et al. [24] reported no difference in HGB concentrations between patients with MS and healthy controls. In this study, the age of diagnosis of patients ranged from 23 to 62 years, which included patients from the same age bracket as those of Van Rensburg et al. [22], suggesting that age of diagnosis could be a contributing factor to decreased HGB concentrations in patients with MS. In contrast, Brooks et al. [23] reported age of clinical onset of disease (ranging from 17 - 53 years), similar to this study (ranging from 14 to 55 years), where early onset appeared to show no effect on the HGB concentrations in patients with MS. It is unclear therefore why results from this study should differ from that of other research groups including that of Brooks et al. [23] and Sfagos et al. [24]. In this regard, methodology could be important when investigating HGB concentrations in small study groups. In the present study patients and controls were age and gender matched, similar to that of Van Rensburg et al. [22], while those of Brooks et al. [23] were not age matched (age: mean + STD, MS: 44 ± 13, controls: 39 ± 11) and that of gender is unclear from reported results, 15 patients with MS (number of males and females unknown) and 13 controls (8 males and 5 females). Similarly, Kocer et al. [21] reported HGB concentrations for males and females together and patients and controls were not age-matched (patients with MS: 30.1 ± 8.0 and controls: 34.3 ± 12.4 years). Furthermore, with a low sample size it is advisable to use median and range as a measure for central tendency, rather than mean and STD, because low numbers would most probably show an uneven distribution, and Brooks et al. [23], (15 patients), Van Rensburg et al. [22] (41 patients) as well as Kocer et al. [21] (35 patients) reported results as mean ± STD. Further studies are needed however to verify whether these or unknown confounding variables were responsible for these discrepancies.
Although immune cells from patients with MS showed very little correlation with disease outcome, the neutrophil percentage was increased in patients and furthermore showed a non-significant positive correlation with the Cerebellar FSS. Again, although this correlation was not statistically significant, the non-significant positive correlation showed some similarity to results from Simpson et al. [25] who reported an increase in the peripheral leucocyte count in patients with MS. Neutrophils and monocytes are the leukocytes that destroy foreign agents by phagocytosis [3]. When activated, they migrate to injured sites where they remove dead cells through phagocytosis. These findings, taken together, suggested that damage to the brain might be primarily glial cell involvement, but that changes in the peripheral immune cell composition might contribute to the disease aetiology. The role of glial cells in the inflammatory activation in brain tissue from patients with MS has been well established, and glial involvement has been shown in CNS disorders, especially in MS. Barnett and Prineas [26] reported that microglia were the only immune cells present in the apoptotic zone during the first few hours of the formation of a new lesion, while lymphocytes and macrophages were rare or absent in the apoptotic zone, although they were present elsewhere in the lesion [26-28].
In contrast to WBCs, platelets were significantly increased in patients with MS and furthermore showed positive correlations with the Visual FSS and the Brainstem FSS, and an inverse correlation with the Sensory FSS. It is unclear why platelets in patients were increased. Platelet aggregation (stickiness) is needed for bleeding to stop [29]. The activation of platelets triggers a series of reactions which can culminate in shape change, granule release and aggregation [29]. Platelet stickiness has been reported to be increased in patients with MS [30,31]. Abnormal platelet electrophoretic behaviour in patients with MS was reported to be related to a disturbance in the plasma-phospholipid patterns [32]. One of the alternative pathways for platelet aggregation depends on prostaglandin biosynthesis, thereby inducing the release of fatty acid C20:4n-6 (arachidonic acid) from the membrane, followed by conversion to thromboxane A2, which is a potent stimulator of aggregation [29]. In this regard, a decrease in C18:2n-6 and/or C20:4n-6 has been well documented in platelets, RBC and WBC membranes from patients with MS [17,18,33-39]. Taken together, these findings suggested possible pathways whereby platelets could have contributed to disease progression.
In conclusion, results indicated that the RBC count correlated inversely with neurological outcome as measured by the EDSS in patients with MS. Furthermore, platelets contributed both to the compromised RBC profile and a worse disease outcome. Because RBC’s are vulnerable to hydrolysis by serum phospholipase A2, these findings lend support to the notion that the release of fatty acids, especially C20:4n-6 (arachidonic acid) from red blood cells may be a contributor to the aetiology of multiple sclerosis.
5. Acknowledgements
We would like to extend our sincere gratitude to the following: The MS Society, Western Cape Branch, South Africa, sister Treska Botha for the recruitment of patients.
REFERENCES
- K. A. Brown, “Factors Modifying the Migration of Lymphocytes across the Blood-Brain Barrier,” International Immunopharmacology, Vol. 1, No. 12, 2001, pp. 2043- 2062. doi:10.1016/S1567-5769(01)00129-1
- G. Mameli, V. Astone, G. Arru, S. Marconi, L. Lovato, C. Serra, S. Sotgiu, B. Bonetti and A. Dolei, “Brains and Peripheral Blood Mononuclear Cells of Multiple Sclerosis (MS) Patients Hyper Express MS-Associated Retrovirus/ HERV-W Endogenous Retrovirus, But not Human Herpesvirus 6,” Journal of General Virology, Vol. 88, No. 1, 2007, pp. 264-274. doi:10.1099/vir.0.81890-0
- F. Erman, S. Aydin, Y. Demir, F. Akcay and E. Bakan, “Determination of Saturated and Unsaturated Fatty Acids Amounts in Leukocyte Membranes from Subjects Fed with Solid and Fluid Oils,” Journal of Biochemistry and Molecular Biology, Vol. 39, No. 5, 2006, pp. 516-521. doi:10.5483/BMBRep.2006.39.5.516
- T. Kanda, “Blood-Brain Barrier in Multiple Sclerosis: Mechanisms of Its Breakdown and Repair,” Nippon Rinsho, Vol. 61, No. 8, 2003, pp. 1402-1408.
- E. Göpfert, S. Pytlik and H. Debuch, “2’,3’-Cyclic Nucleotide 3’-Phosphohydrolase and Lipids of Myelin from Multiple Sclerosis and Normal Brains,” Journal of Neurochemistry, Vol. 34, No. 3, 1980, pp. 732-739. doi:10.1111/j.1471-4159.1980.tb11205.x
- G. M. Hon, M. S. Hassan, S. J. Van Rensburg, S. Abel, P. Van Jaarsveld, R. T. Erasmus and T. Matsha, “Red Blood Cell Membrane Fluidity in the Etiology of Multiple Sclerosis,” Journal of Membrane Biology, Vol. 232, No. 1-3, 2009, pp. 25-34. doi:10.1007/s00232-009-9213-1
- J. E. Allen and H. Rasmussen, “Human Red Blood Cells: Prostaglandin E2, Epinephrine, and Isoproterenol Alter Deformability,” Science, Vol. 174, No. 4008, 1971, pp. 512-514. doi:10.1126/science.174.4008.512
- F. M. Harris, S. K. Smith and J. D. Bell, “Physical Properties of Erythrocyte Ghosts that Determine Susceptibility to Secretory Phospholipase A2,” The Journal of Biological Chemistry, Vol. 276, No. 25, 2001, pp. 22722-22731. doi:10.1074/jbc.M010879200
- B. Reipert, “Multiple Sclerosis: A Short Review of the Disease and Its Differences between Men and Women,” Journal of Modern History, Vol. 1, No. 4, 2004, pp. 334- 340.
- C. H. Polman, S. C. Reingold, G. Edan, M. Filippi, H.-P. Hartung, L. Kappos, F. D. Lublin, L. M. Metz, H. F. McFarland, P. W. O’Connor, M. Sandberg-Wollheim, A. J. Thompson, B. G. Weinshenker and J. S. Wolinsky, “Diagnostic Criteria for Multiple Sclerosis: 2005 Revisions to the ‘McDonald Criteria’,” Annals of Neurology, Vol. 58, No. 6, 2005, pp. 840-846. doi:10.1002/ana.20703
- J. F. Kurtzke, “Rating Neurologic Impairment in Multiple Sclerosis: An Expanded Disability Status Scale (EDSS),” Neurology, Vol. 33, No. 11, 1983, pp. 1444-1452. doi:10.1212/WNL.33.11.1444
- J. H. Noseworthy, C. Lucchinetti, M. Rodriguez and B. G. Weinshenker, “Multiple Sclerosis,” New England Journal of Medicine, Vol. 343, No. 13, 2000, pp. 938-952. doi:10.1056/NEJM200009283431307
- S. M. Leary, B. Porter and A. J. Thompson, “Multiple Sclerosis: Diagnosis and the Management of Acute Relapses,” Postgraduate Medical Journal, Vol. 81, No. 955, 2005, pp. 302-308. doi:10.1136/pgmj.2004.029413
- G. Giovannoni, D. H. Miller, N. A. Losseff, M. Sailer, N. Lewellyn-Smith, A. J. Thompson and E. J. Thompson, “Serum Inflammatory Markers and Clinical/MRI Markers of Disease Progression in Multiple Sclerosis,” Journal of Neurology, Vol. 248, No. 6, 2001, pp. 487-495. doi:10.1007/s004150170158
- J. Sellner, I. Greeve and H. P. Mattle, “Atorvastatin Decreases High-Sensitivity C-Reactive Protein in Multiple Sclerosis,” Multiple Sclerosis Journal, Vol. 14, No. 7, 2008, pp. 981-984. doi:10.1177/1352458508091368
- G. Giovannoni, J. W. Thorpe, D. Kidd, B. E. Kendall, I. F. Moseley, A. J. Thompson, G. Keir, D. H. Miller, M. Feldmann and E. J. Thompson, “Soluble E-Selectin in Multiple Sclerosis: Raised Concentrations in Patients with Primary Progressive Disease,” Journal of Neurology, Neurosurgery & Psychiatry, Vol. 60, No. 1, 1996, pp. 20-26. doi:10.1136/jnnp.60.1.20
- G. D. Cheravil, “Sialic Acid and Fatty Acid Concentrations in Lymphocytes, Red Blood Cells and Plasma from Patients with Multiple Sclerosis,” Journal of the Neurological Sciences, Vol. 63, No. 1, 1984, pp. 1-10. doi:10.1016/0022-510X(84)90104-7
- G. M. Hon, M. S. Hassan, S. J. Van Rensburg, S. Abel, D. W. Marais, P. Van Jaarsveld, C. M. Smuts, F. Henning, R. T. Erasmus and T. Matsha, “Erythrocyte Membrane Fatty Acids in Patients with Multiple Sclerosis,” Multiple Sclerosis Journal, Vol. 15, No. 6, 2009, pp. 759-762. doi:10.1177/1352458509103321
- L. S. Chia, J. E. Thompson and M. A. Moscarello, “Alteration of Lipid-Phase Behavior in Multiple Sclerosis Myelin Revealed by Wide-Angle X-Ray Diffraction,” Proceedings of the National Academy of Sciences USA, Vol. 81, No. 6, 1984, pp. 1871-1874. doi:10.1073/pnas.81.6.1871
- R. Wilson and D. R. Tocher, “Lipid and Fatty Acid Composition Is Altered in Plaque Tissue from Multiple Sclerosis Brain Compared with Normal Brain White Matter,” Lipids, Vol. 26, No. 1, 1991, pp. 9-15. doi:10.1007/BF02544017
- B. Kocer, S. Engur, F. Ak and M. Yılmaz, “Serum Vitamin B12, Folate, and Homocysteine Levels and Their Association with Clinical and Electrophysiological Parameters in Multiple Sclerosis,” Journal of Clinical Neuroscience, Vol. 16, No. 3, 2009, pp. 399-403. doi:10.1016/j.jocn.2008.05.015
- S. J. Van Rensburg, M. J. Kotze, D. Hon, P. Haug, J. Kuyler, M. Hendricks, J. Botha, F. C. V. Potocnik, T. Matsha and R. T. Erasmus, “Iron and the Folate-Vitamin B12-Methylation Pathway in Multiple Sclerosis,” Metabolic Brain Disease, Vol. 21, No. 2-3, 2006, pp. 121-137. doi:10.1007/s11011-006-9019-0
- D. J. Brooks, K. L. Leenders, G. Head, T. J. Marshall, N. J. Legg and T. Jones, “Studies on Regional Cerebral Oxygen Utilisation and Cognitive Function in Multiple Sclerosis,” Journal of Neurology, Neurosurgery & Psychiatry, Vol. 47, No. 11, 1984, pp. 1182-1191. doi:10.1136/jnnp.47.11.1182
- C. Sfagos, A. C. Makis, A. Chaidos, E. C. Hatzimichael, A. Dalamaga, K. Kosma and K. L. Bourantas, “Serum Ferritin, Transferrin and Soluble Transferrin Receptor Levels in Multiple Sclerosis Patients,” Multiple Sclerosis Journal, Vol. 11, No. 3, 2005, pp. 272-275. doi:10.1191/1352458505ms1171oa
- L. O. Simpson, B. I. Shand, R. J. Olds, P. W. Larking and M. J. Arnott, “Red Cell and Haematological Changes in Multiple Sclerosis,” Pathology, Vol. 19, No. 1, 1987, pp. 51-55. doi:10.3109/00313028709065135
- M. H. Barnett and J. W. Prineas, “Relapsing and Remitting Multiple Sclerosis: Pathology of the Newly Forming Lesion,” Annals of Neurology, Vol. 55, No. 4, 2004, pp. 458-68. doi:10.1002/ana.20016
- F. W. Gay, T. J. Drye, G. W. A. Dick and M. M. Esiri, “The Application of Multifactorial Cluster Analysis in the Staging of Plaques in Early Multiple Sclerosis. Identification and Characterization of the Primary Demylinating Lesion,” Brain, Vol. 120, No. 8, 1997, pp. 1461-1483. doi:10.1093/brain/120.8.1461
- F. Aboul-Enein, H. Rauschka, B. Kornek, C. Stadelmann, A. Stefferl, W. Brück, C. Lucchinetti, M. Schmidbauer, K. Jellinger and H. Lassmann, “Preferential Loss of MyelinAssociated Glycoprotein Reflects Hypoxia-Like White Matter Damage in Stroke and Inflammatory Brain Diseases,” Journal of Neuropathology & Experimental Neurology, Vol. 62, No. 1, 2003, pp. 25-33.
- S. J. Machin and E. Preston, “Laboratory Techniques. Guidelines on Platelet Function Testing,” Journal of Clinical Pathology, Vol. 41. No. 12, 1988, pp. 1322- 1330.
- J. H. D. Millar, J. D. Merrett and A. M. Dalby, “Platelet Stickiness in Multiple Sclerosis,” Journal of Neurology, Neurosurgery & Psychiatry, Vol. 29, No. 7534, 1966, pp. 187-189. doi:10.1136/jnnp.29.3.187
- K. Dohnal, B. Vagner, Z. Lupinek and V. Hulle, “Notes on the Influence of Adrenocorticotrophic Hormone on Platelet Stickiness in Multiple Sclerosis,” Journal of the Neurological Sciences, Vol. 13, No. 4, 1971, pp. 443-446. doi:10.1016/0022-510X(71)90006-2
- C. H. Bolton, J. R. Hampton and O. T. Phillipson, “Platelet Behaviour and Plasma Phospholipids in Multiple Sclerosis,” The Lancet, Vol. 291, No. 7534, 1968, pp. 99- 104. doi:10.1016/S0140-6736(68)92718-9
- R. W. R. Baker, R. H. S. Thompson and K. J. Zilkha, “Serum Fatty Acids in Multiple Sclerosis,” Journal of Neurology, Neurosurgery & Psychiatry, Vol. 27, No. 5, 1964, pp. 408-414. doi:10.1136/jnnp.27.5.408
- J. N. Cumings, R. C. Shortman and T. Skrbic, “Lipid Studies in the Blood and Brain in Multiple Sclerosis and Motor Neurone Disease,” Journal of Clinical Pathology, Vol. 18, No. 5, 1965, pp. 641-644. doi:10.1136/jcp.18.5.641
- M. Fisher, M. H. Johnson, A. M. Natale and P. H. Levine, “Linoleic Acid Levels in White Blood Cells, Platelets, and Serum of Multiple Sclerosis Patients,” Acta Neurol Scand, Vol. 76, No. 4, 1987, pp. 241-245. doi:10.1111/j.1600-0404.1987.tb03574.x
- R. T. Holman, S. B. Johnson and E. Kokmen, “Deficiencies of Polyunsaturated Fatty Acids and Replacement by Nonessential Fatty Acids in Plasma Lipids in Multiple Sclerosis,” Proceedings of the National Academy of Sciences USA, Vol. 86, No. 12, 1989, pp. 4720-4724. doi:10.1073/pnas.86.12.4720
- X. Navarro and R. Segura, “Red Blood Cell Fatty Acids in Multiple Sclerosis,” Acta Neurol Scand, Vol. 79, No. 1, 1989, pp. 32-37. doi:10.1111/j.1600-0404.1989.tb03706.x
- L. S. Harbige and M. K. Sharief, “Polyunsaturated Fatty Acids in the Pathogenesis and Treatment of Multiple Sclerosis,” British Journal of Nutrition, Vol. 98, No. 1, 2007, pp. S46-S53. doi:10.1017/S0007114507833010
- G. Hon, M. Hassan, S. J. Van Rensburg, S. Abel, D. W. Marais, P. Van Jaarsveld, C. Smuts, F. Henning, R. Erasmus and T. Matsha, “Immune Cell Membrane Fatty Acids and Inflammatory Marker, C-Reactive Protein, in Patients with Multiple Sclerosis,” British Journal of Nutrition, Vol. 102, No. 9, 2009, pp. 1334-1340. doi:10.1017/S0007114509382185
NOTES
*Corresponding author.