Natural Resources
Vol.07 No.07(2016), Article ID:68017,12 pages
10.4236/nr.2016.77036
Feather Vibration as a Stimulus for Sensing Incipient Separation in Falcon Diving Flight
Christoph Brücker1, Daniel Schlegel2, Michael Triep2
1Department Mechanical Engineering and Aeronautics, City University London, London, UK
2Institute of Mechanics and Fluid Dynamics, University of Freiberg, Freiberg, Germany

Copyright © 2016 by authors and Scientific Research Publishing Inc.
This work is licensed under the Creative Commons Attribution International License (CC BY).
http://creativecommons.org/licenses/by/4.0/


Received 2 June 2016; accepted 4 July 2016; published 7 July 2016
ABSTRACT
Based on our preceding studies on the aerodynamics of a falcoperegrinus in diving flight along a vertical dam it is known that even when the body shape of the bird is rather streamlined in V-shape some feathers tips may elevate in certain regions of the body. These regions were identified in wind tunnel tests for typical diving flight conditions as regions of locally separated flow. A life-size model in V-shape of a falcoperegrinus with artificial feathers fixed along the body was studied in a wind tunnel to focus on the fluid-structure interaction of feathers located in this sector. The distal ends of the feathers show flow-induced vibrations at typical flight conditions which grow linear in amplitude with increasing angle of incidence until incipient separation. In light of the proven existence of vibration-sensitive mechanoreceptors in the follicles of secondary feathers in birds it is hypothesized that this linear amplitude response offers the bird to sense the angle of incidence during the diving flight using the vibration magnitude as sensory stimulus. Thus the bird in streamlined shape has still a good measure to control its attitude to be in the narrow window of safe angle of incidence. This might have implications also for other birds or technical applications of airfoil sensors regarding incipient separation detection.
Keywords:
Falcon Dive, Feather Vibration, Sensory Stimulus, Incipient Separation

1. Introduction
The peregrine falcon (falcoperegrinus) is the world’s fastest bird. During the diving flight the falcoperegrinus can reach maximum speeds of order of 300 km/h [1] . These maximum diving speeds are achieved when the peregrine falcon approaches the dive from high altitude and adapts a special body shape named as the V-form. The wings are folded around the body and the tail feathers form a narrow paddle-like structure [2] . Velocities of falcon flights were determined via radar observations by [1] and videography [3] - [8] . A previous study in our group [7] with live animals diving along a dam wall showed that in typical dive conditions the flight-path angle is about 50˚ relative to the horizontal and the bird’s angle of incidence is roughly 5˚. The inspection of the high- resolution pictures of the diving peregrine indicate that feathers may pop-up on localized regions on the upper surface of the wing where secondary flight feathers are located. The high-resolution animal images however could provide only a frozen image of the body at such flight conditions and therefore couldn’t give an answer about the motion history of these feathers, e.g. whether they deploy constantly or e.g. are vibrating. The latter is of special interest, since it is known that bird wings have vibration-sensitive mechanoreceptors in a large number along the wing (about 1000 in the manual part of the wing), either at the follicle or along the body in form of the so called Herbst corpuscles (HCs), see e.g. [9] . It was observed that the HCs were highly sensitive to vibrational stimuli applied to the wing feathers and the authors hypothesized that this allows the bird to sense the flow speed, beneath other research [10] - [12] . High-speed cinematography pictures of flying bird have shown that the distal ends of the secondary cover and flight feathers can vibrate up and down rapidly [13] . This agrees with our observation on the falcon bird in the dive. However, in [13] it was impossible to relate this motion in the recordings to the actual flight conditions which were unknown. The vibrational sensitivity of the HCs was tested in [9] with the heart rate conditioning method. Sine wave vibrational stimuli between 50 and 2000 Hz were applied to the 1st, 7th and 16th primary feathers of the wing. The electrophysiological behavior shows a phase-locked nerve impulses with 1:1 stimulus-response relation up to at least 660 Hz at sufficiently high stimulus amplitudes. For the lowest frequencies measured (50 Hz) the stimulus amplitude threshold is of order of 60 - 200 µm. Furthermore, the cells also respond to the amplitude as shown in the work by [11] based on investigations of HCs in the leg. It was observed that the interval decrement (in %) of the electrocardiogram signal (ECG) is a positive correlative function of the stimulus intensity. Although the studies were done on HCs along the bird’s leg, it is likely that the HCs in the wing have the same behavior. More recent electrophysiological studies by [12] focused on the feather-filoplume mechanoreceptors at the follicle on white leghorn chickens. They showed vibrational sensitivity especially for the secondary feathers and found a strong relationship between airflow velocity blown locally over the wing and the discharge of the mechanoreceptors at the follicles of these feathers. This response is highly localized and individual for each feather as vibration induced in one secondary feather is poorly transmitted to feathers with which it is in contact. However, the stimulus itself is only defined in the magnitude of the flow over the wing while also the angle of incidence, flow direction and local flow separation or turbulences have an influence on the feather response. These details are difficult to achieve from life recordings. As a result there is still a lack in quantitative reports of the frequency or magnitude of feather vibration during flight and the local flow situation.
A possible way is to study the bird flight under controlled situation in a wind-tunnel as done in [7] . Because of practical difficulties with life bird in the wind-tunnel the use of silouette-shaped solid body models allows to apply flow visualization techniques and give more freedom in testing conditions. For the peregrine falcon, where we could document secondary feather motion during the life recordings, we have established such a model-at least for the diving flight conditions. This allows us to test the action of feathers on the bird’s body in a wind- tunnel study under controlled realistic flight conditions. For simplification of the complex fluid-structure interaction and to allow optical tracking, we used artificial feathers which are adapted in stiffness and shape to the bird’s ones and were marked at their tips by reflective coating. The measurement method is described first and results are given and discussed thereafter. The focus herein is the main phase of diving flight, where flight conditions remains in a narrow band which we know from our former measurements. This corresponds to the V-type shape of the bird at maximum speed and angle of incidence of about 5˚.
2. Material and Methods
2.1. Life-Size Model
The silhouette-shaped model of the falcon was based on the high-resolution pictures taken in our life animal study [7] from different viewing directions. The flight tests on a dam wall allowed taking detailed photographs when the falcon reached maximum velocity under reproducible flight repetitions. The typical geometry of the falcon wings in this situation was that of an opened-wing with V-shape, see Figure 1. We used a taxidermied

Figure 1. a) pictures from life recording and b) transformation of wing-shape configuration into a physical model.
body of a male falcon and modified the wing positions by hand until the projections of the body shape in the corresponding views matched our recorded images of the life creature in Figure 1. This was checked by visual inspection of the silhouette contours with projection transparencies taken from the images. The modified body was then fixated and scanned (HandyScan 3D, Creaform3D) subsequently to obtain the three-dimensional surface contours. Finally, a one-to-one scaled model (material: polyvinyl chloride PVC) was milled out of a block with the acquired surface contour data using a CNC (Computerized Numerical Control) 5-axis milling machine. The shape of the digital model is given in Figure 1.
2.2. Artificial Feathers
The region of interest for the study is the sector along the upper surface of the bird where the elevation of the distal end of feathers was observed in the life images, see Figure 2 in [7] . When the bird is in V-shape during diving flight, this area is covered by secondary feathers that partly overlap while their distal ends point downstream. Initial tests were conducted in our wind-tunnel with original feathers from peregrine falcon glued onto the model surface. It turned out that the weak contrast of the feather tip contours in the high-speed recordings made it impossible to capture the motion details with image-based optical tracking. Therefore artificial feathers were designed which we could mark at their trailing edges with reflective coating. Their stiffness and sizes are adapted to the Falco pereginus feather’s properties published in [14] which report the dorsal-ventral bending stiffness of different feathers of peregrine falcon. The bending stiffness is defined as Young’s modulus E times the second moment of area I (mm4) [15] . The values given in [14] are specific bending stiffness where the values of E × I are divided by the width w of the rachis. We focus herein on mimicking the bending stiffness in the distal part of the feathers, therefore we take values near the tip in cross-section 8 - 9 (see Figure 1 in [14] , section 8 is at 87.5% of the rachis length). Typical values for the primary feather 1 of the Falco peregrinus at this cross-section near the tip is approximately w = 0.3 - 0.5 mm and specific bending stiffness is about 20 - 50 Nmm. Thus the bending stiffness for the distal end of the primary feathers is in the median range of 10 - 20 Nmm2. Since quantitative values for the secondary feathers are lacking we assume that the secondary feathers have the same order of stiffness as the nearby primary feather 1.
The artificial feathers were made from a thin sheet of thickness h = 0.15 mm made of plastic (PET, Young’s modulus E » 3000 N/mm2). Flexible beams of rectangular shape with length L = 50 mm and width of B = 10 mm were cut-out and fixed at the root of length l = 10 mm with tape on the surface of the model, see Figure 2. Therefore their free length is 40 mm. The second moment of area I for a beam of rectangular cross-section is I = B × h3/12 and equates for the given artificial feather to I = 0.0028 mm4. Thus the bending stiffness is about 8.5
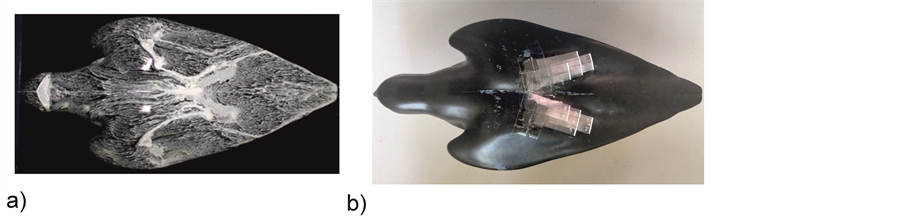
Figure 2. a) Oil-film visualization of the separation sector on the upper surface of the model as documented in [7] ; (a = 5˚, U = 22.5 m/s); b) Model covered with artificial feathers in this sector. The artificial feathers have approximately the same bending stiffness as the feathers measured in [14] and are arranged in a similar way as the secondary feathers appear in life recordings.
Nmm2 which is at the lower end of the values measured values for the bird. Note that the partly overlap of the feathers leads to an increase of the effective bending stiffness. The distal ends of the overlapping feathers are separated in 1 cm distance which is approximately as observed for the secondary feathers in the life images in the region of interest (0.8 - 1.2 cm, taken from the photographs). The trailing edges of the artificial feathers were marked with reflective coating to improve the visibility within the motion recordings. This offers to quantify the tip motion by image-processing and optical tracking in the high-speed recordings.
The arrangement of the artificial feathers as 7 overlapping elements with rectangular shape and same overhang has practical reasons. Firstly, the deployment of feathers was observed in the life studies only in the specified sector on the upper surface while all other feathers remained flat. A comparison of the action of these local elements in the observed region against a situation without feathers flat should not be affected by others feather’s motion upstream of this region otherwise the conclusion may be misleading. Therefore the remainder of the model is left unchanged as a clean surface. Secondly, a certain overlap of feathers is necessary to keep similarity to the real situation where the overlap limits the extension in vibrational amplitude. Finally, we did not copy the planform shape of the real feathers and kept all artificial feathers identical with rectangular shape. This reduces the complexity in motion analysis as we detect the reflection lines of the trailing edges of the flaps, notwithstanding that it is a much simplified feather shape compared to real ones. However we assume that the major component of feather vibrational motion is in ventral-dorsal bending direction which is enforced by the rectangular shape in our experiments.
2.3. Wind Tunnel Tests
A Göttingen-type wind tunnel was used for the measurements with the falcon model. The model was mounted on the sting of a force-balance device and was positioned into the center of the main stream of the wind in Figure 3.
Lift-force measurements were performed with the model covered with feathers in the specified region. For reference, measurements were first done with the artificial feathers distal ends fixed on the wing surface with tape. Thereafter, the tape was removed and the measurements were repeated under the same conditions with the distal ends of the feathers free to elevate. All measurements were done at a flow speed of 22.5 m/s. Note that our previous studies showed that the diving flight was at an angle of incidence at about 5˚ and we assume that the flight envelope in such a V-type shape is not far from this angle of incidence. Therefore we investigated a narrow range of ±5˚ in steps of 1˚ around the observed value of 5˚. This results in 11 measurements from 0˚ to 10˚ in equal steps. The measurement uncertainty is about 80 mN which was tested with different weights attached to the sting.
In addition to the force measurements, high-speed recordings of the feather tip motion were taken at 700 fps (Phantom V12, Vision Research). Therefore a mirror was placed downstream of the model through which the camera was looking from the side of the wind tunnel onto the tips of the feathers with large magnification. An exemplary original picture of the view onto the trailing edges is shown in Figure 4. After the recordings, the digital images were processed to determine the motion profiles of the tips relative to the surface of the body. From theses profiles we further analyzed the mean vibrational amplitude and spectral response of the feather

Figure 3. a) Sketch of the wind tunnel implementation, the angle of incidence a is given in the drawing; b) Picture of the installation in the wind-tunnel with the high-speed camera looking from downstream over a mirror onto the trailing edge of the artificial feathers with large magnification.
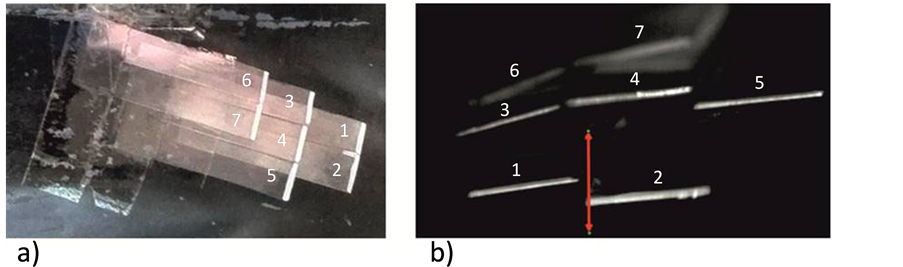
Figure 4. a) Top view on the artificial feathers on the model surface, the feathers are numbered to distinguish each other; b) Magnified image of the reflective coated trailing edges of the feather tips in motion, taken with the high-speed camera from downstream. The downstream view is left-right mirror due to the mirror the camera is looking on. The red arrow shows the maximum excursion of feather #2 in wall-normal direction during the vibration between both arrow tips at maximum positions.
motion. Note that the trailing edges of feathers #6 & 7 are blurred due to the limit of focal depth, therefore they were not considered in the image processing. All measurements were repeated 10 times for statistical evaluation.
2.4. Flow Field Simulations
The three-dimensional CAD model of the falcon was transferred into a computational grid using a grid generation tool (ANSYS 12.1 ICEM CFD, see Appendix). The numerical flow simulations of the falcon allow visualizing flow regions that are difficult to access by experimental methods. As such, they can provide the wall shear stress (WSS) distribution in order to identify regions of low WSS. This is where flow speed is largely reduced in the boundary layer or even where flow is going to separate (WSS is zero). These critical regions in the boundary layer are also subject to rapid growth of instabilities due to the inflexion in the profile [16] . The WSS-distribu- tion combined with the Line-Integral-Convolution (LIC) visualization method show characteristic patterns of the near-wall flow along the streamlined body. The simulation results represent the steady flow along the model without any feathers as a reference. Simulations were run for 22.5 m/s and different a such as in the experiments.
3. Results
3.1. Feather Tip Motion
The time-traces of the feather tip motion are displayed in Figure 5 on top for different angle of incidence. Data

Figure 5. a) and b): time-series of tip motion of feather #2 for different angle of incidence, a = 2˚ in (a) and a = 7˚ in (b) for wind speed of U = 22.5 m/s; c) rms value of vibrations over angle of incidence a; the circular markers are the measurements. The capital letters in the legend represent three ranges of these measurements; range A is a = [0 3], range B is a = [3 7] and range C is a = [7 10]; in these ranges the measured values were approximated by linear regression curves shown as solid lines of different colors d) frequency spectra for plot a) and b).
are shown for feather #2 at two different angles of incidence (a = 2˚ and a = 7˚). Note that the other feathers #1, 3 - 5 show a similar trend, which is therefore not shown here. From the time-trace the root-mean-square (rms-value) was calculated as a measure of the average oscillation amplitude in this recording sequence which is plotted for different a in Figure 5(c)). The frequency of the oscillation is in the range of 30 - 35 Hz and remains in this range for all angle of incidence. This is seen as the first peak in the power spectrum of the data plotted in Figure 5(d)). A rough estimation of the natural frequency of the feathers clamped on the wall (free end is 4 cm long) yields a value of 32 Hz which is in the observed range of the first spectral peak.
While the frequency remains nearly constant, there is a clear difference in the peak amplitudes in Figure 5(a) and Figure 5(b). The time-series for an angle of incidence of 7˚ in Figure 5(b) shows nearly two-times higher peak amplitudes of ±4 mm in the vibration pattern compared to the peaks of ±2 mm for an angle of 2˚ in Figure 5(a). This is summarized in the plot showing the rms amplitude per angle of incidence. The results show for small angles of incidence a near constant rms value of order of 1 mm (range from 0˚ to 3˚ named “A” in Figure 5(c). Beyond that, the rms value rises linear with increasing a up to values of 2.3 mm (range “B” in Figure 5(c)). Above an angle of 7˚ in range “C” the rms value remains constant at an elevated level. A physical explanation for the different stages is given in the following: for low angle of incidence in “A”, the vibration is mainly a consequence of the flutter instability of the flaps induced by the flow separating from the trailing edges of the feathers. The local pressure gradient and boundary layer flow does not change for small increase of the angle of incidence, thus vibrational amplitude remains nearly constant. At a about 3˚ local separation has appeared in the regions of the flaps as shown further below and this separation region grows with further increase of a in range “B”. Herein, vibration is driven by the growing instabilities in the boundary layer and their interaction with the flexible structures. As the instabilities grow with increasing a the amplitude of the vibrations grow, too. In phase “C” the amplitude has reached a maximum level limited by the wall and the overlap of the feathers. No further growth in amplitude is possible because of those constraints.
3.2. Lift Measurements
The lift forces measured with the balance are shown for two different cases in Figure 6. Forces are given here in Newton to show the absolute values rather than the coefficients as common in aerodynamics. First, the measurements were done with the tips of the feathers fixed with a thin tape on the model surface so that the feathers are flat aligned with the model body. This is the reference case which is compared to the one where the feather tips are free to move. This is to have in both experiments the same influence of increased surface roughness imposed by the presence of the artificial feathers. Hence, any difference cannot be related to aspects of the state of the boundary layer. As seen in the plot, the interaction of the feathers with the flow leads to a slight improvement of the total lift force which is about 7% - 8% higher than in the case with the feathers fixed. The standard deviation of the series of repeated experiments is about ±40 mN which is due to the measurement uncertainty in the force measurements. Although small, there is a statistical significant increase of lift which is more pronounced at larger a. This lift improvement with feather tips being free to move is supposed to be the results of two aspects: firstly, the feathers in unforced situation already modify the body contour as they cannot follow part of the smaller curvature radii, therefore flow does see a slightly more streamlined body; secondly, the tendency of local flow separation at higher a and regional loss of lift is seemingly counteracted by the induced flap motion. It is known that artificial feathers in form of flexible flaps can delay stall on wings by suppressing the non-linear growth of instabilities in the shear layer between the outer flow and the decelerated flow in the boundary layer along the suction side of the wing [16] . Whether this is of relevance can only be answered when a fully coupled simulation of fluid structure interaction is done which is beyond the current possibilities of the authors.
3.3. Wall Shear Stress Pattern
The CFD results are given in Figure 7. On top is the view on the upper surface of the body for a speed of 22.5 m/s and 0˚ angle of incidence. It shows the regions of low WSS which are located mainly in the second downstream half of the body in form of a wedge. When comparing with the oil-flow visualization in Figure 2 it explains why patches of oil remain in these zones and are not being transported because of the low WSS. Indeed these zones illustrated in the experiments agree in shape and location with the blue-colored zones of low WSS shown in the CFD results.
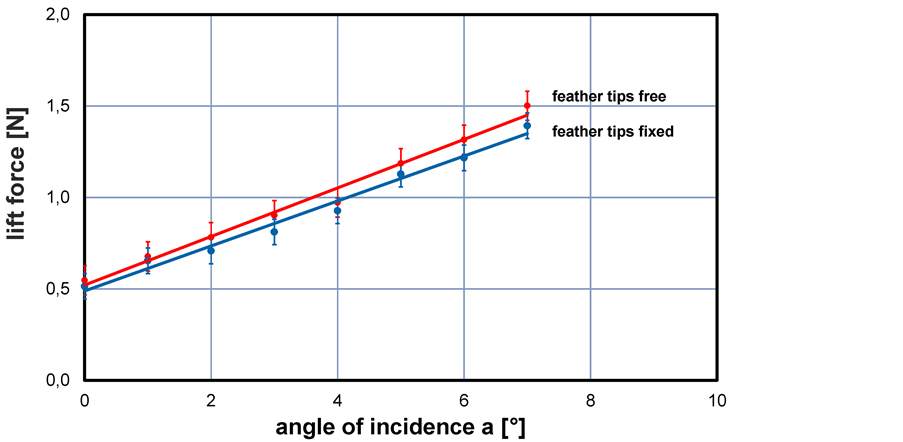
Figure 6. Variation of lift force with angle of incidence with (blue markers) and without (red markers) fixation of the feather tips on the body surface at wind speed 22.5 m/s. The solid lines represent linear regression curves.

Figure 7. Wall shear stress magnitude distribution along the upper surface of the body at speed of 22.5 m/s (color in rainbow distribution, see the color bar). Top: total view on the model at a = 0˚ including the near-wall streamlines. b) sector of low WSS at a = 0˚ (left) and c) growing sector of low WSS at a = 5˚.
The CFD results are presented herein to show the effect of angle of incidence on the size and distribution of the critical region of low WSS. Therefore compare the sectors in Figure 7(b) and Figure 7(c) with each other. Both are scaled with the same color legend. The wedge-like region of low WSS in Figure 7(c) is larger in size and has a larger surface portion covered with blue. Hence, the risk of local flow separation increases with a as we know it from classical airfoil theory. Regions of low WSS exhibit velocity profiles with an inflexion point away from the wall and suffer inviscid instability of the shear flow [17] . This is a necessary condition for instability and such instabilities appear as disturbance waves of certain frequency. Since the distal ends of the artificial feathers are placed in these zones they are excited to vibrate as observed in the wind tunnel tests. In the same way as the region of low WSS grows in size with increased a it is reasonable to assume that the amplitude of instabilities in the local boundary layer above the wall grow in magnitude, too, see [18] . This supports the observed increase in vibrational amplitude in phase “B” of the results shown in Figure 5(c). In comparison, the velocity profiles further upstream in regions of high WSS indicate no inflexion point, thus flow is stable there.
4. Discussion and Conclusion
The current work aims to shed light on the control of falcon during their diving flight and is a follow-up study on our preceding life animal tests at a dam wall, see [7] . It was observed that in some region on the upper surface of the body the tips of feathers elevate, however the recording frequency was not high enough to reveal the temporal nature of this process. This open question is investigated herein in wind-tunnel tests with a model applied with artificial feathers. Firstly, our preceding measurements allowed us to reconstruct the typical flight conditions at the dive, e.g. the contour of the V-type body shape and the typical angle of incidence of 5˚ (diving speed 22.5 m/s, flight path angle 50˚). Secondly, morphological measurements of the bending stiffness of falcon bird feathers [14] allowed us to look for appropriate material and shape to form artificial feathers with the same order of bending stiffness as measured near the distal tips of the feathers of the animals. Starting from that, we built a life-size falcon model covered with artificial feathers and investigated the flow and feather motion in a wind tunnel at diving flight conditions. We limited the parameter space of the investigations to a narrow range around the conditions reported for such a V-type configuration of the falcon body (variation of angle of incidence of about a maximum of ±5˚ around a = 5˚).
When putting artificial feathers with the distal ends in the regions where we observed in the life animal observations the deployment, these feather tips start to vibrate in the wind tunnel tests. Interestingly, there is a linear increase in amplitude of these vibrations per angle of incidence. It is hypothesized that the vibrations are the result of the interaction of the flexible feathers with growing instabilities in the flow. For boundary layer flows such instabilities in general evolve in regions where WSS is largely reduced and where the velocity profile exhibits an inflexion point away from the wall, e.g. as a consequence of a strong adverse pressure gradient. Such regions of low WSS where documented in the CFD results in the sector where the feather tips are located. It is therefore highly likely, that the vibration of the feather tips is excited by the instabilities in the boundary layer at these locations. The amplitude of these disturbances generally increases with angle of incidence [18] (or adverse pressure gradient). Thus, it explains the observed linear increase of the vibrational amplitude. For the typical narrow flight conditions observed at an angle of incidence of 5˚ the bird flies in the center of this amplitude slope.
Supposed that birds are able to sense the secondary feathers vibrational amplitude―and there are strong hints in literature that this is the case as discussed above―the falcon flies during the dive in the range of high stimulus response per rate of change in angle of incidence. Consequently it would allow the bird to sense its flight conditions in a very sensitive way. Note, that the bird in the V-type form has already a streamlined shaped and the feathers are overlapping in large parts. However, some secondary feather tips are exactly located where the stimulus is present and where the magnitude of response increases towards incipient separation. We suggest therefore that the falcon in diving flight is using this stimulus as an indicator of angle of incidence and an early detection of incipient separation to avoid critical flight conditions. This conclusion differs from that of other authors, who hypothesized that the feather vibration is used for sensing of flight speed [10] [12] . They however noted that in addition to the vibration frequency the magnitude might be an additional parameter in the complex sensory behavior of the vibration-sensitive cells in bird. The electro physical experiments of [10] demonstrate that the stimulus amplitude (amplitude of vibrations) has an important influence on the discharge activity of the vibration-sensitive HCs. However no studies on birds so far could provide hints about the relation between vibration amplitude and local flow conditions.
In conclusion, the present study hints on a possible sensory input for flight control of bird, shown here for a flacon in diving condition. This input is related to amplitude-sensing of flow-induced vibrations of feathers located in a sector of the upper surface of the streamlined body that is most critical to incipient separation. Thus the bird in V-type shape has still a good measure to control its attitude to be around 5deg angle of incidence. Note that this was concluded from wind-tunnel tests, literature and logical arguments. A definite proof for such a sensory stimulus in life animal flight is still lacking because of the complexity of fluid structure interaction and in-situ measurements in real flight. The biological context of the study requires greater attention; the focus of the investigation is the potential use of feather vibration for sensory input to guide control during the high speed dives of peregrines, but all neurophysiological and histological information available concerning vibration-sensi- tive mechanoreceptors that occur in large numbers in bird wings derive from studies of pigeons and chickens, and involve nothing like high-speed flight. It is therefore reasonable that the feather vibration amplitude as sensory input for incipient separation may not only be used by the falcon but by other birds too and for a broader range of flight parameters. Further studies are required placing this subject in the context of the function of feather vibration more broadly, a topic that is left for future work.
Finally, the results may be of significance also for technical applications. Localized sensors of type of thin artificial feathers (e.g. flaps made of piezo-electric material) along the surface of airfoils may help to detect incipient separation by the mechanism reported herein using the amplitude of vibrations (as well as the frequency) as sensory input. These sensors can be placed in sectors of the wing where incipient separation in form of small patches of retarded flow appears first. As such they help to get early sensory input of any critical growth of disturbances before the separation growth further in size and extension along the wing. In combination with localized actuators active flow control is possible to counter-act and to prevent stall. Furthermore, as the results show the feather-type sensory structures itself have already a beneficial effect on the lift while they are interacting with the flow. Thus, flow is already improved by passive fluid-structure interaction.
Acknowledgements
The position of D. S. was funded by the Air Force Office of Scientific Research, Air Force Material Command, USAF under Award No. FA9550-14-1-0315 and program manager Russel Cummings. Funding of the position of Professor C. B. as the BAE SYSTEMS Sir Richard Olver Chair in Aeronautical Engineering is gratefully acknowledged herein.
Cite this paper
Christoph Brücker,Daniel Schlegel,Michael Triep, (2016) Feather Vibration as a Stimulus for Sensing Incipient Separation in Falcon Diving Flight. Natural Resources,07,411-422. doi: 10.4236/nr.2016.77036
References
- 1. Alerstam, T. (1987) Radar Observations of the Stoop of the Peregrine Falcon Falco peregrinus and the Goshawk Accipiter gentilis. Short Communications, 129, 267-273.
- 2. Seitz, K. (1999) Vertical Flight. NAFA Journal, 38, 68-72.
- 3. Ratcliffe, D.A. (1980) The Peregrine Falcon. Vermillon, Buteo Books.
- 4. Hustler, K. (1983) Breeding Biology of the Peregrine Falcon in Zimbabwe. Ostrich, 54, 161-171.
http://dx.doi.org/10.1080/00306525.1983.9634466 - 5. Tucker, V.A. (1990) Body Drag, Feather Drag and Interference Drag of the Mounting Strut in a Peregrine Falcon, Falco peregrinus. Journal Experimental Biology, 149, 449-468.
- 6. Tucker, V.A. (1998) Gliding Flight: Speed and Acceleration of Ideal Falcons during Diving and Pull Out. Journal Experimental Biology, 201, 403-414.
- 7. Ponitz, B., Schmitz, A., Fischer, D., Bleckmann, H. and Brücker, C. (2014) Diving-Flight Aerodynamics of a Peregrine Falcon (Falco peregrinus), PLoS One, 9, e86506.
http://dx.doi.org/10.1371/journal.pone.0086506 - 8. Nachtigall, W. (1984) Vogelflugforschung in Deutschland. Journal fürOrnithologie, 125, 157-187.
http://dx.doi.org/10.1007/BF01640586 - 9. Hoerster, W. (1990) Histological and Electrophysiological Investigations on the Vibration-sensitive Receptors (Herbst corpuscles) in the Wing of the Pigeon (Columba livia). Journal of Comparative Physiology A, 166, 663-673.
- 10. Hoerster, W. (1990) Vibrational Sensitivity of the Wing of the Pigeon (Columba livia)—A Study Using Heart Rate Conditioning. Journal of Comparative Physiology A, 167, 545-549.
- 11. Shen, Y. (1983) A Behavioral Study of Vibrational Sensitivity in the Pigeon (Columba livia). Journal of Comparative Physiology, 152, 251-255.
http://dx.doi.org/10.1007/BF00611189 - 12. Brown, R.E. and Fedde, M.R. (1993) Airflow Sensors in the Avian Wing. Journal Experimental Biology, 179, 13-30.
- 13. Rüppell, G. (1980) Technik des Vogelfluges—D 1368. Institut für den wissenschaftlichen Film, Göttingen.
- 14. Schmitz, A., Ponitz, B., Brücker, C., Schmitz, H., Herweg, J. and Bleckmann, H. (2015) Morphological Properties of the Last Primaries, the Tail Feathers, and the Alulae of Accipiter nisus, Columba livia, Falco peregrinus, and Falco tinnunculus. Journal of Morphology, 276, 33-46.
http://dx.doi.org/10.1002/jmor.20317 - 15. Bonser, R.H.C. and Purslow, P.P. (1995) The Young’s-Modulus of Feather Keratin. Journal Experimental Biology, 198, 1029-1033.
- 16. Rayleigh, F.R.S. (1879) On the Stability, or Instability, of Certain Fluid Motions. Proceedings London Mathematical Society, s1-11, 57-72.
http://dx.doi.org/10.1112/plms/s1-11.1.57 - 17. Brücker, C. and Weidner, C. (2014) Influence of Self-Adaptive Hairy Flaps on the Stall-Delay of an Airfoil in Ramp-Up Motion. Journal of Fluids and Structures, 47, 31-40.
http://dx.doi.org/10.1016/j.jfluidstructs.2014.02.014 - 18. Mulleners, K. and Raffel, M. (2012) The Onset of Dynamic Stall Revisited. Experiments in Fluids, 52, 779-793.
http://dx.doi.org/10.1007/s00348-011-1118-y
Appendix
The numerical flow simulations of the falcon allow visualizing flow regions that are difficult to access by experimental methods. In the present study, the three-dimensional CAD model of the falcon is transferred into a computational unstructured grid using a grid generation tool ICEM CFD 14.5 (ANSYS, Inc., Canonsburg, PA, USA). The computational domain as marked in Appendix Figure 1 includes the inflow region, the falcon region, and the downstream wake region of the flow.
Special attention was paid to the meshing of the falcon. Refinements toward near-wall regions were taken into consideration. The grid consists in total of 6.5 million unstructured tetrahedron cells and 1.5 million prism cells on the falcon surface. The angles of the joints were all above 30˚ and the value of the determinant of the Jacobian matrix was higher than 0.5, following convergence considerations (ANSYS 12.1 ICEM CFD). This is standard procedure in CFD. A mesh independency check for the results of lift and drag coefficients was done for up to 10 million cells. Simulation stability was investigated in respect to different grid parameters and following settings leads to stable results: The height of the first prisms layer on the falcon surface is set to 0.1 mm (y+ = 0.2) with a growth factor of 1.10 for the following layer perpendicular to the wall and a total number of 10 layers (Appendix Figure 2).
The numerical flow simulation was performed using the open source CFD software OpenFOAM (OpenCFD Ltd., Bracknell, UK). The code numerically solves the conservation equations of mass and momentum by means of a finite volume approach. The Reynolds number Re based on the length Lref = 400 mm reaches values of about Re = 587 000 for u = 22.5 m/s. Therefore, turbulent flow is taken into account by a Reynolds averaged approach and the one equation Spalart-Almaras turbulence model. Air was treated as a single-phase, incompressible (Ma = 0.07), isothermal (20˚C) Newtonian fluid with constant density (1.189 kg/m3) and viscosity (18.232 × 10⁻⁶ Pa s). Boundary conditions were chosen in agreement with the experimental situation described in the section before and are defined in Appendix Table 1.
Due to the incompressible character of the flow, the pressure was set in average constant in the outlet of the test compartment, so that the simulated relative pressure field can be transferred in the post-processing to the correct pressure level with the help of experimental measurements. The simulations were carried out for steady flow conditions.
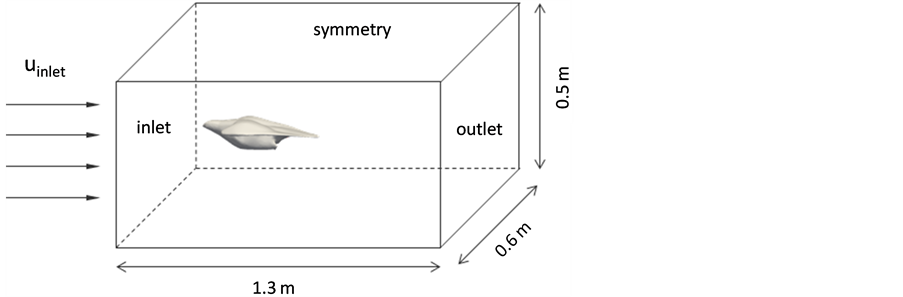
Appendix Figure 1.Numerical model dimensions and boundary conditions.

Appendix Figure 2.Prisms layer and density boxes of the grid refinement.

Appendix Table 1.Overview of boundary conditions.

Submit your manuscript at: http://papersubmission.scirp.org/