Natural Resources
Vol.5 No.9(2014), Article
ID:48436,9
pages
DOI:10.4236/nr.2014.59040
The Italian ZECOMIX Platform: CO2 Capture on Calcined Dolomite in Fluidized Bed Carbonator Unit
Silvera Scaccia1*, Stefano Stendardo1, Giuseppina Vanga1, Leandro Pagliari1, Stefano Cassani1, Mirko Nobili1, Giuseppe Messina1, Andrea Assettati1, Giuliano Guidarelli1, Salvatore Attanasi1, Caterino Stringola1, Andrea Grasso1, Ivano Cassani1, Antonio Calabró2, Pier Ugo Foscolo3
1Sustainable Combustion Laboratory (UTTEI-COMSO), C.R. ENEA, Rome, Italy
2Energy Efficiency UTEE-GRT, ENEA-CCEI UMBRIA, Perugia, Italy
3Department of Chemistry, Chemical Engineering and Materials, University of L’Aquila, L’Aquila, Italy
Email: *silvera.scaccia@enea.it, stefano.stendardo@enea.it
Copyright © 2014 by authors and Scientific Research Publishing Inc.
This work is licensed under the Creative Commons Attribution International License (CC BY).
http://creativecommons.org/licenses/by/4.0/
![]()
![]()

Received 25 March 2014; revised 2 May 2014; accepted 24 May 2014
ABSTRACT
The Italian Zecomix platform is a gasification pilot-scale plant integrated CCS technology, whose flexibility allows operating each unit alone. For quantitative analysis of the gaseous species an analytical system based on commercially available instruments and sampling lines at various points of plant was properly designed. A Fourier Transform Infrared Spectrometric (FTIR) with portable low resolution and gas chromatographic tools were used. The fluidized bed calciner/ carbonator unit was fed with naturally occurring dolomite (about 300 kg) from quarry of Biella (Italy) and tested for CO2 capture. Carbonation reaction was conducted at around 700˚C under simulated reformed synthesis gas containing 30% of CO2. Based on GC and FTIR results a CO2 retention better than 70% was achieved. The application of grain model establishing the carbonation reaction was kinetically controlled within 50 seconds and the reaction rate constant was comparable to that obtained at laboratory-scale level by thermogravimetric analyzer.
Keywords:ZECOMIX Experimental Platform, Dolomite, CO2 Capture, Fluidized Bed, GC and FTIR, Kinetics

1. Introduction
The usage of solid fossil fuel such as coal for power generation is allowed with high efficiency and low pollutant emissions and storage of greenhouse gas (CO2) in an integrated gasification combined cycles plant (IGCC). The basic concept of this technology relies in exposing the coal gasification product (synthesis gas) to a complex cleaning and H2-enrichment coal gas processes. The latter takes place through sorption enhanced water shift reaction (SE-WGS), which combines the WGS reaction and CO2 capture on a solid sorbent in a single step. The H2-rich cleaned syngas is then burnt in a gas turbine, whereas the pure CO2 stream obtained during spent sorbent regeneration can be geologically stored or/and utilized in chemical synthesis.
At ENEA Research Center (Rome, Italy) is currently testing a pilot-scale plant denominated ZECOMIX (acronym for Zero Emission CarbOn MIXed), based on an gasification system unit and CCS (carbon capture and storage) technology for the production of energy with almost zero emissions of CO2 [1] . The main goal of the ZECOMIX experimental platform is the investigation on the CaL technology as a promising option for high temperature decarbonisation of coal/biomass derived syngas. The flexible platform, indeed, allows each unit to be operated separately or linked together. Specifically, the CO2 capture is realized through the Calcium Looping (CaL) technology in the carbonator/calciner unit, which makes use of fluidized bed technologies. The bed, formed by a calcium-based sorbent (CaO), is fluidized through a CO2-containing flue gas. The CaCO3 yielded is reversed to a renewed CaO through calcination, thus closing the loop. The aim of this work is to present the first results of experimental activities on carbonate chemical CaL process.
The real parameters of the whole plant have to be available, which can be adjusted to maximise the selective reaction conversions and increase the chemical efficiency of the process. Parameters such as temperature, pressure, and flow rate are of typical interest of engineering process [2] . However, the monitoring of gaseous species yielded during the chemical processes could become mandatory. The suitability of owning an on-line system for analysing the products formed during a given industrial process gives rise to a number of advantages such as analysis time saving because the sample collection, transportation, and preparation steps belonging own to off-line analysis are avoided with consequently reduction of errors associate with them. The products formed over time make possible new insights into kinetics of various processes. Meantime a dynamic response with changed parameters such as oxygen supply during coal combustion to provide the required energy for operating the various units of plant can be an advantage. The performance of gas cleaning and downstream applications will be dependent on the successful of knowledge of result.
A broad range of tools for analysing gases, which can come from a process as yield yielded or reactant, are commercially available [3] . Among them the gas analyser based on Fourier transform infrared spectrometry (FTIR) has been mostly used [4] . When the gas sample composition is quite complex the gas chromatography (GC), which separates the gaseous components before detection, becomes incumbent. The positioning of analytical instrumentation at plant allows a flexible automation with remote controls. However, the integrity of instrumentation will depend on what extent care is place in preventive maintenance [5] . A representative portion of sample to be processed is the critical step for a proper analyte response [6] . The sampling system design usually comprises sampling lines made of electrically heated PTFE tubes to avoid water condensation, which could cause losses of soluble gases in in-situ humidity [7] . Separation of condensable hydrocarbons, namely TAR, from the coal-derived gas stream is highly desirable to prevent dusty and occlusion of sampling lines. It is allowed by in-line separator through heating filter.
As a part of making progress in fundamental research in the field of CCS technologies, this paper describes the on-line analytical measurement systems projected for the ZECOMIX platform. The system was built based on commercially available analysers, namely, a GC from Agilent and a portable FTIR gas analyser from Gasmet Technologies Oy, Finland. The sampling lines were properly designed and realized. Sampling points located in various parts of the units were identified. As an example the results of testing the fluidized-bed calciner/carbonator unit through CO2 capture on naturally occurring dolomite are presented.
2. Experimental
2.1. Dolomite Material
The bed/sorbent material consisted of dolomite from quarry of Biella (Italy), a locality in the foothills of Alps. The chemical composition was determined by thermogravimetric analysis (TGA/DSC1 Star System, MettlerToledo) [8] . The particle mean diameter of dolomite was derived by laser granulometric method (Malvern Instruments Ltd)). The dolomite purity was more than 97%. Overall results are reported in Table1 Thermogravimetric analysis (TGA) was also used to study the carbonation reaction of dolomite during first cycle under similar operating conditions of carbonator unit.
2.2. Analytical Instrumentations
GC. Agilent 6850 gas chromatograph-TCD detector equipped with two columns connected in series, namely, Molesieve 5A for permanent gases (H2, N2, O2, CO, and CH4) and Hayesep Q for CO2 was used. Quantification was made by GC Chemstation software (Agilent) according to the predefined method. Prochem software by S.R.A. Instruments (Milan, Italy) allowed to communicate with ABB Control and Data Acquisition Systems (SCADA), withdrawn gas sample from different sampling lines according to preset measurement sequence and compute reports created by Chemstation in final mole fraction. Remote control connection was made by VNC software. The GC was calibrated with reference gas (Air Liquid, France) supplied by high pressure cylinders before the start and after the end of carbonation test. The ratio between sample peak area and the bracketing reference peaks is used to calculate gas volume%.
FTIR. Gasmet DX-4000 portable gas analyser, incorporating a low-resolution (4 cm−1) Fourier transform infrared spectrometer and a ZrO2 sensor for accurate O2 measurements, was used. It was equipped with a temperature-controlled gas cell, heated transfer line, and portable heated probe. CALCMET software was used for the identification and quantification of compounds. The instrument was factory calibrated for the determination of species such as H2O (0% - 40% v/v), CO (400 mol ppm), CO2 (0% - 80% v/v), CH4 (200 mol ppm), and O2 with 2% error. IR spectra were also collected and stored on the hard disk of analyser, along with the concentrations information. This allowed checking possible spectral overlapping.
2.3. Sampling Points and Lines
The sampling lines and analytical system was realised by SRA Instruments. It was designed to measure alternately synthetic gas and flue gas from six sampling points (V as the analogous chromatographic vial), located in different parts of the platform, and referred as VN (where N is a number indicating a specific sampling point) according to a predefined sequence. The schematic drawing of calciner/carbonator unit is illustrated in Figure 1. The sampling points V3 and V4 corresponded to the inlet and outlet of carbonator, whereas V5 was the inlet of scrubber unit. The flue gas was transported through sampling lines made of electrically heated lines to Peltier coolers (ECP2000-SS) for water trapping. Trace vapours and aerosols were further removed through universal filters FP-2T (M & C TechGroup). The purified gas was sent to GC using a peristaltic pump. A Filter SP 2000-H (M & C TechGroup) programmable up to 300˚C was inserted between the sampling point V2 located at gasification unit downstream and the heated tube line for eventually TAR removal. An IP55 cabinet was properly realized to accommodate other than GC and PC, flowmeters, pumps, Peltier coolers, and electric cables. Figure 2 shows the picture of IP55 cabinet at open doors.
2.4. Calcination/Carbonation Test
The chamber for calcination/carbonator processes has an internal diameter of 1 m and 4.5 m in height, whereas the walls are coated by a refractory material. The chamber was connected to a primary cyclone. The refractory material was heated to 520˚C by combustion of methane with oxygen in excess through a burner. The exhaust combustion was measured for O2, CO2, CO, and CH4 through V4 sampling point by FTIR. Then the chamber was feed by dolomite at 20 kg/h for five hours and the temperature was brought around 850˚C for calcination reaction. The bubbling bed conditions were initiated by air, or alternatively N2, which contained 30% v/v CO2

Table 1. Chemical composition of dolomite Turin and particle mean diameter.
°Particle mean diameter.
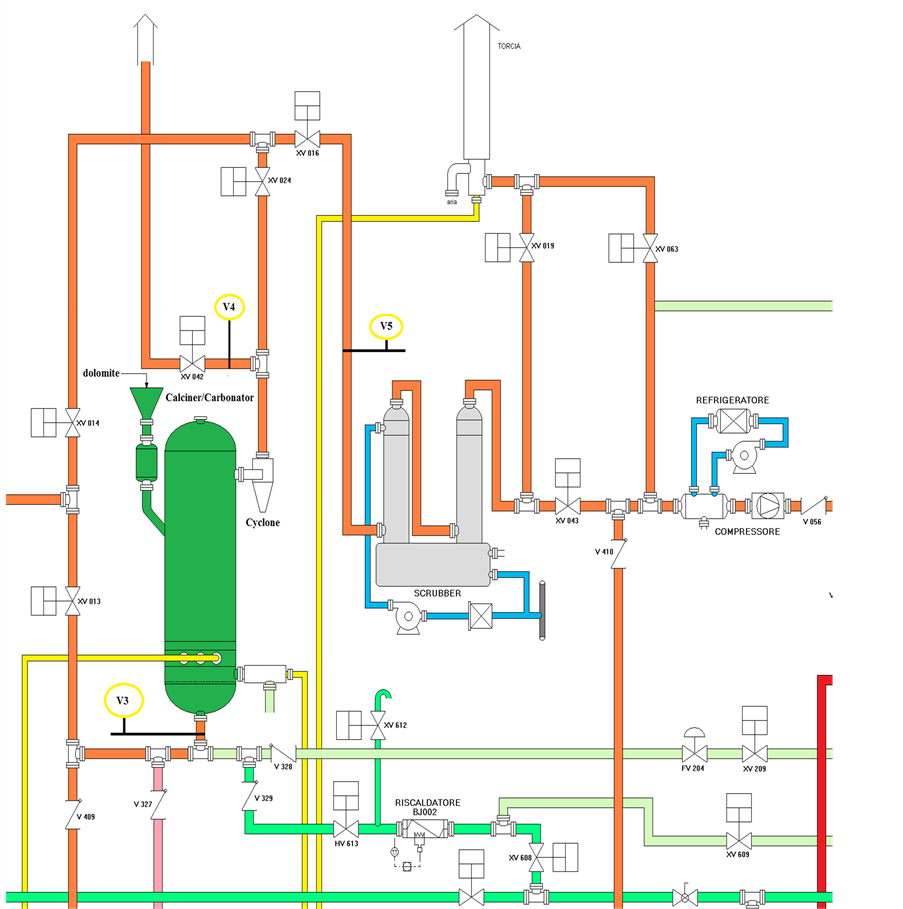
Figure 1. Schematic drawing of calciner/carbonator unit of ZECOMIX plant.
at a gas velocity (Ug) of 5.7 kg∙second−1. After 2 h calcination operation the temperature of fluidized bed was dropped to about 700˚C and CO2 capture was initiated. The flue gas leaving the carbonator passes through the heated inner tube of vial 3. The inlet and outlet lines (V3 and V4 sampling points) of carbonator were analysed occasionally by GC. To obtain parallel FTIR data the inlet of Gasmet DX-4000 analyser was connected through the heated sample probe to the V5 sampling point, which head off the same gas sample than V4.
3. Results and Discussion
The CO2 uptake by means of calcined dolomite, expressed by the equation below:
 (1)
(1)
was followed over time by determining the CO2 and N2 concentrations through GC analysis. The overall chromatographic analysis time took 4 minutes. So, the GC data were quite sparing. The CO2 and N2 content in the outlet stream at sampling point V4 over time is showed in Figure 3. Based on GC results the carbonation reaction
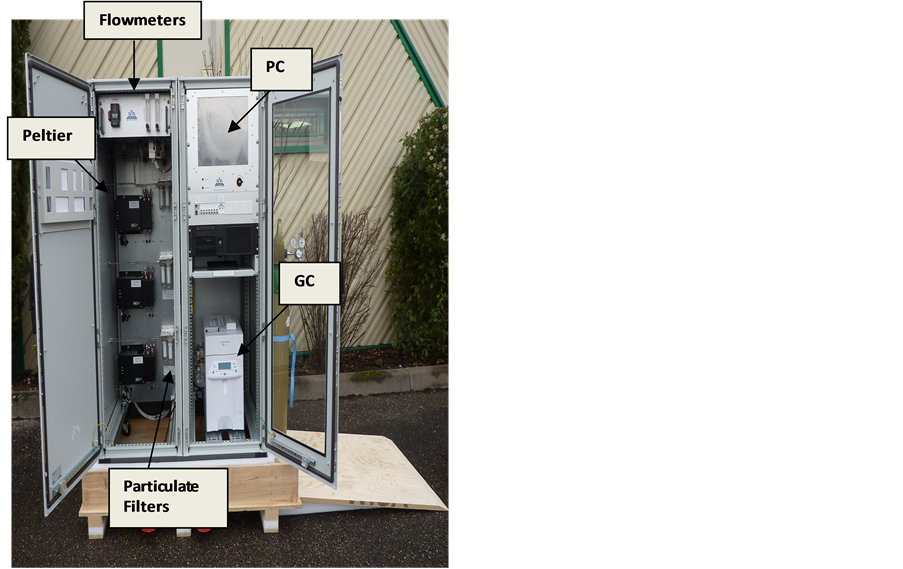
Figure 2. Picture of IP55 Cabinet with inside GC, PC, flowmeters, Peltier coolers, particulate filters.
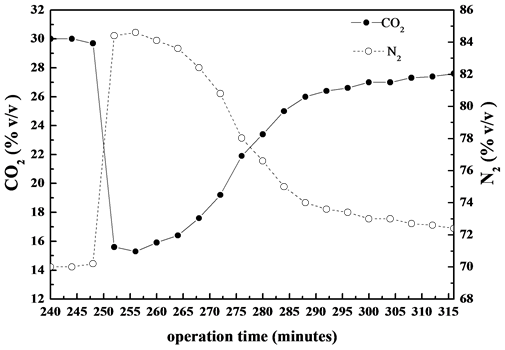
Figure 3. Typical CO2 and N2 trends at outlet carbonator during carbonation reaction under 30% v/v CO2 (N2 balance). Data obtained by on-line GC analysis.
took place just after the switching of air bubbling gas to synthetic reformate gas (30% v/v CO2 in N2) as indicated by the suddenly decrease of CO2 concentration at the outlet of carbonator and simultaneously increase of the concentration of balance N2. At a certain time the CO2 concentration remained quite constant for almost 15 minutes and then went up again to its inlet value.
Due to the slowly response of GC any consideration on kinetic parameters may not be meet. In cases where analytical species present bands well isolated and spectral overlapping is avoided a quickly response can be obtained by FTIR analysis. This allows to monitoring in real time the Reaction (1). The CO2 concentration during carbonation reaction of calcined dolomite was followed over time at 7 seconds intervals.
In Figure 4 is shown the trend of CO2 concentration over time. The breakthrough curve of CO2 absorption on CaO solid particles clearly indicates a homogeneously gas-solid contact in the fluidized-bubbling carbonator. After about 50 minutes the CO2 flow at the outlet of carbonator is essentially equal to that of inlet value.
Conversion vs time curve was derived from above-mentioned breakthrough curve. The conversion of CaO to CaCO3 X, is defined as follows:
 (2)
(2)
where yt(CO2) is the number of CO2 reacting moles at time t and y0(CO2) the number of CO2 moles at the inlet carbonator, whereas yCaO is the number of initial moles of CaO, which is calculated multiplying the mass of dolomite (kg/h) added to carbonator chamber by the mass fraction of CaO (see Table 1) and divided by 56 g moles−1 (molar weight of CaO).
Figure 5 shows the conversion X over time at the first carbonation cycle taking place inside the carbonator chamber. For comparison purposes inset of Figure 5 shows the conversion X of calcined dolomite at the 1st calcination-carbonation cycle obtained in laboratory-tool thermo-gravimetric analyser under 30% v/v CO2. The carbonation conversion was higher than 0.77 showing a good agreement with the value between 0.7 and 0.8 experienced in the first cycle of carbonation reaction for calcined dolomite as reported in literature [9] . Under realistic operating conditions of Zecomix carbonator the carbonation reaction proceeds fast within 50 seconds, being
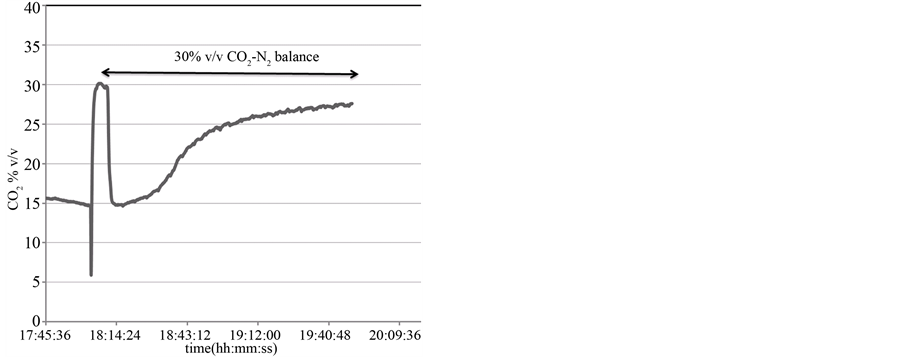
Figure 4. Continuously CO2 monitoring during carbonation reaction under 30% v/v CO2 (N2 balance) by FTIR analysis.
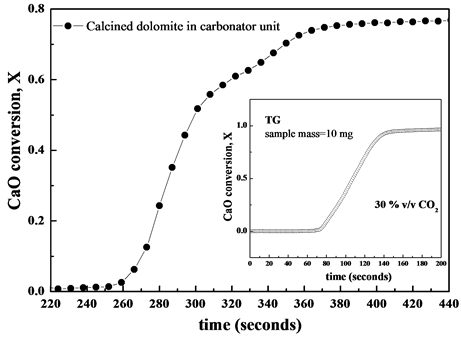
Figure 5. Conversion X over time for calcined dolomite in the carbonator unit (data obtained by FTIR analysis). The inset shows the conversion X of calcined dolomite in TG at first cycle under 30% v/v CO2 (N2 balance).
this stage kinetically controlled, and immediately slows down because of instauration of a diffusion regime due to covered CaO particles with a layer of solid-product CaCO3, which obstacles the access of CO2 gas onto CaO particle surface [10] .
The shrinking core model of Szekely et al., [11] sound right as reaction model to describe the carbonation reaction of fine particles of solid sorbent at the early stage. The kinetic parameters for carbonation reaction can be calculated by fitting the reaction rate equation [11] :
 (3)
(3)
Figure 6 shows the grain-model of reaction time of calcined dolomite during carbonation both in carbonator and in thermo-balance. The linear fittings showed correlation coefficient R2 better than 0.997 in the time range of 30 seconds. The initial intrinsic reaction rate of chemical Reaction (1) is given by the slopes of plots of conversion X against time [12] . The values of slope m were 0.0092 and 0.0057 for dolomite in carbonator and in TG, respectively. It is interesting to note as the data were comparable each other, in spite of the different conditions of reaction, namely, loaded mass in reactor (around 300 kg) vs a typical TG mass (order of magnitude of milligrams); fluidized sorbent particles vs fixed bed; different temperature gradient among other. The initial induction period given from the part of curves with less pronounced slope at the initial stage of Reaction (1) were overlapped as shown in inset of Figure 6 [13] .
In order to survey to what extent dolomite was calcined spent dolomite was collected from carbonator chamber and submitted to TG/DSC analysis. The sample was previously homogenized in an Agate mortar and submitted to heating program of 10˚C∙min−1 up to 950˚C in 100 v/v% N2 atmosphere, kept isothermally for 5 minutes at the final temperature in the same atmosphere and then the temperature was slowed down after switching gas to CO2. The TG/DSC curves are shown in Figure 7.
The endothermic calcination reaction under N2 atmosphere expressed by the following equation:
 (4)
(4)
was approaching the theoretical value, which produces 100% CaO, whereas completely re-carbonation through subsequent exothermic Reaction (1) under CO2 atmosphere was observed. These findings suggested that the degree of calcination of dolomite inside calciner was about 70%.
4. Conclusion
The Italian Zecomix platform was tested through experiment of CO2 capture in the bed-fluidized calciner/carbonator unit. The operating conditions were: bed material made of naturally occurring dolomite from Biella quarry; operation temperature around 700˚C and simulated reformate flue gas containing 30% v/v CO2 as
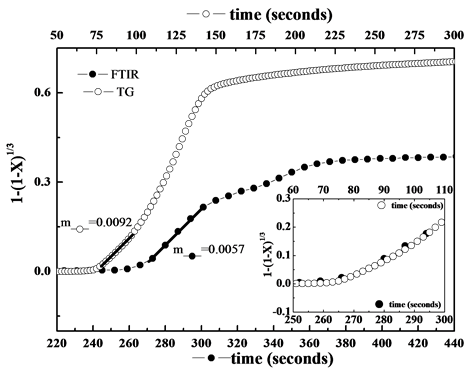
Figure 6. Grain model plots for dolomite under carbonator conditions and in TG analyser. The inset shows the carbonation reaction at initial stage.

Figure 7. TG/DSC curves of spent dolomite in different atmospheres.
fluidizing agent. The sampling lines and analysis system constituted by GC and FTIR was properly designed. Based on GC and FTIR results a CO2 retention better than 70% was achieved. The FTIR data allowed entering in insight of the kinetics. The conclusions established from the results obtained in pilot-scale carbonator confirmed that obtained at laboratory-scale level by TGA.
Acknowledgements
This work was funded by the Ministero dello Sviluppo Economico (Italy) within the Ricerca del Sistema (RdS) Elettrico Programme.
References
- Calabrò, A., Deiana, P., Fiorini, P., Girardi, G. and Stendardo, S. (2008) Possible Optimal Configurations for the ZECOMIX High Efficiency Hydrogen and Power Plant. Energy, 33, 952-962. http://dx.doi.org/10.1016/j.energy.2008.01.004
- Workman, J., Veltkamp, D.J., Doherty, S., Anderson, B.B., Creasy, K.E., Koch, M., Tatera, J.F., Robinson, A.L., Bond, L., Burgess, L.W., Bokerman, G.N., Ullman, A.H., Darsey, G.P., Mozayeni, F., Bamberger, J.A. and Stautberg Greenwood, M. (1999) Process Analytical Chemistry. Analytical Chemistry, 71, 121R-180R. http://dx.doi.org/10.1021/a1990007s
- Gurden, S.P., Westerhuis, J.A. and Smilde, A.K. (2002) Monitoring of Batch Processes Using Spectroscopy. AIChE Journal, 48, 2283-2297. http://dx.doi.org/10.1002/aic.690481018
- McKelvy, M.L., Britt, T.R., Davis, B.L., Gillie, J.K., Graves, F.B. and Lentz, L.A. (1998) Infrared Spectroscopy. Analytical Chemistry, 70, 119R-177R. http://dx.doi.org/10.1021/a1980006k
- Cleaver, K.D. (2001) The Analysis of Process Gases: A Review. Accreditation Quality Assurance, 6, 8-15.http://dx.doi.org/10.1007/s007690000179
- van den Berg, F.W.J., Hoefsloot, H.C.J. and Smilde, A.K. (2002) Selection of Process Analyzers for Plant-Wide Monitoring. Analytical Chemistry, 74, 3105-3111. http://dx.doi.org/10.1021/ac020148w
- Workman, J., Creasy, K.E., Doherty, S., Bond, L., Koch, M., Ullman, A. and Veltkamp, D.J. (2001) Process Analytical Hemistry. Analytical Chemistry, 73, 2705-2718. http://dx.doi.org/10.1021/ac010364p
- Samtani, E.M., Dollimore, D. and Alexander, K. (2001) Thermal Decomposition of Dolomite in an Atmosphere of Carbon Dioxide. The Effect of Procedural Variables in Thermal Analysis. Journal of Thermal Analysis and Calorimetry, 65, 93-101. http://dx.doi.org/10.1023/A:1011572401137
- Bhatia, S.K. and Perlmutter, D.D. (1983) Effect of the Product Layer on the Kinetics of the CO2 Lime Reaction. AIChE Journal, 29, 79-86. http://dx.doi.org/10.1002/aic.690290111
- Barker, R. (1973) Reversibility of Reaction CaCO3 = CaO + CO2. Journal of Applied Chemistry Biotechnology, 23, 773-742.
- Szekely, J., Evans, J.W. and Sohn, H.Y. (1976) Gas-Solid Reactions. Academic Press, New York.
- Szekely, J. and Propster, M. (1975) A Structural Model for Gas-Solid Reactions with a Moving Boundary-VI. Chemical Engineering Science, 30, 1049-1055. http://dx.doi.org/10.1016/0009-2509(75)87006-0
- Sun, P., Grace, J.R., Lim, J. and Anthony, E.J. (2008) Determination of Intrinsic Rate Constants of the CaO-CO2 Reaction. Chemical Engineering Science, 63, 47-56. http://dx.doi.org/10.1016/j.ces.2007.08.055
NOTES

*Corresponding author.