Open Journal of Epidemiology
Vol.3 No.1(2013), Article ID:27889,8 pages DOI:10.4236/ojepi.2013.31002
The relationship between physical activity, body mass index, and academic performance and college-age students*
![]()
1University of Nebraska Medical Center, Omaha, USA
2Department of Epidemiology and Biostatistics, School of Public Health-Bloomington, Indiana University, Bloomington, USA
3School of Health Sciences, College of Health Sciences, Walden University, Minneapolis, USA
Email: dfranz@unmc.edu, #sferesu@indiana.edu
Received 11 December 2012; revised 11 January 2013; accepted 21 January 2013
Keywords: Physical Activity; BMI; Overweight; Academic Performance; GPA; ACT
ABSTRACT
Background: The purpose of this study was to determine if a relationship exists between physical activity or Body Mass Index (BMI) and academic performance in college-age students. Both physical activity and BMI have shown to impact academic performance in younger students, but data for college-age students is limited. Methods: Between October and December 2006, data were collected from 98 biochemistry students at the University of Nebraska-Lincoln. Analysis was performed on 77 students who had complete outcome data. Physical activity measures were categorized to reflect those who met and those who did not meet the Centers for Disease Control and Prevention (CDC) and American College of Sports Medicine (ACSM) recommendations for physical activity [1]. BMI was calculated from each student’s height and weight recordings. Academic performance was determined by each student’s cumulative college Grade Point Average (GPA) and score on the ACT examination. The means were compared using test for two groups and general linear models. Where statistically significant results existed, groups were compared using the Tukey multi-test procedure. A onesample comparison of means was conducted for fitness between our sample and the age-matched American population as stated by the Healthy People 2010 Report [1]. Results: Students in the normal BMI category had significantly higher GPA and ACT scores than students in the overweight category. Juniors had significantly higher GPA and ACT scores than seniors. Our findings did not differ between our sample and the American population with regards to recommendations for fitness by the CDC and ACSM. Conclusions This study demonstrated that normal weight individuals, had higher GPA and ACT scores than their overweight counterparts, underscoring the need to intensify interventions focused on reducing and preventing obesity among school-age populace.
1. INTRODUCTION
With the growing obesity epidemic in the United States, physical activity has become a topic of great interest to researchers. The literature has demonstrated that regardless of age, ethnicity, or present state of health, virtually all individuals will benefit from regular physical activity [1]. In fact, the advantages of engaging in regular physical activity with regards to physical and mental health are tantamount. Regular, moderate physical activity is associated with a substantial decrease in all-cause mortality, a lesser risk of ischemic heart disease, obesity, hyperlipidemia, hypercholesterolemia, hypertension, cerebral vascular disease, type 2 diabetes, the metabolic syndrome, and a reduced reactivity to stress [2,3]. Also, a review of the literature by Calfas et al., 1994, shows improvements in self esteem, self-concept, and depressive/anxiety symptoms [4]. Additionally, regular physical activity has been shown to improve muscle function, cardiovascular function and physical performance [1].
Researchers have focused on several links between mind and body that may aid learning. Some postulate that increased academic achievement may be due to an increase in neurotransmitters related to exercise, such as serotonin [5]. Other potential mechanisms which may aid learning include: accelerated psychomotor development, increased cerebral blood flow, heightened arousal, changes in hormone levels, changes in body build, and increased self esteem [3,6]. A review of adult studies conducted by Sallis, J.F. et al., 1999, found that physical activity was associated with selected advantages in cognitive function, specifically: math, acuity, and reaction time [7]. Whatever the mechanism, it is clear that regular physical activity poses no harm and may be associated with better academic performance.
Despite the known benefits, only 25% of American adults engage in physical activity required for health benefit, and only 15% reach levels required for improvement or maintenance of physical fitness. Alarmingly, 29% of adults engage in no leisure time physical activity at all [8,9]. In line with these statistics, and the documented benefits of physical activity, promoting physical activity is now a major health concern [10]. To respond, the Centers for Disease Control and Prevention (CDC) and the American College of Sports Medicine (ACSM) have made, and are actively promoting, physical activity recommendations for the general population [1,9].
Unfortunately, the CDC and ACSM have met strong opposition in implementing these recommendations in school-age children [7]. This is especially troubling considering that physical inactivity in the adolescence has been shown, to either perpetuate or initiate the development of obesity into adulthood [11]. Alternatively, a physically active lifestyle developed early in life may continue into adulthood [1]. Unfortunately, it has also been shown that physical activity rates decline consistently during the adolescent years in previous studies [12,13] and that the number of physically active students declines by about 50% between the ages of 10 and 18 years.
The opposition to the CDC and ACSM recommendations comes from local school leaders and stakeholders. Administrators fear that hours wasted on required physical education courses may jeopardize a child’s overall academic performance [3,13]. The reality, fortunately, is quite the opposite. No clear evidence has been published indicating significant harm posed on academic performance due to increased time devoted to physical education for elementary, middle, or high school-age students [14].
Conversely, there is limited literature exploring this phenomenon in college-age students. This may be due to a variety of factors inhibiting the feasibility of any such study, including: a highly variable population, differences in course background, compliance, funding, and applicability. The CDC has put little effort or funding in this age bracket due in part to insufficient evidence supporting health education courses for college-age students [8]. As one may expect, there is limited data supporting or refuting an association between physical activity or Body Mass Index (BMI) and academic performance in this age group. Therefore, the main objective of this study was to determine the relationship between physical activity and/or BMI and academic performance in college-age students.
2. METHODS
2.1. Data Collection
A short demographic questionnaire was distributed to research volunteers from a senior-level biochemistry course (BIOS 431) at the University of Nebraska in Lincoln. The questionnaire assessed: sex, age (in years), height (in inches, later converted to meters by multiplying the recorded value by 0.0254) and weight (in pounds, later converted to kilograms by multiplying the recorded value by 0.454) to calculate BMI (kg/m²). Grade was defined as junior, senior, or graduate student and major as biological sciences or other. Cumulative college Grade Point Average (GPA) was scored between 0 and 4.0, ACT scores were between 1 and 36. Frequency of exercise was on a scale of 0 to 7 days per week, duration of exercise session was categorized in 20 minute ranges (0 - 20, 20 - 40, 40 - 60, and 60+ minutes per session), and intensity by Rating of Perceived Exertion (RPE) with a range of 6 to 20 as determined by the Borg RPE scale. The Borg scale was used to measure intensity because it is a measure of exertion that allows all individuals to subjectively rate the intensity of physical effort relative to the individual’s physical fitness [15]. The scale correlates with heart rate, blood lactate, and oxygen consumption [9]. Completed surveys were collected by the primary investigator and entered into Microsoft Office Excel 2003. Of the 98 students who took part in this study, 77 had complete outcome, which was thus used for this analysis. All participants were given and signed an informed consent form approved by the University of Nebraska Institutional Review Board.
2.2. Measures
The CDC and ACSM have published qualifications for physical activity adequate for maintaining a healthy lifestyle [1,9]. The three factors imperative to determining adequate physical activity as defined by the CDC and ACSM are: duration, frequency, and intensity of activity. An individual may meet these qualifications in one of two ways. By the new criterion (Fitness 1), presented in the CDC’s Healthy People 2010 report, a person must engage in vigorous-intensity physical activity for at least 20 minutes per day on 3 or more days per week (vigorous-intensity physical activity is defined as a perceived exertion of 15 or more on the Borg RPE scale; equivalent to the effort put forth in a jog or by swimming several laps). Alternatively, the old criterion (Fitness 2) may be met by engaging in moderate-intensity physical activity for about 30 minutes per day on 5 or more days per week (moderate-intensity is defined by a perceived exertion of 11 - 14 on the Borg scale, roughly equivalent to a brisk walk or a flat-terrain bike ride) [1,9]. We grouped together students who met either Fitness 1 or Fitness 2 criteria into a third category, Fitness 3, essentially separating those students who met the CDC and ACSM recommendations from those who did not.
2.3. Academic Performance
Academic performance was compared among individuals by recording their cumulative GPA (0 - 4.0) and ACT (1 - 36). In addition, information on majors and grade level were collected to check for significance of curriculum difficulty as a confounding factor. Information on age was also collected because it has been shown to be associated with BMI [16]. Additionally, there is evidence supporting a relationship between non-traditional students (age 25 or older) and GPA [17].
2.4. Comparisons
In order to determine what factors affected the students’ GPA or ACT scores we compared the means of sex, age, grade, BMI, major, duration, frequency, intensity, Fitness 1, Fitness 2, and Fitness 3 to GPA and ACT. The outcomes of interest were GPA, ACT, BMI, and fitness. Categorization for fitness used the CDC/ACSM criteria [1,9]. The Fitness 1 group met all of the following qualifications: a frequency ≥3 days per week, an intensity ≥15, and a duration of exercise ≥20 - 40 minutes per session. The Fitness 2 group met the alternative qualifications: a frequency ≥5 days per week, an intensity ≥11, and a duration of exercise ≥20 - 40 minutes per session. BMI was categorized into 3 groups based upon the normal standards: normal weight (≥18.5 - <25 kg/m2), overweight (≥25 - <30 kg/m2), and obese (≥30 kg/m2). There were no students who were underweight (<18.5 kg/m2) in this population.
2.5. Statistical Analysis
Data was entered into Microsoft excel, and preliminary analysis was done with, SPSS version 14 database (SPSS Inc., Chicago IL). Data was then analyzed using SAS version 9.1 (SAS, Cary NC). The means and standard deviations were calculated for continuous variables, including: age, height, weight, BMI, frequency, intensity, GPA, and ACT. Frequency distributions were calculated for categorical variables. The mean distribution of GPA and ACT by: sex, age, BMI, grade, major, duration, and fitness were also calculated. The means were compared using test for two groups, and general linear models (GLM). Where statistically significant results existed, groups were compared using the Tukey multi-test procedure. Finally, a one-sample comparison of means was conducted for Fitness 1 and Fitness 2 against age-matched categories and the total adult population as stated by the Healthy People 2010 report (CDC, 2000). Data for Fitness 3 was unavailable for comparison.
3. RESULTS
3.1. Distribution of Social Demographic Characteristics
Table 1 presents the means and standard deviations (SD) of continuous variables for these 77 students. The mean age for the population was 21.7 years (SD = 2.5), mean height 1.7 meters (SD = 0.1), mean weight 72.1 kg (SD = 18.1), and the mean BMI was 24.1 kg/m² (SD = 4.4). The average frequency was 2.9 days/week (SD = 1.7) and the mean intensity score was 13.2 (SD = 2.8). The mean GPA was 3.6 (SD = 0.3) and the mean ACT score was 28.7 (SD = 3.1).
The Distribution demographic characteristics and physical activity indices are shown in Table 2. There were a slightly larger number of females, 45, compared to males, 32. Most of the students (92.2%) were aged between 17 and 24 years. When BMI was categorized into three groups, the majority of the students (61%) were of normal weight, nearly 30% were overweight, and only 9.1% were obese. The majority of the class (58.4%) was made up of seniors (grade 16), 37.7% were juniors (grade 15), and only 3.9% were graduate students (grade 17). Most of the students had a major in the biological sciences (80.5%). Notably, 77.9% of the students met the qualification for duration (≥20 minutes), 53.2% met the minimum standard for frequency (participating in physical activity ≥ 3 times per week), and a vast majority (85.7%), of the students, met the minimum requirement for intensity (≥11). Fitness 1 criterion was met by 29.9% of the students, Fitness 2 criterion was met by 16.9% of the students, and Fitness 3 criterion (the union of Fitness 1 and Fitness 2) was met by 33.8% of the students.
3.2. Relationship between GPA, ACT and Socio-Demographic Characteristics
No significant correlations were demonstrated between GPA and BMI or age or between ACT and BMI or age (Table 3). Positive relationships between GPA and ACT and between BMI and age were demonstrated. The Pear-
Table 1. Distribution of continuous variables for 77 students from university of Nebraska-Lincoln November, 2006.
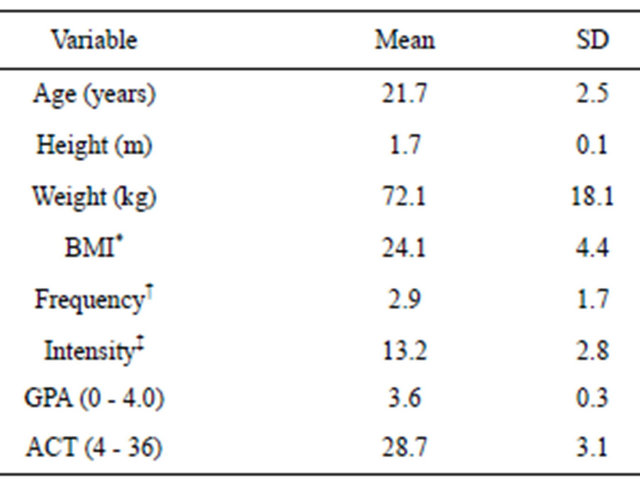
*BMI was calculated as weight (in kg)/height (in meters²). †Frequency denotes the number of times per week the individual participates in physical activity. ‡Intensity denotes indicated measure of intensity on Borg RPE scale.
Table 2. Distribution demographic characteristics and physical activity indices for the 77 students.
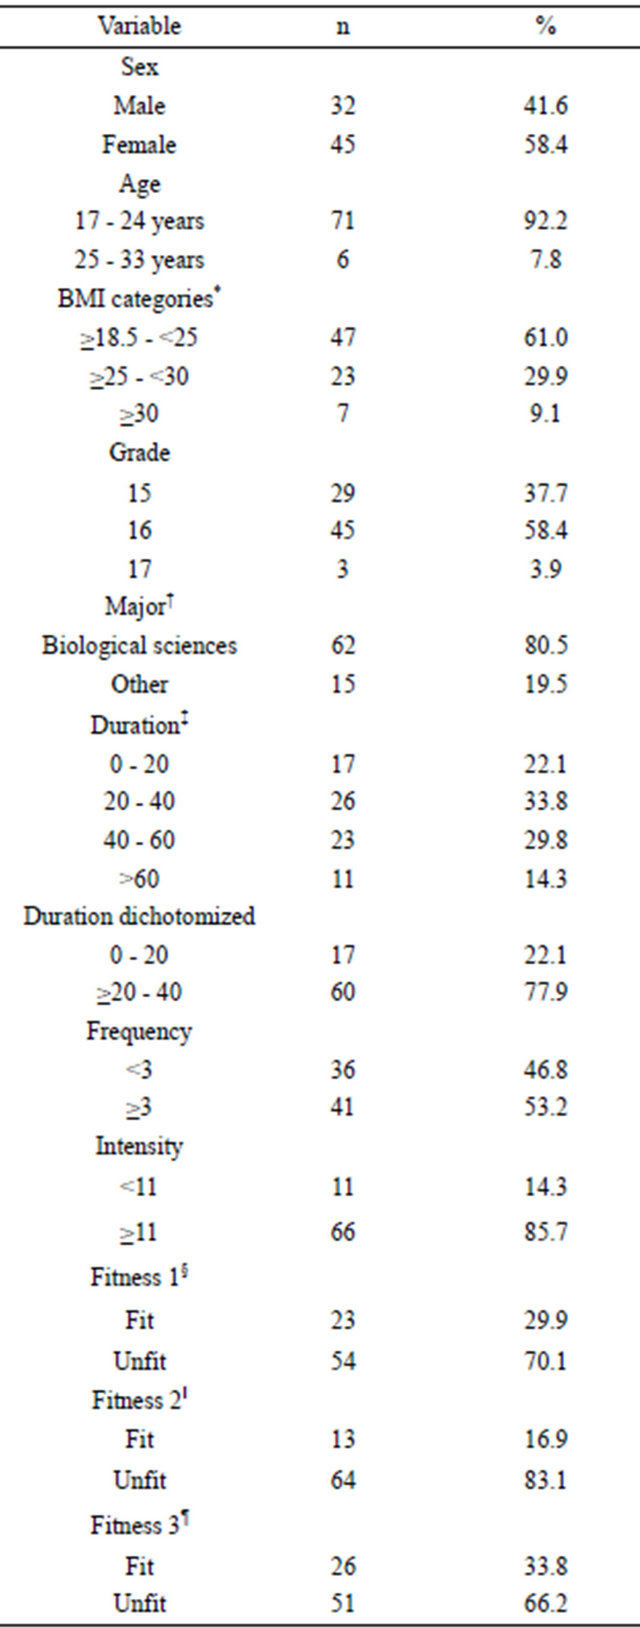
*BMI of ≥18.5 - <25 is normal, ≥25 - <30 is overweight, and ≥30 is obese (there was no one underweight, <18.5). †Biological Sciences included the following majors: biology, biochemistry, psychology, biomedical science, veterinary science, animal science, and insect science. Other included: mathematics, nutrition, textiles, clothing, and design, business, English, spanish, anthropology, agronomy, environmental studies, engineering, and chemistry. ‡Duration refers to the number of minutes the individual engages in activity per session. §Fitness 1 was categorized as having a duration ≥20 - 40 minutes per session, a frequency ≥3 days per week, and an intensity ≥15. ‖Fitness 2 was categorized as having a duration ≥20 - 40 minutes per session, a frequency ≥5 days per week, and an intensity ≥11. ¶Fitness 3 includes students meeting either the criteria for Fitness 1 or the criteria for Fitness 2.
son Coefficient between GPA and ACT was 0.66 with a p-value < 0.0001. The Pearson Coefficient between BMI and age was 0.32 with a p-value = 0.0048.
There was no mean differences for GPA or ACT by sex, age, BMI, major, duration, duration dichotomized, frequency, intensity, Fitness 1, Fitness 2, or Fitness 3 (Table 4). However, when we categorized BMI into three categories: normal weight (≥18.5 - <25 kg/m²), overweight (≥25 - <30 kg/m²), and obese (≥30 kg/m²), students in the normal category had significantly better GPA and ACT scores than the overweight category (mean differences for GPA of 0.24 (p < 0.01) and a mean differences for ACT of 2.4 (p < 0.008)). There was also a statistically significant mean differences in GPA and ACT for grades 15 (juniors) and 16 (seniors). The GPA mean differences was 0.227 (p < 0.01) and ACT mean differences was 1.917 (p < 0.02), with juniors demonstrating higher scores in both categories.
3.3. Comparison of a Sample of Fitness to American Population
Finally, the one-sample comparison of means showed no evidence of significant differences for the mean relative proportion of students in our sample meeting Fitness 1 and Fitness 2 criteria, 29.9% and 16.9% respectively, and that of the adult American population, 23% and 15%, respectively (Table 5). When the same test was done comparing our sample to age brackets closely matching our population that were reported by the CDC (18 - 24 years and 25 - 44 years), no statistical differences were observed. Data for Fitness 3 criterion was not contained in this report (CDC, 2000).
4. DISCUSSION
There were three main findings from this study. First, students in the normal BMI category (≥18.5 kg/m2 - <25
Table 3. Correlations between age, BMI and GPA and ACT for the 77 students.
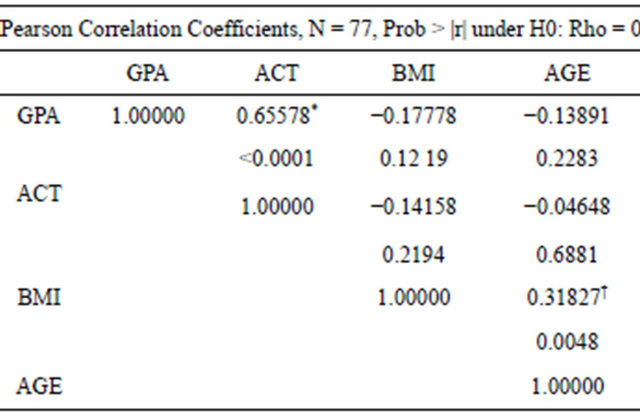
*GPA is correlated to ACT, Pearson Coefficient = 0.66, p-value < 0.0001. †BMI is correlated to Age, Pearson Coefficient = 0.32, p-value = 0.0048.
Table 4. Distribution of demographic characteristics by GPA and ACT for the 77 students.
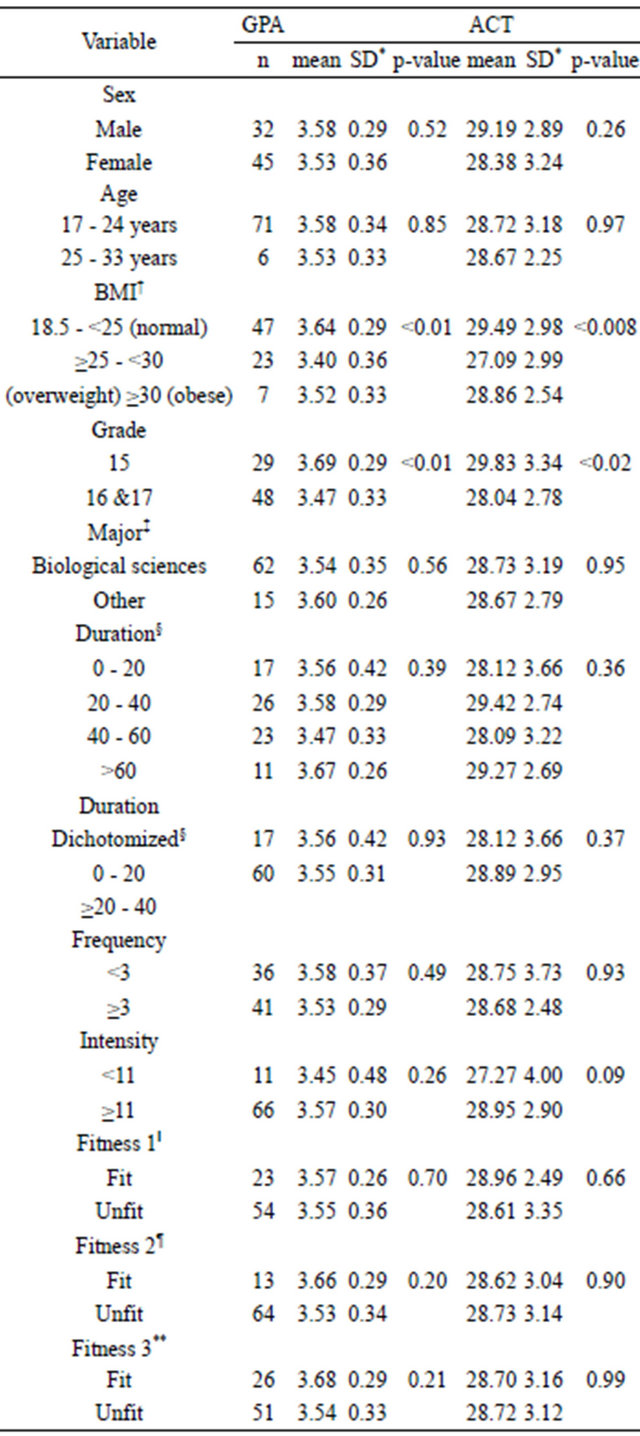
*SD = standard deviation. †BMI of ≥18.5 - <25 is normal, ≥25 - <30 is overweight, and ≥30 is obese (there was no one underweight, <18.5). ‡Biological Sciences included the following majors: biology, biochemistry, psychology, biomedical science, veterinary science, animal science, and insect science. Other included: mathematics, nutrition, textiles, clothing, and design, business, English, Spanish, anthropology, agronomy, environmental studies, engineering, and chemistry. §Duration refers to the number of minutes the individual engages in activity per session. ‖Fitness 1 was categorized as having a duration ≥20 - 40 minutes per session, a frequency ≥3 days per week, and an intensity ≥15. ¶Fitness 2 was categorized as having a duration ≥20 - 40 minutes per session, a frequency ≥5 days per week, and an intensity ≥11. **Fitness 3 includes students meeting either the criteria for Fitness 1 or the criteria for Fitness 2.
Table 5. CDC/ACSM fitness standards compared to the proportion of the American population by age.
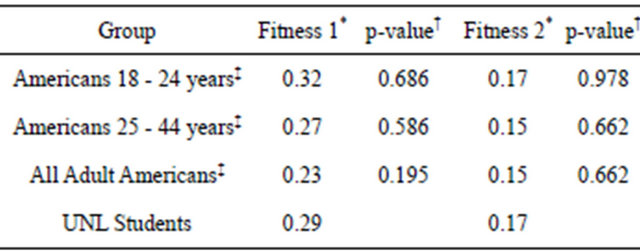
*Proportion of individuals meeting criterion. †p-value determined by onesample comparison of means. ‡Age brackets represent those reported in the Healthy People 2010 Report (CDC, 2000). §Data for Fitness 3 was not available from the Healthy People 2010 Report (CDC, 2000).
kg/m2) had significantly better GPAs and ACT scores than students in the overweight category (≥25 kg/m2 - <30 kg/m2), indicating better academic performance. Second, junior students had better GPAs and ACT scores. Third, in terms of fitness our student population, was a valid representation of both the age-matched and the total adult American population, as reported by the Healthy People 2010 report [1], indicating that it is possible to conduct studies of this nature on college students despite all the accompanying difficulties in measuring this population. Also, as expected, there was a positive association between BMI and age, as this is a well demonstrated phenomenon [16].
The mean differences of 0.24 for GPA and 2.4 for ACT scores between higher-achieving normal and lowerachieving overweight students, was a very interesting finding. What this data suggests is that, individuals who are in the normal body weight category, have a greater opportunity for academic success, as defined by GPA and ACT scores, than individuals in the overweight category. This finding supports several recent studies showing a similar relationship in school-age children. In a study of young adolescents (grades 7 - 9), it was shown that an increase in BMI was associated with a greater risk of having a low mean GPA [18]. Another study by demonstrated a significant decrease in scholastic achievement by overweight middle school students [19]. Further studies confirm that overweight children have lower grades and, as expected, lower levels of physical activity than their normal weight peers [19-22]. However, no other study in the literature linking BMI to academic success in college students has been reported.
There were no statistically significant differences in the mean GPA or ACT scores of students in groups Fitness 1, Fitness 2, or their union, Fitness 3. This finding was unexpected. We hypothesized that the results in college-age students would be similar to those shown in high school-age and younger students. Numerous studies have shown positive relationships between academic performance and physical activity in elementary, middle, and high school students [3,7,13,14]. In addition, students who participate in physical activity have lower incidences of depression, frequency of cigarette use, better dietary practices, stress management and relations with parents [4,5,13]. Further, a recent study has shown a positive relationship between working memory capacity and level of physical activity in young adults [6]. This would be of likely benefit for the physically active college student.
Also, it is well established that reduced physical activity is a potentially important risk factor for the onset of overweight and obesity as reported by previous studies [10-11,21,24-26]. In a recent study, Sharpe, P.A. et al. (2004) reported that overweight and obese populations may be only 33% - 50% as likely to be meeting the CDC and ACSM requirements for physical activity necessary to maintain a healthy lifestyle compared to the normal and underweight population [25]. Thus, the expectation was that a relationship between BMI and GPA or ACT, would coexist with a relationship between physical activity and GPA/ACT, was not evident in our study, probably due a small sample size.
The significant relationship between grade level and GPA seems difficult to explain because one may expect older students to have greater academic maturity, and thus, higher GPA [17]. However, it is logical to suggest that juniors who take a rigorous senior level course a year early may show, on the average, greater academic prowess. Also, as expected, ACT and GPA demonstrated a positive relationship in this intelligent class as reported by a previous study [27]. Thus, it is no surprise that the class with the higher ACT scores, had also the higher GPA.
Finally, the seemingly subtle finding that our sample showed no evidence of difference from the age-matched and the total adult American population in terms of the proportion of individuals meeting the CDC and ACSM fitness standards is extremely important. There are many confounding factors that may have prevented previous studies to demonstrate our findings; most notably, the presupposition that it would be impossible to gather a representative sample in such a variable population. Yet, we have shown that this may not be the case, and that replicate studies could be conducted on a larger scale for consistency.
It is apparent that we are in the midst of what may just be the beginning of a protracted fight against obesity and, sadly, this epidemic seems to be worsening with the average American gaining 0.45 - 0.90 kg per year [24]. Additionally, a sedentary lifestyle is an important risk factor for the development of obesity as reported by other studies [10-11,23-26]. Further, the evidence suggests that the transition from adolescence to adulthood may be especially important as the amount of habitual physical activity decreases significantly during this time [29]. Research has revealed many influential determinants of physical activity, with specific attitudes and beliefs being associated with a lack of physical activity [31]. Several studies have concluded that “not having enough time” is the most important barrier for not participating in physical activity [12].
Strengths and Limitations
One major limitation of this study was the small sample size, diminishing power to detect differences among groups. If numbers had been larger for all fitness groups and BMI categories, more significant results could have been possible, as would for relationships between obese students and GPA and ACT. Secondly, as with any crosssectional studies, reported values may be a snap shot and not represent the full experience of this population. Caution should be taken when interpreting our findings, since it is well established that, individuals tend to over-report their height and under-report their weight, causing misclassification of BMI status, by 22% in males and 18% in females [25]. Additionally, individuals tend to over-report their physical activity [28]. This tendency is most prevalent in the overweight persons [21,29], and this could have affected our results. Another consideration to take into account is that the mean ACT score of this class (28.7) is well above the national average of all test-takers in 2004, 20.9, (when most students probably took the exam) indicating a selective intelligent group [30]. Also, the class reported an average BMI of 24.1, is also unusually low for Americans in this age group (the average BMI for Americans 20 - 29 years old is 26.6) [16]. Yet, one may find it interesting to note that our group had above-average mean GPA and ACT scores coinciding with a below-average mean BMI.
Nonetheless, a notable strength of our study was the cost-efficiency, all student volunteers participated in the study without reimbursement or merit. Another strength of this study was that we were able to find a student population with a statistically insignificant variance in academic background and in conjunction with a wide variability in age, BMI and fitness indices as well as a fairly equal distribution between males and females. This eliminated many potentially confounding factors inherent in the college population, making our results more meaningful. Additionally, the trends in our data tend to reflect those of studies on other samples in the literature, giving the results further validity. Finally, our study is the first to demonstrate a relationship between BMI and academic performance in college-age students.
5. CONCLUSIONS
In order to convince the population to engage in physical activity beneficial for its health, there is a need to change attitudes. Most importantly, we must demonstrate convincingly that time devoted to physical activity is not time wasted.
Research showed beneficial relationships to active lifestyles may be pivotal for future, health-related actions. Albeit, this study, is among the first in attempting to determine the relationship between physical activity and BMI and academic performance in college-age students. It is hoped that this study will serve as a probe for future, more exhaustive studies on this subject so that their results may give the CDC the evidence it needs to distribute the necessary resources to this endeavour.
6. AUTHORS’ CONTRIBUTIONS
Please see sample text in the instructions for authors. DF; planned the study, participated in its design and coordination; SF & DF; participated in its design and coordination and writing the article; SF & DF; performed statistical analysis, DF; collected data and literature. All authors read and approved the final manuscript.
7. ACKNOWLEDGEMENTS
This study originated from work done for an honors thesis at the University of Nebraska in Lincoln in 2006. We would like to thank Dr. Joseph Baryki, Associate Professor of Biochemistry, and Dr. Melanie Simpson, Associate Professor of Biochemistry at the University of Nebraska in Lincoln, for generously granting us permission to use their class for research purposes. We would also like to thank Dr. Jay Noren, then Provost at the University of Nebraska in Lincoln, and now President of Wayne State University in Michigan, for his guidance in the initial formulation of this project.
REFERENCES
- Centers for Disease Control and Prevention (2011) Physical activity and fitness. Healthy people 2020: Physical activity. http://healthypeople.gov/2020/topicsobjectives2020/overview.aspx?topicid=33
- Kim, J., Must, A., Fitzmaurice, G.M., Gillman, M.W., Chomitz, V., Kramer, E., McGowan, R. and Peterson, K.E. (2005) Relationship of physical fitness to prevalence and incidence of overweight among schoolchildren. Obesity Research, 13, 1246-1254. doi:10.1038/oby.2005.148
- Shephard, R.J. (1997) Curricular physical activity and academic performance. Pediatric Exercise Science, 9, 113- 126.
- Calfas, K.J. and Taylor, W.C. (1999) Effects of physical activity on psychological variables in adolescents. Pediatric Exercise Science, 6, 406-423.
- Field, T., Diego, M. and Sanders, C.E. (2001) Exercise is positively related to adolescents’ relationships and academics. Adolescence, 36, 105-110.
- Lambourne, K. (2006) The relationship between working memory capacity and physical activity rates in young adults. Journal of Sports Science and Medicine, 5, 149- 153.
- Sallis, J.F., McKenzie, T.L., Kolody, B., Lewis, M., Marshal, S. and Rosengard, P. (1990) Effects of health-related physical education on academic achievement: Project SPARK. Research Quarterly for Exercise and Sport, 70, 127-134.
- Task Force on Community Preventive Services (2000) Recommendations to increase physical activity in communities. HSTAT: Guide to clinical preventive services. 3rd Edition, Recommendations and Systematic Evidence Reviews, Guide to Community Preventive Services. http://www.ncbi.nlm.nih.gov/books/bv.fcgi?call=bv.View..ShowSection&rid=hstat3
- Pollock, M.L., Gaesser, G.A., Butcher, J.D., Despres, J.-P., Dishman, R.K., Franklin, B.A. and Garber, C.E. (1998) ACSM position stand: The recommended quantity and quality of exercise for developing and maintaining cardiorespiratory and muscular fitness, and flexibility in healthy adults. Med and Science in Sports and Exercise, 30, 975-991. doi:10.1097/00005768-199806000-00032
- Bernstein, M.S., Costanza, M.C. and Morabia, A. (2004) Association of physical activity intensity levels with overweight and obesity in a population-based sample of adults. Preventive Medicine, 38, 94-104. doi:10.1016/j.ypmed.2003.09.032
- Pietilӓinen, K.H., Kaprio, J., Borg, P., Plasqui, G., YkiJärvinen, H., Kujala, U.M., Rose, R.J., Westerterp, K.R. and Rissanen, A. (2007) Physical inactivity and obesity: A vicious circle. Obesity, 16, 409-414.
- Daskapan, A., Tuzun, E.H. and Eker, L. (2006) Perceived barriers to physical activity in university students. Journal of Sports Science and Medicine, 5, 615-620.
- Symons, C.W. and Cinelli, B. (1997) Bridging student health risks and academic achievement through comprehensive school health programs. Journal of School Health, 67, 220-227.
- Coe, D.P., Pivarnik, J.M., Womack, C.J., Reeves, M.J. and Malina, R.M. (2006) Effect of physical education and activity levels on academic achievement in children. Medicine & Science in Sports & Exercise, 38, 1515-1519.
- Borg, G.A.V. (1982) Psychophysical bases of perceived exertion. Medicine & Science in Sports & Exercise, 14, 377-381.
- Ogden, C.L., Fryar, C.D., Carroll, M.D. and Flegal, K.M. (2004) Mean body weight, height, and body mass index, United States 1960-2002. www.cdc.gov/nchs/data/ad/ad347.pdf
- Spitzer, T. (2000) Predictors of college success: A comparison of traditional and nontraditional age students. NASPA Journal, 38, 82-98.
- Mo Suwan, L., Lebel, L., Puetpaiboon, A. and Junjana, C. (1999) School performance and weight status of children and young adolescents in a transitional society in Thailand. International Journal of Obesity, 23, 272-277. doi:10.1038/sj.ijo.0800808
- Shore, S.M., Sachs, M.L., Lidicker, J.R., Brett, S.N., Wright, A.R. and Libonati, J.R. (2008) Decreased scholastic achievement in overweight middle school students. Obesity, 16, 1535-1538. doi:10.1038/oby.2008.254
- Levin, S., Lowry, R., Brown, D.R. and Dietz, W.H. (2003) Physical activity and body mass index among US adolescents: Youth risk behavior survey. Archives of Pediatrics & Adolescent Medicine, 157, 816-820. doi:10.1001/archpedi.157.8.816
- Vogels, N., Westerterp, K.R., Posthumus, D.L.A., Rutters, F. and Westerterp-Plantenga, M.S. (2007) Daily physical activity counts vs structured activity counts in lean and overweight Dutch children. Physiology and Behavior, 92, 611-616.
- Ekelund, U., Åman, J., Yngve, A., Renman, C., Westerterp, K. and Sjöström, M. (2002) Physical activity but not energy expenditure is reduced in obese adolescents: A case-control study. American Journal of Clinical Nutrition, 76, 935-941.
- Hoed, M. and den Westerterp, K.R. (2008) Body composition is associated with physical activity in daily life as measured using a triaxial accelerometer in both men and women. International Journal of Obesity, 32, 1264-1270. doi:10.1038/ijo.2008.72
- Hill, J.O. and Wyatt, H.R. (2005) Role of physical activity in preventing and treating obesity. Journal of Applied Physiology, 99, 765-770. doi:10.1152/japplphysiol.00137.2005
- Sharpe, P.A., Granner, M.L., Hutto, B., Ainsworth, B.E. and Cook, A. (2004) Association of body mass index to meeting physical activity recommendations. American Journal of Health Behavior, 28, 522-530. doi:10.5993/AJHB.28.6.5
- Kaleta, D., Makowiec-Dabrowska, T. and Jegier, A. (2007) Occupational and leisure-time energy expenditure and body mass index. International Journal of Occupational Medicine and Environmental Health, 20, 9-16. doi:10.2478/v10001-007-0009-1
- Noble, J. and Sawyer, R. (2002) Predicting different levels of academic success in college using high school GPA and ACT composite score. ACT Research Report Series 2002-2004. www.act.org/research/policymakers/pdf/PredictiveValidity.pdf
- Goris, A.H.C. and Westerterp, K.R. (2008) Physical activity, fat intake and body fat. Physiology and Behavior, 94, 164-168. doi:10.1016/j.physbeh.2007.11.009
- Tammelin, T., Laitinen, J. and Nayha, S. (2004) Change in the level of physical activity from adolescence into adulthood and obesity at the age of 31 years. International Journal of Obesity, 28, 775-782. doi:10.1038/sj.ijo.0802622
- ACT Inc. (2004) Average national ACT score rises for first time since 1997, but many students still not ready for college science and math courses. Iowa City. http://www.act.org/news/releases/2004/8-18-04.html
- Martin, S.B., Morrow Jr., J.R., Jackson, A.W. and Dunn, A.L. (2000) Variables related to meeting the CDC/ACSM physical activity guidelines. Medicine & Science in Sports & Exercise, 32, 2087-2092. doi:10.1097/00005768-200012000-00019
NOTES
*Competing interests: We declare that we have no competing interests.
#Corresponding author.