Open Journal of Epidemiology
Vol.2 No.1(2012), Article ID:17234,7 pages DOI:10.4236/ojepi.2012.21002
Relationship between body mass index and serum 25-hydroxyvitamin D stronger among Caucasians than African Americans in NHANES adults 2001-2006
![]()
Division of General Internal Medicine, David Geffen School of Medicine at UCLA, Los Angeles, USA
Email: *larab@mednet.ucla.edu
Received 22 November 2011; revised 19 December 2011; accepted 3 January 2012
Keywords: Serum Vitamin D; Adipose Tissue Vitamin D; Cholecalciferol; Obesity; Epidemiology
ABSTRACT
The rapid decline in circulating levels of serum 25-hydroxyvitamin D in both African Americans and Caucasians in the US population remains unexplained, and appears to parallel the obesity epidemic. The cross sectional data on 7349 Caucasian and African American adults between 21 and 69 years of age from the continuous National Health and Nutrition Examination Study (NHANES) 2001 to 2006 were used to model by race, with smoothing functions, the true relationship between body mass index (BMI), waist circumference and serum 25-hydroxyvitamin D in men and women. Weighted regressions of determinants of serum 25-hydroxyvitamin D levels were analyzed. Serum 25-hydroxyvitamin D is negatively associated with BMI linearly above an inflection point at 20 kg/m2 and positively associated below a BMI of 20 kg/m2. The genderand age-adjusted regression coefficients of BMI on 25-hydroxyvitamin D levels demonstrate a 50% lower coefficient (r = –0.18 ng/ml/ BMI unit) among African Americans than among Caucasians (r = –0.36 ng/ml/BMI unit). These relationships were as great in men as in women and were replicated when waist circumference was used as a surrogate for visceral fat levels. The extent to which BMI is a strong predictor of serum 25-hydroxyvitamin D levels depends upon BMI being greater than 20 kg/m2. The hockey stick shape of the BMI 25-hydroxyvitamin D relationship needs to be taken into account when adjusting serum values for BMI. Both this inflection and reduction in serum levels of 25-hydroxyvitamin D in the population may be due to sequestration in an increasing adipose tissue reservoir. The interpretation of serum 25-hydroxyvitamin D levels as a biomarker of vitamin D adequacy requires appropriate adjustment of body fat mass.
1. INTRODUCTION
Low serum levels of 25-hydroxyvitamin D (25(OH)D) are considered risk indicators for all cause mortality and cardiovascular disease death. Therefore, the reported decrease in circulating levels of serum 25(OH)D and high prevalence of insufficiency/deficiency in the US population has been a cause for concern and has resulted in considerable resource investment in diagnostic measurements of serum 25(OH)D [1]. Decrease in the serum 25(OH)D has been attributed largely to sun avoidance and the use of sunscreen [2]. However, sunscreen use would not explain the similar decline among African Americans that more closely parallels the rise in obesity in the US [1]. This led us to ask whether the increase in body mass in the US population might be related to the apparent disappearance of 25(OH)D from the serum.
Modest attention has been given to the relationship between body mass index (BMI) and 25(OH)D levels. A recent review of determinants of hypovitaminosis D does not mention body fat [3]. Although circulating levels of 25(OH)D have been related to categories of BMI in select populations, the findings have been mixed. A few studies report associations in men but not women [4]. Others show associations in both genders but of a lower magnitude among women [5-7]. A previous evaluation of the National Health and Nutrition Examination Survey (NHANES) population reports a decline in serum levels and attributes it to three factors (sunscreen use, obesity, and milk intake), but does not examine the exact nature of the relationship to BMI across the range and does not explore gender and racial differences [2]. Thus, although most studies relate obesity to circulating levels of 25(OH)D, the exact shape of the relationship across the range of BMI has not been clarified. In addition, the association with gender in the US remains ambiguous. In order to shed light on this issue, we examined more closely the relationship between body fat and 25(OH)D levels; we modeled serum levels, examined the shape of the relationship, stratified by race and gender, and tested for specific relevant cutoffs indicative of a non-linear association between serum 25(OH)D and body mass.
2. METHODS
NHANES, the nationally representative probability sample of the US population designed to examine nutrition and health, was used to examine the relationship between BMI and 25(OH)D in serum among US adults. We utilized the most recent version of data from the continuous NHANEs survey, conducted from January 2001 through December 2006, for those Caucasians and African Americans adult subjects whose serum had been analyzed for circulating vitamin D levels along with BMI, diet and supplement intake data. Of approximately 10,000 subjects in this dataset, complete data sets on serum 25(OH)D, dietary and supplement use and BMI were available for 7349 individuals. In these subjects, serum was collected from blood samples taken during the examination, centrifuged, aliquoted and frozen on site at –80˚C. The samples were analyzed for total 25(OH)D content by radioimmunoassay kit (DiaSorin, MN) at the CDC National Center for Environmental Health [8].
Waist circumference was used as a surrogate for visceral fat and was measured by locating a bony landmark as well as the right iliac crest. A horizontal mark was crossed with a vertical mark on the mid-axillary line and the measuring tape placed in a horizontal plane snug around the abdomen at this point [9,10].
3. ANALYSES
Statistical analysis and graphical presentation were performed using SAS 9.2 [11]. Sampling weights were used to produce estimates that are representative of the Caucasian and African American adult population. The study employed a stratified cluster sampling design from which sampling weights were derived to simulate a nationally representative sample. Weighted regression and scatter plot smoothing (LOWESS) technique was used to illustrate the pattern between serum 25(OH)D levels and BMI. We determined the inflection point of curve using piecewise regression parameter estimates prior to assigning sampleweights. The resulting cutoff was applied and linear regression performed separately on all individuals with a BMI less than 20 kg/m2 and those in whom BMI was greater than 20 kg/m2.
Multiple linear regressions were used to determine which variables were significantly related to serum 25(OH)D. Correlation coefficients (r) were used to estimate the linear relationship between serum 25(OH)D levels and covariates. STATA was used to test whether the linear correlation between serum 25(OH)D and covariates, based on regression models incorporating sampling weights, was significantly different from zero [12]. Variable selection was performed in a stepwise manner. Non-significant variables were removed until all variables in the model remained significant at 5% level without decreasing the r-square by more than 10%. The models in which all variables remained significantly related to serum 25(OH)D levels were chosen. Gender and menopause variables were forced in the model despite their significance level.
4. RESULTS
The demographic profile of the 7349 individuals contributing original data from the Continuing NHANES to this analysis are presented by race in Table 1. Compared to Caucasians, the participating African Americans were on the average 2.7 years younger, half as likely to use vitamin supplements and were 8.8% more likely to be overweight or obese. Their unadjusted mean BMI was approximately 2 kg/m2 greater, and their waist circumference was on the average 0.8 cm wider.
Mean serum 25(OH)D levels by race are presented in Table 2. As expected, 25(OH)D means for Caucasians significantly exceeded those of the African Americans in all categories of age, gender and BMI. These mean circulating 25(OH)D levels prior to the derivation of gender, age and BMI were 14.5 ng/ml for African Americans and 25.6 ng/ml for Caucasians. Higher serum levels were seen among supplement users, and this difference differed by race with more benefit of use among the African Americans.
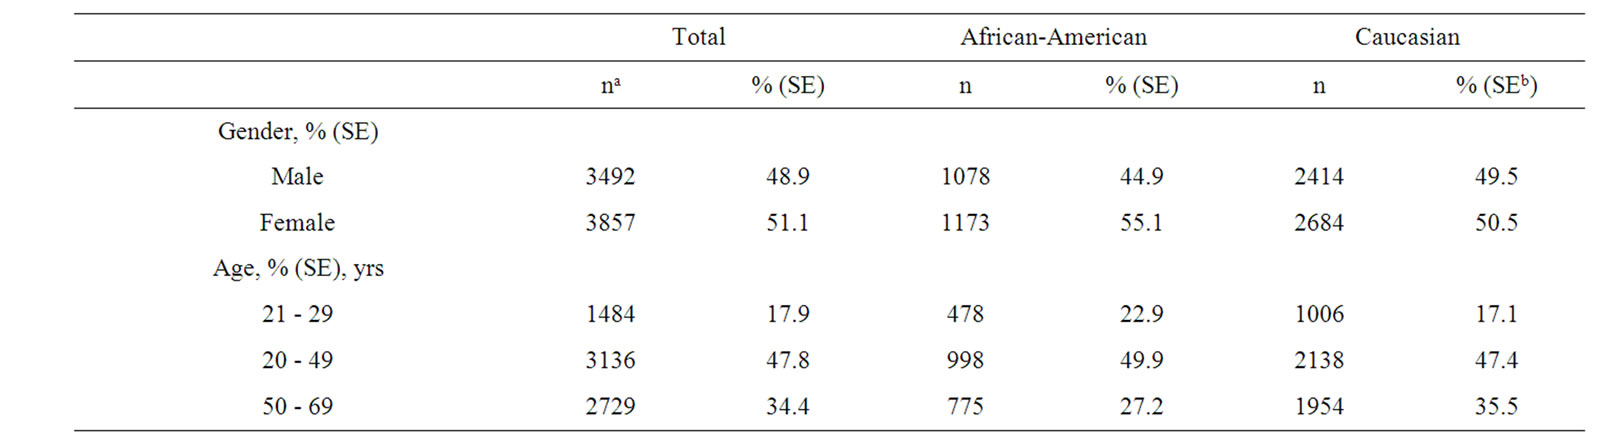
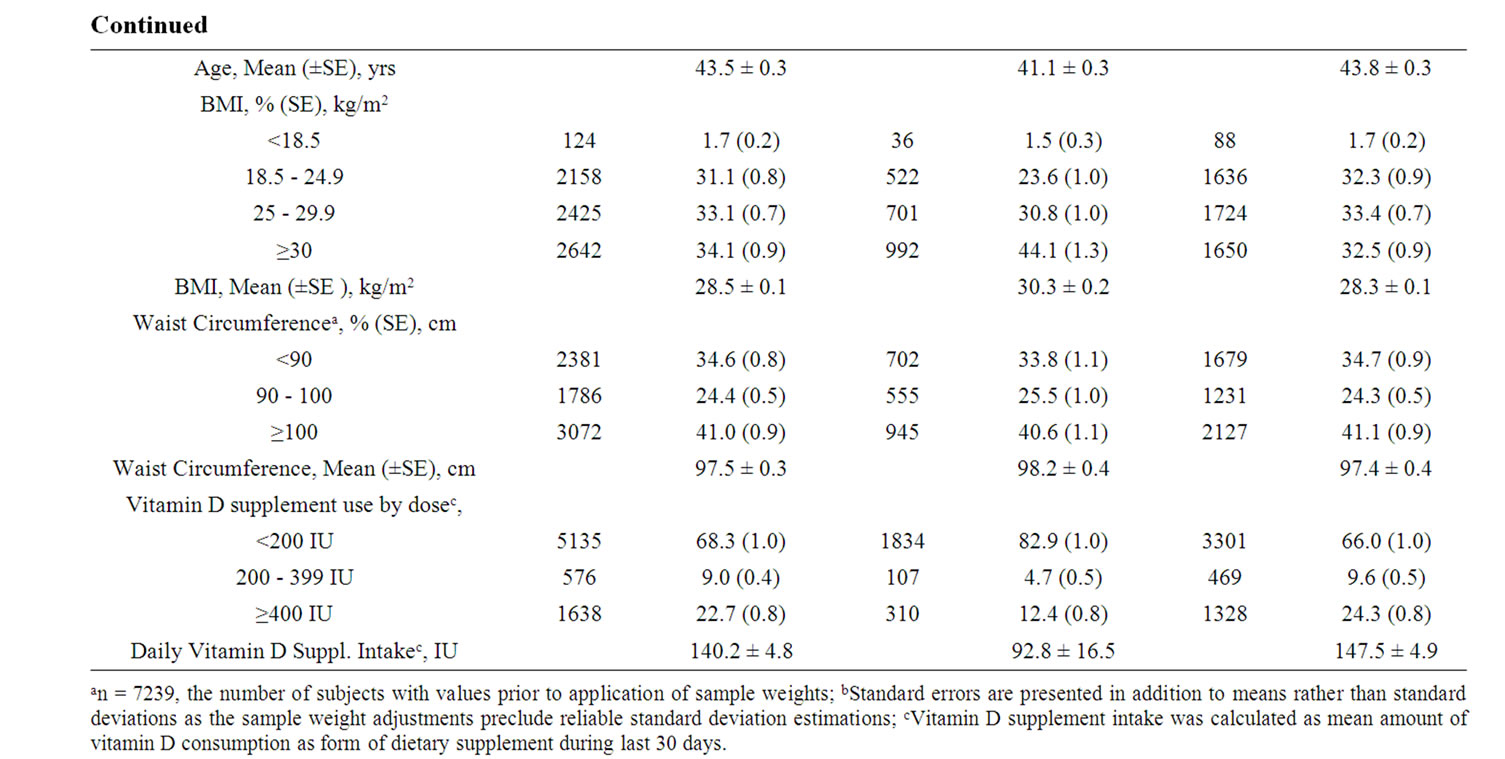
Table 1. Demographic characteristics of continuous NHANES 2001-2006 adult participants with serum 25(OH)D measurements.

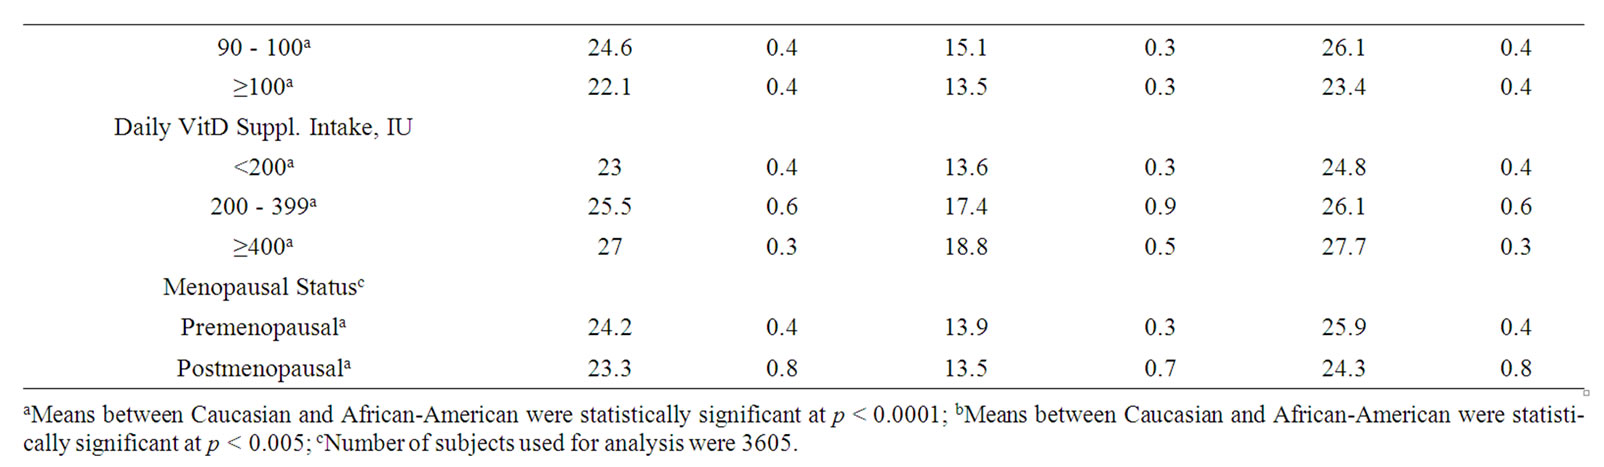
Table 2. Serum 25(OH) levels in the continuing NHANES 2001-2006 in ng/ml: Weighted means and standard errors of the mean by demographic characteristicsa.
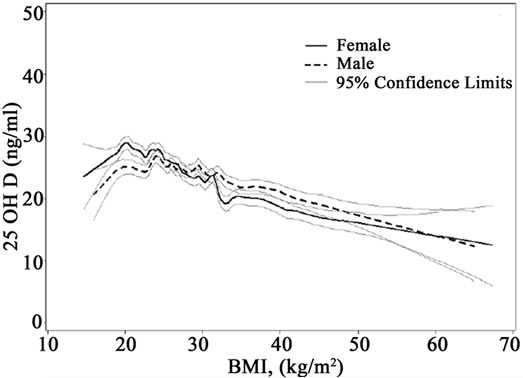
A closer examination of the relationship between BMI and serum 25(OH)D levels is seen in smoothing diagram presented in Figure 1(a). A hockey stick shaped relationship is evident with a positive association seen for BMI < 20 kg/m2 and a negative relationship for BMI ≥ 20 kg/m2. Statistical exploration of cutoffs confirmed a statistically significant inflection in the linearity at a BMI of 20 kg/m2. This inflection is particularly prominent among the Caucasian population, and the slope of the relationship is notably steeper (Figure 1(b)). Gender stratified curves show an inflection both with women and men, but the separation by gender suggests a later inflection among the men, closer to a BMI of 25 kg/m2 (Figure 1(c)).
These cutoffs were applied to multiple regression models of determinants of predictors of 25(OH)D (Table 3). Among those with a BMI > 20 kg/m2, each kg/m2 increase in body mass correlated with a decrease in the serum 25(OH)D level of 0.36 ng/ml. Among those with a body mass < 20 kg/m2, the effect was inverted, a 1.57 ng/ml increase in 25(OH)D per kg/m2. When controlling for other determinants using multiple regression and incorporating sample weights, race was significant as an interaction term with BMI, age and vitamin D supplement use among those subjects whose BMI > 20 kg/m2. In regressions stratified by race, displayed in Table 4, BMI remained a strong predictor of 25(OH)D in both groups. The weighted correlations of serum 25(OH)D with BMI were twice as strong among Caucasians (r = 0.36) as for African Americans (r = 0.18). When waist circumference was used instead of BMI, the effect was of a similar magnitude. An approximately two-fold greater reduction in serum 25(OH)D was seen among Caucasians (–0.14 ng/ml per kg/m2) compared with –0.07 ng/ml per kg/m2 among African Americans). The contributions of BMI and waist circumference were approximately equal in parallel models and accounted for the majority (3% - 7%) of the 10% variance explained in the multiple regression models. Gender and vitamin supplement use predicted 25(OH)D levels in both models.
 (a)
(a) (b)
(b)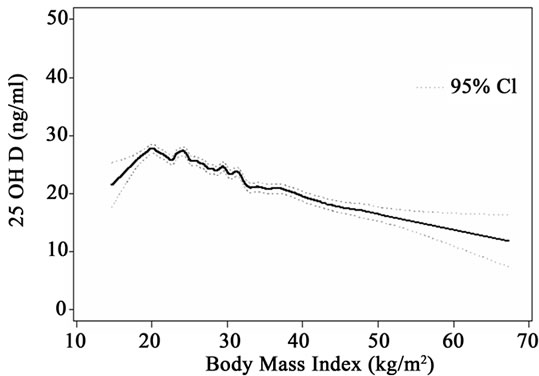 (c)
(c)
Figure 1. (a) Smoothed graph and 95% confidence interval of BMI and serum 25(OH)D relationship in continuous NHANES; (b) Smoothed graph and 95% confidence interval of BMI and serum 25(OH)D relationship in continuous NHANES by race; (c) Smoothed graph and 95% confidence interval of BMI and serum 25(OH)D relationship in continuous NHANES by gender.
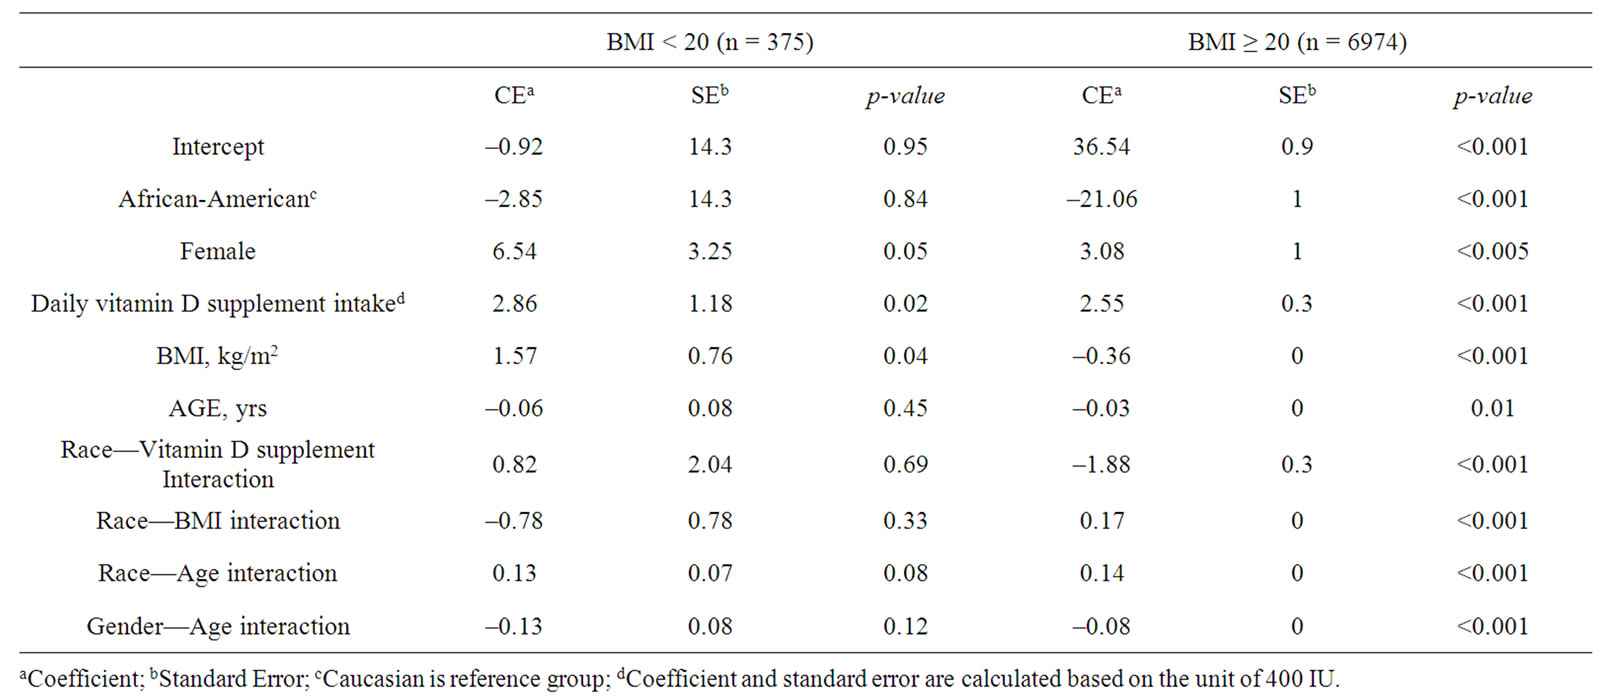
Table 3. Comparisons of multiple regression coefficients predictors of serum 25(OH)D (ng/mL) for individuals with BMI < 20 and BMI ≥ 20.

Table 4. Multiple regression of BMI, waist circumference and other determinants of serum 25(OH)D by race (excluding BMI < 20).
In the multiple regression models including BMI, reported daily intake of vitamin supplements was associated with a higher mean serum 25(OH)D level. The weighted correlations of serum 25(OH)D with BMI were stronger among Caucasians than African Americans. Supplement use, age, and BMI were significant predictors of serum 25(OH)D in both races, whereas gender was only predictive of circulating levels among Caucasians.
5. DISCUSSION
These analyses of continuous NHANES show that BMI is a strong and significant predictor of serum 25(OH)D levels among people with a BMI > 20 kg/m2. This association is much stronger among Caucasians than African Americans. However, unlike other studies that found gender specific relationships between circulating levels of 25(OH)D and BMI [4-7] at lower BMIs the relation is inverted, which needs to be considered in models. This association was seen among both women and men in the US. The negative association between BMI and serum 25(OH)D was stronger among the women than the men [5].
Although an association with BMI has been reported previously, to date modeling of the exact nature and shape of the relationship with 25(OH)D has not been undertaken [13]. The lack of awareness of this inflection, and assumptions of linearity may can lead to underestimations of the magnitude of true associations at higher BMI levels. The negative coefficient with greater body mass is consistent with the possibility that the vitamin D and/or 25(OH)D is being sequestered in adipose tissue [14]. Experimental support for sequestration comes from a trial in which obese and lean individuals were exposed to either whole body ultraviolet B irradiation or a 50,000 IU oral dose of vitamin D2 [15]. Despite similar precursor levels, the serum levels of vitamin D at 24 hours were only 57% of the level achieved in the normal body weight, healthy Caucasians in the age and race-matched obese. The authors also noted a linear relationship between body weight and peak serum vitamin D2 from the oral dose correlations (r = –0.56) and between body weight and serum vitamin D3 after whole-body irradiation (r = –0.55). The association presented here between BMI and serum 25(OH)D levels is confirmed in the Framingham Heart Study where computed tomography was used on a subset of subjects to measure subcutaneous adipose tissue and visceral adipose tissue [16].
Studies in Wistar rats under fasting and energy balance conditions suggest a reduction in bioavailability of the sequestered vitamin D [17]. Under high supplementation doses, vitamin D3 or cholecalciferol accumulated rapidly in the adipose tissue of the rats. This reservoir was accessible during fasting, but under conditions of energy balance, was released very slowly. Both of these studies suggest that in conditions of positive energy balance, as in our human norm, i) vitamin D and 25(OH)D are sequestered in adipose tissue and ii) the amount of adipose tissue in the host correlates inversely with circulating levels of 25(OH)D. Recently evidence of sequestration in human adipose of vitamin K lends credence to this explanation [18].
Serum levels of 25(OH)D represent the current diagnostic standard for assessing vitamin D adequacy in humans. The fact that body fat so strongly predicts serum 25(OH)D levels suggests that this biomarker is a less valuable indicator of adequacy of vitamin D supply without consideration of the body fat reservoir. Our calculations suggest that the BMI increases within the NHANES III study between 2001-2004 and 2005-2006 (+0.66 kg/m2 for African Americans and +0.54 kg/m2 for Caucasians) would explain 7.7 % (95% CI ± 0.6%) of the observed 2.54 ng/ml concurrent reduction in the mean serum 25(OH)D level among the Caucasians and 11.8% (95% CI ± 2.5%) among the African Americans who showed a 1.00 ng/ml reduction in serum 25(OH)D during this period. The possibility of sequestration and low availability of ingested or synthesized vitamin D among heavier individuals in positive energy balance raises concerns that increasing body fat in the population may call for greater requirements to meet physiologic needs among obese adults and children.
Although the hypothesis that increases in body fat reduce serum 25(OH)D levels is compelling and has experimental support, an alternative explanation has also been offered [19]: a fall in circulating levels of 25(OH)D may stimulate weight gain. Since the synthesis of vitamin D in the skin is dependent upon the cutaneous absorption of radiation in the ultraviolet-B range (UV-B) and UV-B radiation falls in the autumn and winter months, vitamin D may serve as a UV-B photoreceptor, signaling changes in sunlight intensity to the host. This in turn might trigger an accumulation of fat mass as physiologic reserves for the energy-spare months ahead [20]. Since NHANES III is a cross sectional study, neither hypothesis can be refuted on the basis of this evidence.
The direction of the racial differences in this BMI association with 25(OH)D serum levels is surprising. As 25(OH)D levels are uniformly lower among African Americans owing to reduced UV-B penetration in melanin-laden epidermis, one might expect BMI to be a greater determinant of low serum 25(OH)D levels. Possible alternative explanations for this racial difference include physiological differences in 1) the serum vitamin D binding protein that chaperones vitamin D metabolites through the circulation and to target tissues for metabolism and action as, 2) adipose tissue between races or 3) differences in sunlight-exposure-related behaviors. For example, heavier Caucasians might expose themselves less to sunlight and consume less vitamin D-rich foods and supplements than heavier African Americans. Another possibility is that there exists relative inhibition of release of stored vitamin D and 25(OH)D to adipose tissue when serum levels are lower owing to racial differences in the affinity of circulating vitamin D binding protein (DBP) for vitamin D and its metabolites; in fact, DBP is highly polymorphic, and the frequency of polymorphism of one allele (Gc2) that has a relatively higher affinity for 25(OH)D (hence less metabolite that is bioavailable to the target tissue) and that is enriched in the African American population [21,22].
Of interest is the finding that, in spite of it reflecting only 36% of total body fat, visceral fat predicted lower circulating vitamin D levels independently of subcutaneous adipose tissue. Using waist circumference as a surrogate of visceral fat, which was not directly measured in the NHANES study, we attempted to replicate these findings. However, the correlation of waist circumference and BMI was too high at (r = 0.89) to include it concurrently in one model. In parallel models, we found both BMI and waist circumference to predict lower serum 25(OH)D levels. Interestingly, the smooth curve of waist circumference and serum levels was linear, in contrast to BMI where the inflection point was obvious (figure not shown).
The advantage of examining this relationship in NHANES III relates to both the sample size and its generalizability to the US adult population. These findings are also timely, as the analyses and sampling are both recent and conducted under high quality, standardized conditions. A weakness of the study is the bias introduced by the tendency to avoid inclement weather and focus on higher latitudes during the summer months. This would tend to provide a positively biased picture of circulating 25(OH)D levels in the population at large, such that those with lower 25(OH)D levels in winter at relatively elevated latitudes are not being assessed. The greatest limitation of the study lies in its cross sectional nature. Although it is compelling to imagine that increasing body fat is drawing vitamin D out of circulation, the above mentioned alternative of low vitamin D stimulating weight gain is equally possible.
Recently, the result of a large genome wide association study on 33,996 individuals demonstrated the association of variants at three loci with lower 25-OH vitamin D concentrations [23]. However, as pointed out in an accompanying editorial, the “battle” against vitamin D deficiency is not likely to be affected by these findings [24]. Genetic variation does not explain the pandemic of vitamin D insufficiency/deficiency, as this phenomenon of low circulating levels of 25(OH)D is seen within populations over time. Thus other strategies for remedying it are called for. Nonetheless, if sequestration of vitamin D in body fat is occurring, recommendations for adequate intakes of vitamin D to meet physiologic needs should be increased among overweight and obese adults and children than.
6. ACKNOWLEDGEMENTS
The authors acknowledge the collegial support of Dr. Chi Hong Tseng in the statistical analyses underlying this paper and the excellent support of Jasmine Y. Chen in the preparation, formatting and editing of the manuscript. None of the authors had a conflict of interest.
REFERENCES
- Ginde, A.A., Liu, M.C. and Camargo, C.A. Jr. (2009) Demographic differences and trends of vitamin D insufficiency in the US population, 1988-2004. Archives of Internal Medicine, 169, 626-632. doi:10.1001/archinternmed.2008.604
- Looker, A.C., Pfeiffer, C.M., Lacher, D.A., Schleicher, R.L., Picciano, M.F. and Yetley, E.A. (2008) Serum 25- hyd-roxyvitamin D status of the US population: 1988- 1994 compared with 2000-2004. American Journal of Clinical Nutrition, 88, 1519-1527. doi:10.3945/ajcn.2008.26182
- Mithal, A., Wahl, D.A., Bonjour, J.P., et al. (2009) Global vitamin D status and determinants of hypovitaminosis D. Osteoporosis International, 20, 1807-1820. doi:10.1007/s00198-009-0954-6
- Al-Elq, A.H., Sadat-Ali, M., Al-Turki, H.A., Al-Mulhim, F.A. and Al-Ali, A.K. (2009) Is there a relationship between body mass index and serum vitamin D levels? Saudi Medical Journal, 30, 1542-1546.
- Jacques, P.F., Felson, D.T., Tucker, K.L., et al. (1997) Plasma 25-hydroxyvitamin D and its determinants in an elderly population sample. American Journal of Clinical Nutrition, 66, 929-936.
- Need, A.G., Morris, H.A., Horowitz, M. and Nordin, C. (1993) Effects of skin thickness, age, body fat, and sunlight on serum 25-hydroxyvitamin D. American Journal of Clinical Nutrition, 58, 882-885.
- Rucker, D., Allan, J.A., Fick, G.H. and Hanley, D.A. (2002) Vitamin D insufficiency in a population of healthy western Canadians. Canadian Medical Association Journal, 166, 1517-1524.
- Gunter, E.W., Lewis, B.G. and Koncikowski, S.M. (2010) Laboratory procedures used for the Third National Health and Nutrition Examination Survey (NHANESIII). 1988- 1994. http://www.cdc.gov/nchs/data/nhanes/nhanes3/cdrom/NCHS/MANUALS/LABMAN.pdf
- NHANES III anthropometric procedures video. Washington, US GPO, Public Health Service.
- Snijder, M.B., Visser, M., Dekker, J.M., et al. (2002) The prediction of visceral fat by dual-energy X-ray absorptiometry in the elderly: A comparison with computed tomography and anthropometry. International Journal of Obesity and Related Metabolic Disorders, 26, 984-993.
- Sas 9.2 [Computer Program] Version 9.2. Cary: Sas Institute, Inc.
- Stata Statistical Software: Release 9 [computer program]. Version 9.2. College Station: StataCorp LP.
- Brock, K.E., Graubard, B.I., Fraser, D.R., et al. (2010) Predictors of vitamin D biochemical status in a large sample of middle-aged male smokers in Finland. European Journal of Clinical Nutrition, 64, 280-288. doi:10.1038/ejcn.2009.137
- Heaney, R.P., Horst, R.L., Cullen, D.M. and Armas, L.A. (2009) Vitamin D3 distribution and status in the body. Journal of the American College of Nutrition, 28, 252- 256.
- Wortsman, J., Matsuoka, L.Y., Chen, T.C., Lu, Z. and Holick, M.F. (2000) Decreased bioavailability of vitamin D in obesity. American Journal of Clinical Nutrition, 72, 690-693.
- Cheng, S., Massaro, J.M., Fox, C.S., et al. (2010) Adiposity, cardiometabolic risk, and vitamin D status: The Framingham heart study. Diabetes, 59, 242-248. doi:10.2337/db09-1011
- Brouwer, D.A., van Beek, J., Ferwerda, H., et al. (1998) Rat adipose tissue rapidly accumulates and slowly releases an orally-administered high vitamin D dose. British Journal of Nutrition, 79, 527-532. doi:10.1079/BJN19980091
- Shea, M.K., Booth, S.L., Gundberg, C.M., et al. (2010) Adulthood obesity is positively associated with adipose tissue concentrations of vitamin K and inversely associated with circulating indicators of vitamin K status in men and women. Journal of Nutrition, 140, 1029-1034. doi:10.3945/jn.109.118380
- Adams, J.S. and Hewison, M. (2010) Update in vitamin D. Journal of Clinical Endocrinology & Metabolism, 95, 471-478. doi:10.1210/jc.2009-1773
- Yuen, A.W. and Jablonski, N.G. (2010) Vitamin D: In the evolution of human skin colour. Medical Hypotheses, 74, 39-44. doi:10.1016/j.mehy.2009.08.007
- Cleve, H. and Constans, J. (1988) The mutants of the vitamin-D-binding protein: More than 120 variants of the GC/DBP system. Vox Sanguinis, 54, 215-225. doi:10.1111/j.1423-0410.1988.tb03908.x
- Martineau, A.R., Leandro, A.C., Anderson, S.T., et al. (2010) Association between Gc genotype and susceptibility to TB is dependent on vitamin D status. European Respiratory Journal, 35, 1106-1112. doi:10.1183/09031936.00087009
- Wang, T.J., Zhang, F., Richards, J.B., et al. (2010) Common genetic determinants of vitamin D insufficiency: A genome-wide association study. Lancet, 376, 180-188. doi:10.1016/S0140-6736(10)60588-0
- Bouillon, R. (2010) Genetic and environmental determinants of vitamin D status. Lancet, 376, 148-149. doi:10.1016/S0140-6736(10)60635-6
NOTES
*Corresponding author.