Open Journal of Biophysics
Vol.2 No.1(2012), Article ID:17114,11 pages DOI:10.4236/ojbiphy.2012.21002
Pressureand Urea-Induced Denaturation of Bovine Serum Albumin: Considerations about Protein Heterogeneity
1Departamento de Bioquímica, Instituto de Biologia, Universidade Estadual de Campinas, Campinas, Brazil
2Departamento de Tecnologia, Faculdade de Engenharia de Alimentos, Universidade Estadual de Feira de Santana, Feira de Santana, Brazil
Email: *bonafe@unicamp.br
Received October 28, 2011; revised December 12, 2011; accepted December 20, 2011
Keywords: Apparent Stoichiometric Coefficient; Bovine Serum Albumin; High Pressure-Induced Denaturation; Protein Heterogeneity; Urea-Induced Denaturation
ABSTRACT
Urea denatures proteins at different concentrations, depending on the experimental conditions and the protein. We investigated the pressure-induced denaturation of bovine serum albumin (BSA) in the presence of subdenaturing concentrations of urea based on a two-state equilibrium. Pressure-induced denaturation was enhanced at urea concentrations ([U]) of 3.5 M to 8.0 M, with the free energy of denaturation at atmospheric pressure  ranging from +5.0 to –2.5 kJ/mol of BSA. The m values appeared to be biphasic, with m1 and m2 of 0.92 and 2.35 kJ mol–1·M–1, respectively. Plots of
  versus ln[U] yielded values of u, the apparent stoichiometric coefficient, of 1.68 and 6.67 mol of urea/mol of BSA for m1 and m2, respectively. These values were compared with the m and u values of other monomeric proteins reported in or calculated from the literature. The very low values of u systematically observed for proteins were suggestive of heterogeneity in the free energy of denaturation. Thus, a u value of 140 mol of urea/mol of BSA may indicate the existence of a heterogeneous molecular population with respect to the free energy of denaturation.
1. Introduction
Knowledge of protein denaturation is fundamental for understanding numerous biological processes. Historically, this phenomenon has been studied by using denaturing agents such as urea and guanidine hydrochloride [1]. Denaturation can also be induced by an increase in temperature, which leads to the weakening of interactions in the proteins and consequent exposure of previously hidden hydrophobic groups. In contrast, the use of pressure favors processes that involve a negative change in volume, such as the transfer of solvent to the hydrophobic core of proteins that disturbs hydrophobic interactions between nonpolar side chains, resulting in denaturation. The hydration of internal groups within a protein can also contribute to a change in volume in the unfolded state [2]. High hydrostatic pressure increases the susceptibility to urea induced denaturation and allows the determination of thermodynamic parameters such as the change in volume associated with denaturation and the free energy of denaturation [3,4].
More recently, hydrostatic pressure and urea have been used to study the dissociation and denaturation of proteins and viruses. Hydrostatic pressure is particularly useful for studying viral inactivation, especially with regard to its application in the development of vaccines [5]. High pressure has been used to determine the thermodynamic parameters and properties of dissociation in multimeric proteins [3,4] and the conditions of reassociation [6]. Previous work examined the effect of protons and pressure on the dissociation of tobacco mosaic virus (TMV) and giant multimeric hemoglobin, with the quantification and stoichiometric analysis of proton release [7,8]. Similar experiments in the presence of urea concentrations up to 7.0 M demonstrated a significantly greater involvement of urea in denaturation than in dissociation. The initial step of TMV dissociation can be clearly identified by light scattering, whereas the denaturation phases can be monitored by changes in the fluorescence properties [4]. Similar fluorescence and light scattering measurements at various urea concentrations have been reported for other viruses. Most values for the apparent stoichiometry of urea during dissociation range from 0.5 mol to 1.5 mol of urea/mol of subunit, while those for denaturation range from 4.0 to 11.0 mol of urea/mol of subunit [4]. Studies of protein denaturation have examined protein-solvent interactions during the denaturation transition [9-15]. More recently, Auton and Bolen [16] suggested that the peptide backbone provided a major contribution to urea-induced denaturation.
Several decades ago it was shown that the analysis of plots of the DG0 of denaturation versus ln of the denaturant concentration systematically yielded a very low value for the stoichiometry of the denaturant during protein denaturation, with the final equilibrium being considered as a reaction involving protein and denaturant. These lower-than-expected values led to alternative ways of analyzing protein denaturation. For example, in studies of protein denaturation by chemicals, an important point is whether the free energy of denaturation should be considered to be linearly dependent on [D] (denaturant concentration) or ln[D]. Pace [17] described a theoretical approach based on a linear relationship that has since been applied to most of the proteins investigated. However, Schellman [18] observed that there was no reason to expect the free energy of protein denaturation to be strictly linear with the denaturant concentration.
The aim of this work was to investigate whether the denaturation of bovine serum albumin (BSA) by urea and pressure was linearly or logarithmically related to the urea concentration. This relationship was assessed by calculating the m-values and several other thermodynamic parameters. In contrast to the 2130 capsid subunits associated with the RNA of TMV, BSA is a monomeric protein and therefore a much simpler system. Our results were compared with those for other monomeric proteins reported in the literature. Based on our findings, we propose an alternative explanation for the very low value consistently found in plots of the DG0 of denaturation versus ln[D], i.e., that this discrepancy is based on the heterogeneity of the DG0 of denaturation in protein populations.
2. Materials and Methods
2.1. Chemicals
All reagents were of analytical grade. Distilled water was filtered and deionized through a Millipore water puri- fication system (18 MΩ resistance). Unless stated otherwise, the experiments were done at 5˚C in 100 mMTrisHCl buffer, pH 7.0. Ultrapure urea and essentially fatfree BSA were obtained from Sigma. The concentration of urea used varied from 3.5 M to 8.0 M.
2.2. Fluorescence under Pressure
The high pressure system used has been described elsewhere [19]. An ISS model high-pressure (HP) cell with sapphire windows connected to a pressure generator (HIP) was used, with pressures of up to 250 MPa being studied. Fluorescence was recorded with an Edinburgh FL 900 spectrofluorometer equipped with a xenon lamp source. The pressure system was automated and detailed by Santos et al. [7]. The fluorescence data were obtained by excitation of BSA at 280 nm and emission was recorded at 300 nm - 450 nm. Changes in the fluorescence spectra resulting from the exposure of tryptophan residues were quantified by the spectral center of mass (np),
 (1)
(1)
where Fi is the fluorescence emitted at wave number ni and the summation is carried out over the range of appreciable values of F. The degree of denaturation at pressure p(ap) is related to n by the expression
 (2)
(2)
where Q is the ratio of the quantum yields of denatured and native forms, np is the center of mass at pressure p, and ndes and nn are the corresponding quantities for the denatured and native forms, respectively [3]. The software “Mathematica” was used to obtain the fitted curves of denaturation.
2.3. Theory
Equilibrium denaturation profiles were analyzed based on the binding equilibrium for the interaction of protein with the solvent and by using a two-state model (see Discussion below). Since the conformation of denatured proteins changes with the concentration of urea and guanidine hydrochloride, the evaluation of  over a large solvent concentration range can be quite informative [18, 20].
Analysis of the effect of urea on BSA in this work was done by using an approach similar to that previously described for the effect of this co-solvent and protons on protein aggregates [4,7,8]. Thus, the apparent constant of denaturation at urea concentration [U], K[U], is correlated to the apparent constant of denaturation K as K[U] = K[U]u [4]. The corresponding apparent free energy of denaturation on a molar basis,  , is given by:
 (3)
(3)
where U1 indicates a urea concentration of 1 M and u is the apparent stoichiometry of urea. Note that the equilibrium constant at 1 M urea,  , is equal to K * 1u = K, so
 .
.
Plotting  versus ln[U] should produce a straight line with a slope corresponding to –uRT. Calculation of the equilibrium constant at pressure p and a given urea concentration [U], K[U],p, is based on the relationship [4]
 (4)
(4)
where DV is the volume change associated with denaturation and the index [U], p represents the corresponding urea concentration and pressure. The calculation of K[U],p can be done based on the respective degree of denaturation, a[U],p, as
 (5)
(5)
The Equation (5) thus yields the denaturation constant K. The logarithmic form of Equation (4) furnishes the respective free energy of denaturation at pressure p
 (6)
(6)
Plotting DG[U],p versus p furnishes DV as the slope and  as the free energy of denaturation at atmospheric pressure. A marked change in the slope of the plot
  versus ln[U] at different urea concentrations is indicative of distinct urea sensitivities. Consequently, the overall or global denaturation reflects a summation of the responses of a population of BSA molecules with different susceptibilities and furnishes the general equilibrium constant Ki[U]u, where Ki,[U]= Ki[U]u and i represents each BSA population.
Based on this idea, the experimental data correspond to the sum of the distinct populations involved and the degree of denaturation a* is partitioned as follows
 (7)
(7)
where the coefficient fi represents the fraction of species i. The corresponding free energy of denaturation as a function of the equilibrium constants is expressed as
 (8)
(8)
This alternative approach for assessing denaturation is based on the assumption of a heterogeneous protein population. As will be seen, this approach yields high values of u*.
3. Results
We investigated the changes in the fluorescence of BSA at different concentrations of urea and pressure (Figure 1)
and attempted to correlate them with structural alterations. Compared to the fluorescence emission spectrum obtained in the absence of urea, a high urea concentration produced a significant red shift that intensified as the hy-
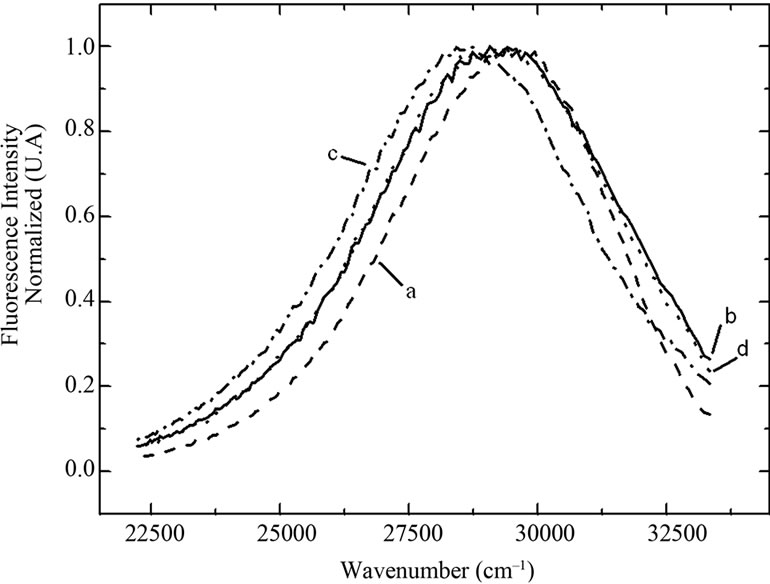
Figure 1. Normalized fluorescence spectra of BSA at several urea concentrations and pressures, expressed in wave number. Excitation at 285 nm and emission at 300 nm - 450 nm. The BSA concentration was 0.5 mg/mL in 100 mMTrisHCl buffer, pH 7.4, at 22˚C. Curve a: no urea and atmospheric pressure, curve b: 7.0 M urea and atmospheric pressure, curve c: 7.0 M urea and 250 MPa, and curve d: 7.0 M urea and atmospheric pressure after return from 250 MPa. A.U. = arbitrary units.
drostatic pressure increased. The fluorescence spectrum obtained after returning to atmospheric pressure was very similar to that obtained before the increase in pressure, indicating that the phenomenon was reversible under these experimental conditions.
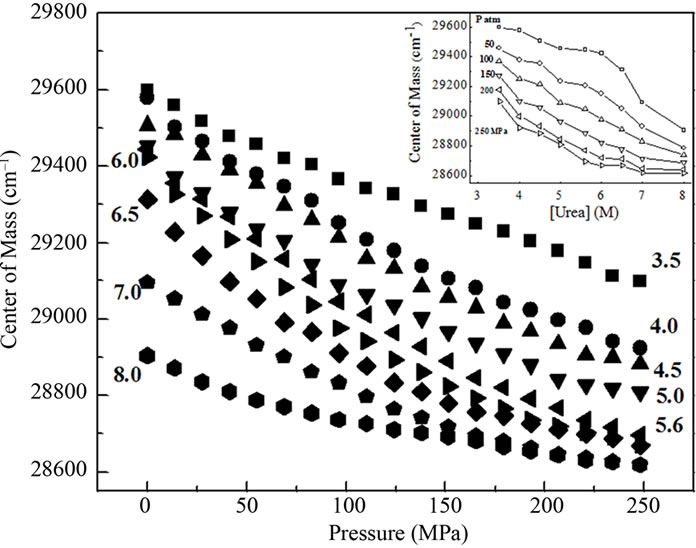
The centers of mass of the fluorescence emission spectra for BSA measured in wavenumber and calculated according to Equation (1) yielded values that revealed the degree of exposure of aromatic amino acids, especially tryptophan. This parameter reflects the extent of denaturation. The effect of pressure on the center of mass at urea concentrations up to 8.0 M is shown in Figure 2(a). Pressure produced a marked red shift in the fluorescence spectra at all urea concentrations, indicating enhanced denaturation in the presence of urea. The center of mass values obtained upon returning to atmospheric pressure were identical to those obtained before pressure application for all urea concentrations (not shown), indicating that the pressure-induced denaturation was reversible. This finding also corroborated the validity of the thermodynamic parameters obtained.
The inset in Figure 2(a) shows the effect of urea on the center of mass values at different pressures. A more intense red shift was observed in the fluorescence spectra at lower pressures. Figure 2(b) shows the respective correlation between the degree of denaturation and pressure at different urea concentrations by applying Equation (2) to the fluorescence data, and Figure 2(b) shows the corresponding plots of lnK versus pressure.
Figure 3 shows the free energy of denaturation  at different pressures as a function of urea concentration
 (a)
(a)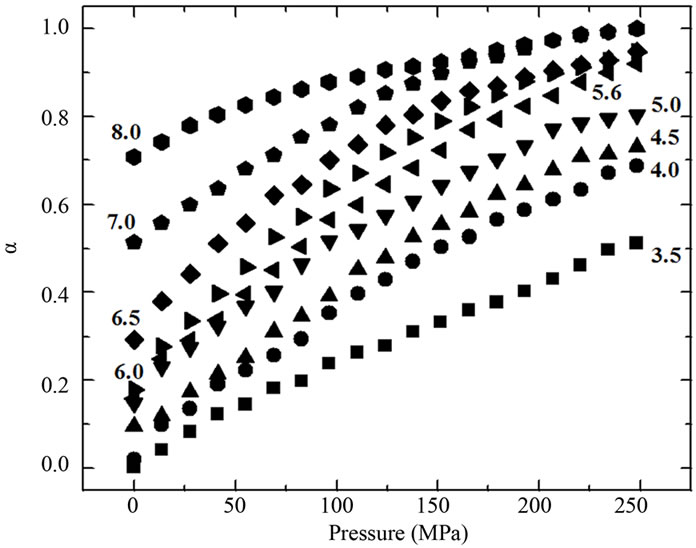 (b)
(b) (c)
(c)
Figure 2. (a) Effect of pressure and urea on the center of mass of fluorescence spectra of BSA. The data were obtained after at 10 min incubation at each pressure. The experiments were done in triplicate and the standard deviations were smaller than the symbols. The effect of urea on the center of mass at different pressures based on these data is shown in the inset. The corresponding degree of denaturation (b) was calculated according to Equation (2); and expressed as lnK (c; Equation (8)). All other conditions were as in Figure 1.
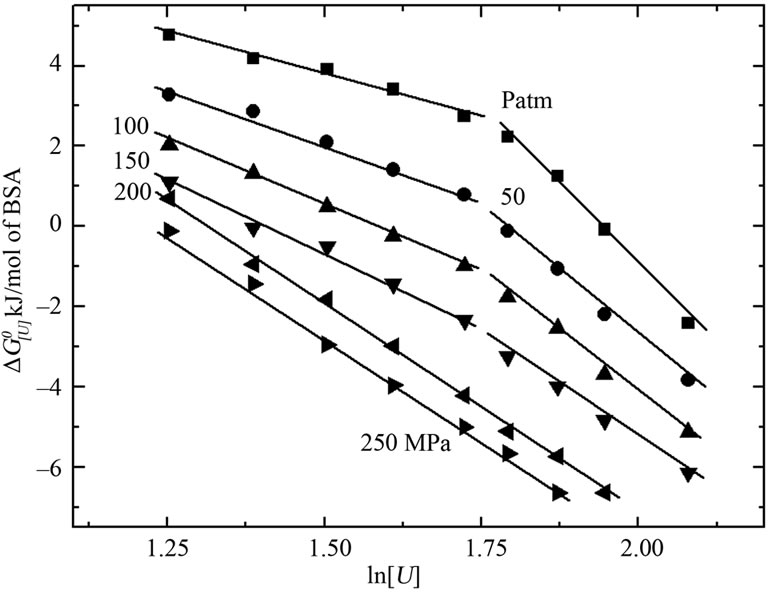
Figure 3. Effect of urea concentration on the Gibbs free energy of denaturation of BSA at different pressures, based on the data of Figure 2(a) (inset) and the relationship . The standard deviations are smaller than the symbols used.
(ln[U]; Equation (3)) based on the relationship  = –RTlnK. The biphasic nature decreased with increasing pressure and disappeared at high pressure, which suggested a complex pattern of transition from the native to denaturated state. As indicated below, the apparent value of u can be calculated from the slopes of these curves using Equation (3).
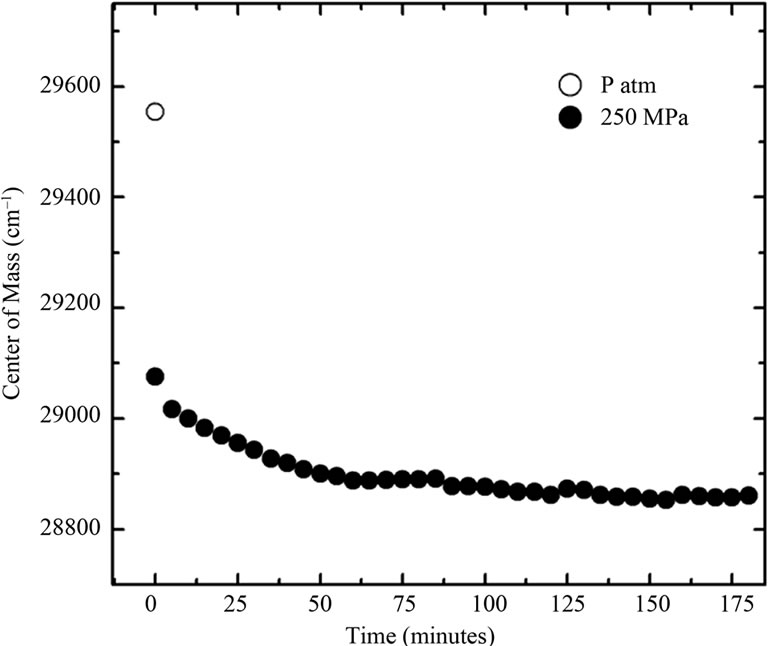
Figure 4(a) shows the time dependence of the red shift in the center of mass when BSA was pressurized from atmospheric pressure to 250 MPa in the presence of urea (4.5 M). After 20 min, the center of mass had reached 85% of its maximal shift. Comparison of the curves obtained for different incubation times with a fixed concentration of urea (4.5 M) indicated that the results for incubation times >10 min were identical (Figure 4(b)), suggesting that the denaturation had reached kinetic equilibrium. A return to atmospheric pressure resulted in near total recovery of the original fluorescence, again indicating the reversibility of the process. Plots of the natural logarithm of K as a function of pressure at different urea concentrations resulted in a linear relationship in all cases (Figure 2(c)).
Figure 5 shows the volume change associated with denaturation for each pressure curve from Figure 2(c) (Equation 6). The values for the lower urea concentrations ranged from –20 to –30 mL/mol of BSA, while that for urea concentrations > 6 M was –36 mL/mol of BSA. The data for the free energy of denaturation at atmospheric pressure as a function of ln[U] (Figure 3, squares) were determined from plots of lnKversus pressure (Figure 2(c)). The slopes of the plots (determined using Equation (3)) yielded apparent values of 1.68 and 6.67 mol of urea/mol of BSA for each part of the curve. Independent processes involving a combination of reactions and equations can also yield curves similar to those observed here. The combination of individual processes results in an overall reaction that yields a global denaturation constant; this constant reflects the sum of a series of individual values and furnishes a single value of u.
Figure 6 shows the relationship between  and ln [U] found experimentally and calculated by using Equation (7) and (8), assuming protein heterogeneity. The apparrent denaturation constants and respective contributions
 (a)
(a)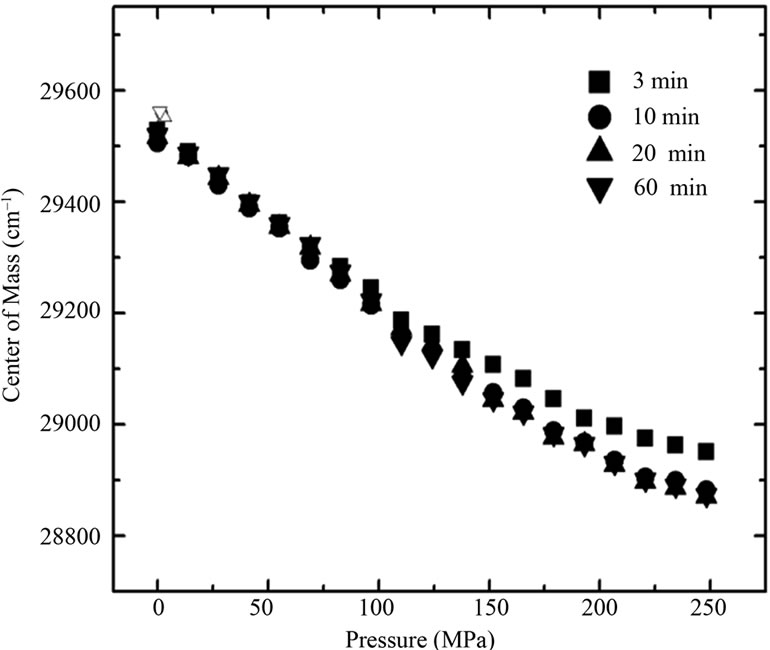 (b)
(b)
Figure 4. (a) Effect of pressure on BSA at a urea concentration of 4.5 M. The solution was pressurized from atmospheric pressure to 250 MPa in 1.5 min; (b) Influence of incubation time on the pressure-induced denaturation of BSA at a urea concentration of 4.5 M. All other conditions were as in Figure 1. Open symbols indicate the values obtained upon returning to atmospheric pressure after each incubation. The experiments were done in triplicate, and the standard deviations are smaller than the symbols used.
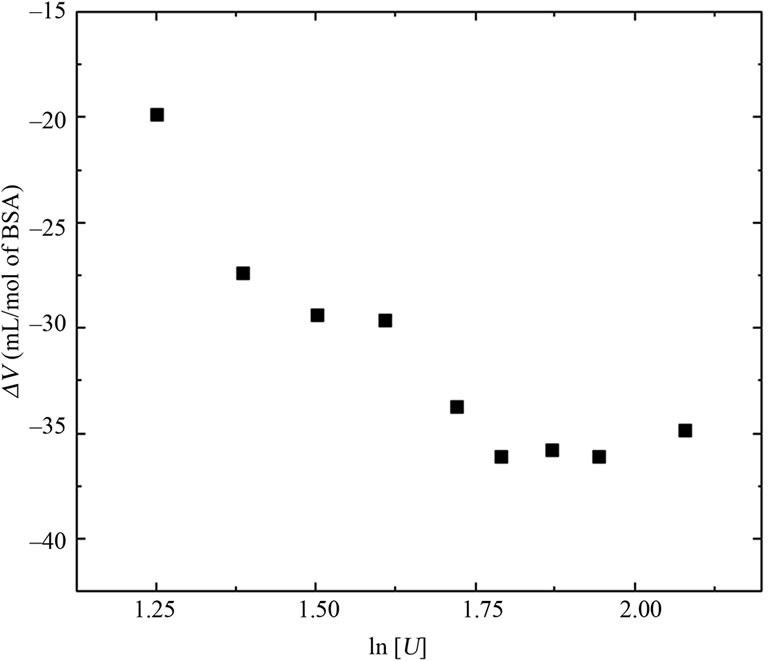
Figure 5. Effect of urea on the volume change associated with denaturation, based on the data of Figure 2(c) and Equation (6). The standard deviations are smaller than the symbols used.
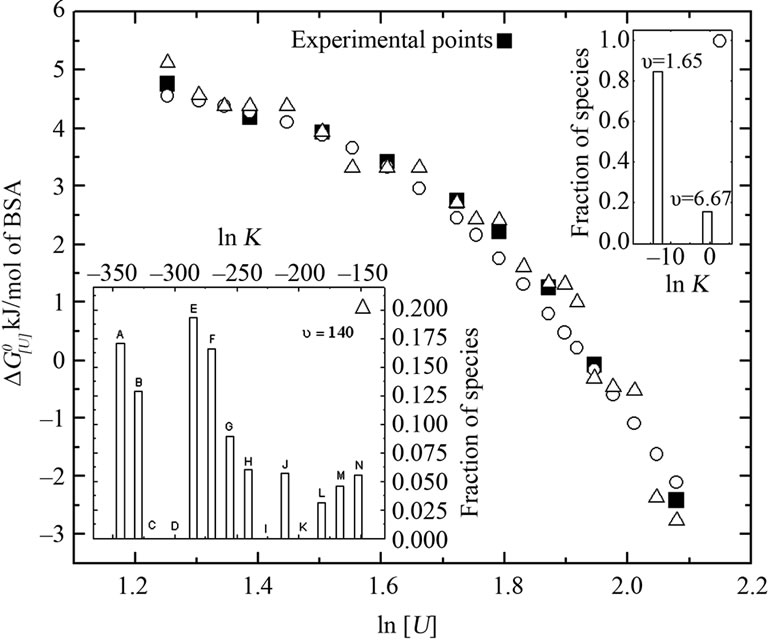
Figure 6. Comparison of the experimental points (filled squares) with the theoretical curves for albumin denaturation in two populations with distinct apparent urea stoichiometric coefficients based on Equation (7) and (8): one with 1.65 (lnK = −0.57, for population with an occurrence of 15.6%) and 6.67 (lnK = −13.22, for population with an occurrence of 84.4%) mol of urea/mol of BSA (open circles), and ten populations with a stoichiometric coefficient of 140 mol of urea/mol of BSA (open triangles). The respective species distributions for each population based on the denaturation constant are shown in the upper and lower insets, respectively.
of species are shown in the upper inset of this figure. In another situation in which greater heterogeneity was assumed, an analysis of 10 protein populations (lower inset in Figure 6) indicated an apparent stoichiometry of 140 urea molecules.
4. Discussion
New approaches for understanding protein-denaturant interactions and the mechanisms of protein denaturation have been proposed by several authors [12,18,20-23]. In general, protein denaturation results from disruption of a fine balance in protein-protein and protein-solvent interactions, with significant contributions from the hydrogen bonds of the exposed sites, peptide backbone and lateral residues of the denaturated protein.
BSA shares structural homology with human serum albumin (HSA), which has an important role as a ligand carrier in the blood. The presence of hydrophobic pockets in the three-dimensional structure of these proteins and their flexibility allows the binding of designed molecules suitable for detailed molecular studies [24]. BSA folding/unfolding has been investigated by a variety of techniques [25]. Recent studies of the effect of urea derivatives on BSA showed that denaturation can be attributed to a direct interaction between the N-H group of urea and the carbonyl oxygen of BSA, with no involvement of the urea carbonyl oxygen and N-H groups of BSA [26].
The theoretical model applied to BSA in this study was based on a two-state equilibrium and facilitated the quantification of native and denaturated proteins. The two-state model is very dependent on protein topology, local energy distribution and cooperativity [27,28]. Ureaand guanidine-induced denaturation can generally be considered as a two-state equilibrium with a quick transition from the native protein to denaturated state [29,30], as shown for HSA [31]. The accumulation of intermediate conformations is closely related to the nature of the solvent used and the experimental conditions. For example, some proteins denature in acidic conditions, resulting in a “molten globule” state [32]. In the case of BSA, extreme acidic and alkaline pH markedly influence the ability of urea to denaturate the protein and form intermediate structures [33]. As shown in the inset of Figure 2(a), at pressures > 50 MPa, the denaturation profile became more abrupt and reflected a two-state transition that was more marked as the pressure increased. In our analysis, we chose to use the curve for BSA denaturation at atmospheric pressure when fitting the proposed model since it was easier to simulate this biphasic profile and account for cooperative aspects, as discussed below.
Previous studies of urea-induced BSA denaturation at atmospheric pressure reported a denaturation profile similar to that observed here. The presence of intermediates was suggested by Khan [34]. The pressure-induced denaturation of BSA at subdenaturing concentrations of urea consistently produced a significant volume change and allowed measurement of the free energy of denaturation at atmospheric pressure in the presence of urea (Figures 3 and 5). The pressure effects arose from the difference in the specific volumes of transition as the protein migrated from a native to a denatured state (Equation (6)). Most of the proteins studied so far typically have a larger specific volume in the native state than in the denatured state, and the application of pressure induces denaturation [35]. As shown in Figure 5, the volume change of denaturation was greater at higher urea concentrations. In addition, pressure facilitated the denaturation of BSA by urea (DG[U],p) at all concentrations tested (Figure 2(c)). Pressure also induced the transition from a biphasic to a monophasic curve for DG[U],p versus ln[U] (Figure 3).
4.1. Linear Dependence of the (G0 of Denaturation on Urea Concentration
The linear dependence of the free energy on solvent concentration furnishes the m-value, a phenomenological parameter that has been applied to numerous protein-solvent systems [17]. This constant represents the difference in the transfer of free energy from water to 1 M urea solution by proteins in the denatured and native states, and is correlated with the size of the protein and the change in solvent-exposed surface upon unfolding [16].
The m-values were calculated from plots of DG[U],p versus [U] (Tanford plots) based on denaturation data for monomeric proteins reported in the literature and in this work and the results were compared with the m-values from the original reports (Table 1). The m-values for BSA were calculated from the curves of pressure-induced denaturation at different urea concentrations (Table 1). This approach should improve the quality of data when compared to values obtained by the direct measurement of fluorescence at atmospheric pressure, especially at low urea concentrations where it is difficult to quantify low levels of denaturation.
Several monomeric proteins exhibit changes in their m-values that reflect linear and biphasic behaviors (shown in Table 1 as m1 and m2, respectively). These proteins are more sensitive to urea in the final phase of denaturation. However, the method used to monitor denaturation can affect the final shape of the denaturation curve and the resulting m-value(s). Changes in the m-value are usually attributed to changes in the conformation of the folded or unfolded forms [17]. Luque et al. [36] indicated that the presence of intermediate forms may result in a biphasic curve involving an equilibrium between native and intermediate-denatured proteins. The different m-values for BSA may reflect the interaction of urea with distinct domains of the protein. Tanaka et al. [37] reported that domain III of HSA was particularly susceptible to pressureand urea-induced denaturation. Ahmad et al. [38]
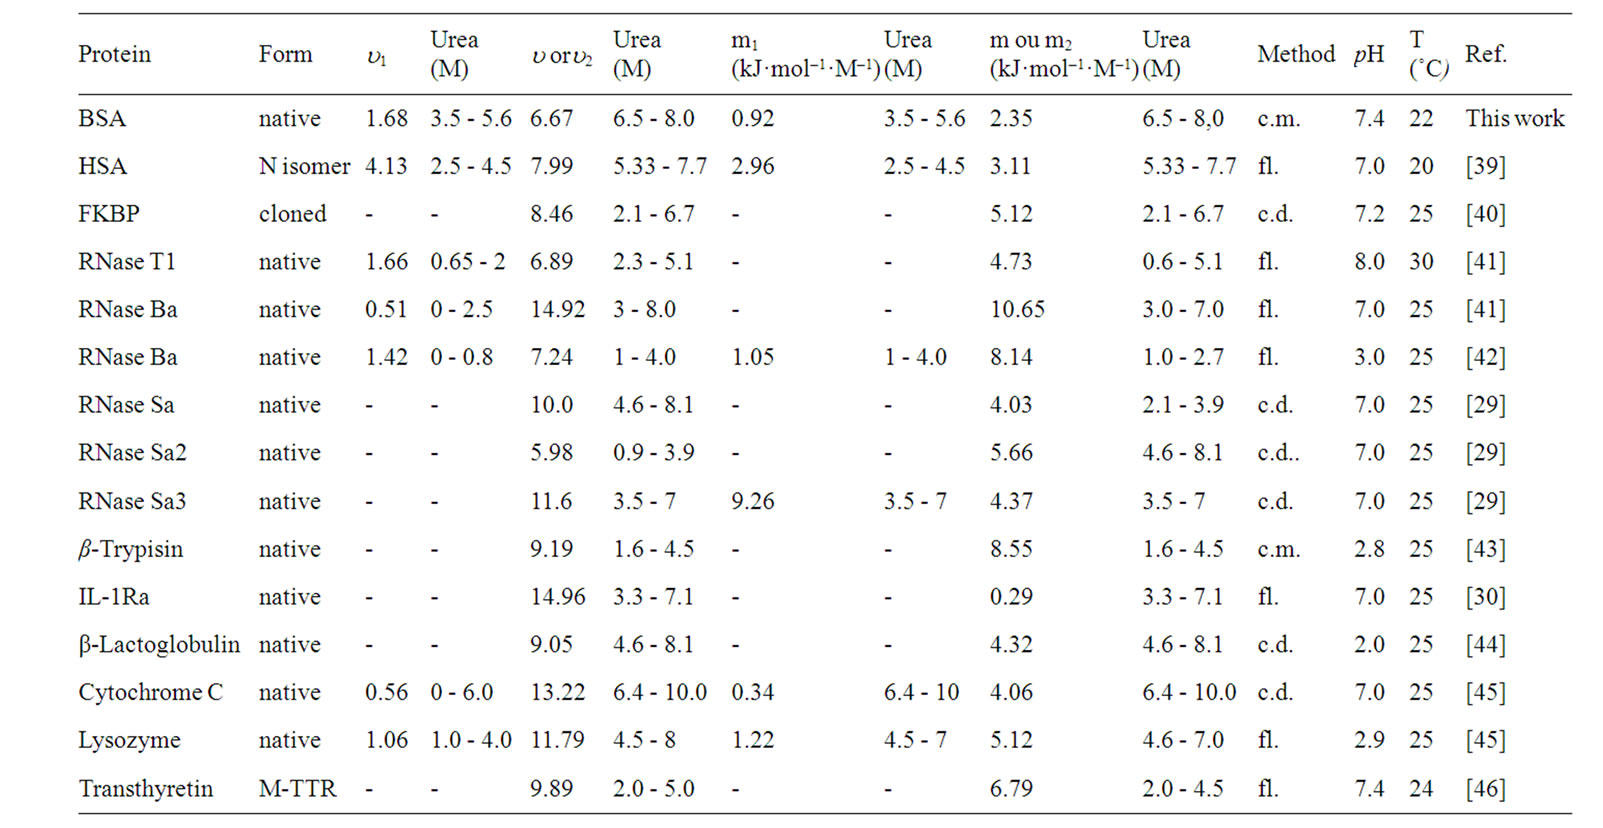
Table 1. Parameters m and u calculated for different monomeric proteins. Denaturing was based on spectroscopic data, where c.m. = center of mass of the emission spectrum, fl. = fluorescence at a given wavelength and set c d. = circular dichroism.
also noted the sensitivity of this domain at a urea concentration < 4.8 M, whereas domains I and II were sensitive to urea concentrations > 5 M. Based on these findings, the m1 value reported here would correspond to changes in domain III while the m2 value would correspond to changes in domains I and II.
4.2. Linear Dependence of the (G0 of Denaturation on ln[U]
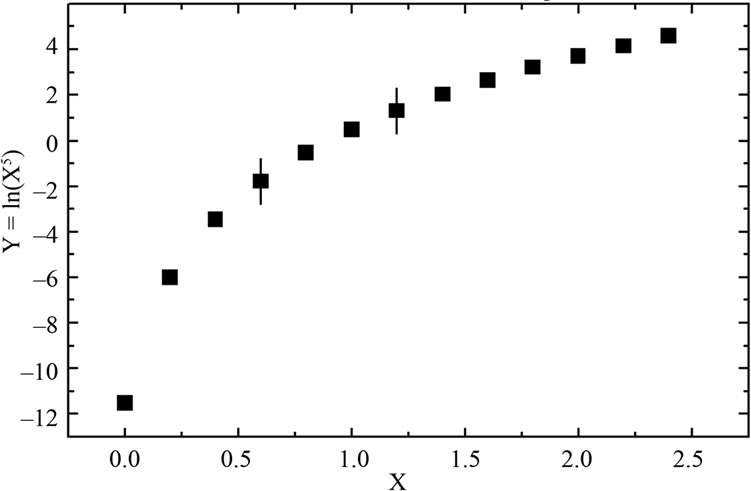
As mentioned in the Introduction, the DG0 of denaturation may show a logarithmic dependence on the concentration of denaturant. However, as indicated in Figure 7, closer analysis of this relationship revealed that an apparently linear response may actually be part of a nonlinear one when examined over a wide range of concentrations. Schellman [18] recognized that the m-parameter may change with denaturant concentration, thus implying a non-linear dependence on concentration. In addition, curves for the guanidine-induced denaturation of some globular proteins may also be non-linear [18,47,48].
Table 1 summarizes the values of u for a variety of monomeric proteins including BSA, calculated from the slopes of  versus ln [U] plots and Equation (3). In this case, u corresponds to the apparent quantity of urea that interacts with BSA and other proteins, or the apparent stoichiometries. The biphasic character for BSA agreed with the different m-values (Figure 3 and Table 1) and suggested enhanced cooperativity at higher urea concentrations. Again, since the data for BSA denaturation
 (a)
(a) (b)
(b)
Figure 7. Hypothetic logarithmic dependence function shown over a wide range (a) and (b) short range.
were the same as those used to calculate the m-values, the level of precision was higher than for the other proteins.
Biphasic plots were also observed for other proteins. The values of u1 generally ranged from 1 to 4 mol of urea/mol of protein, while those for u2 ranged from 4 to 13 mol of urea/mol of protein. In those proteins with only one value for u, this ranged from 5 to 15 mol of urea/mol of protein. The corresponding values for the  of denaturation were calculated using Equation (3) (data not shown) and were similar to those reported in the literature.
Inferences regarding the apparent stoichiometry based on  versus ln[U] plot are not widely used nowadays because of the systematically low values furnished by the slope of the plot. An explanation for this finding includes the strong urea-protein interaction of a few molecules responsible for bulk denaturation [18], as mentioned in the Introduction. The biphasic profile for BSA and several other proteins (Table 1) also deserves better attention, as discussed below. In contrast to the generally low values calculated from the slopes of these plots, u values > 100 can be obtained if the presence of heterogeneity is taken into account during denaturation.
4.3. Heterogeneous Populations
In principle, the presence of intermediate species does not disrupt the linearity of the  versus ln[U] plot. A supposed equilibrium with two apparent stoichiometries in a sequence reaction with equilibrium constants K1 and K2 would correspond to one equilibrium reaction with constant K1 K2, thus resulting in only one apparent stoichiometry. For this reason, we examined alternative explanations for the biphasic curve. In particular, we considered the possibility of population heterogeneity with respect to the free energy of denaturation. A combination containing 84.4% of species with lnK = –13.22 and 15.6% of species with lnK = ‑0.57 (Figure 6, upper inset) resulted in a good fit to the experimental curve (Figure 6), with u1 and u2 values of 1.65 and 6.67, respectively.
Current theory postulates that in the denatured state proteins tend to have more surface area exposed to the solvent and a greater number of binding sites [18]. Previous studies revealed various aspects of urea-protein interactions, e.g., the solubilizing effect of urea on apolar groups, the formation of weak hydrogen bonds with the peptide backbone, and the interface between water and buried regions of the proteins [49]. Assuming the  of denaturation for 3.5 - 8 M urea to be 7.0 kJ/mol of protein, with an average urea-protein energy of interaction of 50 J/mol of urea, the total number of urea molecules would be 140 mol/mol of protein (a theoretical u, symbolized here as u*). Using this number, we examined the distribution of
  and ln K values for 14 species (Figure 6, lower inset). The resulting curve was fitted to the experimental curve, but consistently underestimated the experimental values for the apparent stoichiometry u (Figure 6). Note that four species gave no contribution (fractional occurrence of 0%) so that the total number of distinct populations was 10. Based on the original curve (Figure 3, Patm), we also investigated the minimum number of different BSA populations at increasing values of u*. As shown in Figure 8, there was a tendency for the BSA species near 14 to yield higher values of apparent urea stoichiometry.
Generally, no significant heterogeneity is expected in readily crystallized native proteins. However, this is not true for transition or denaturated states because their greater flexibility, with the non-uniform presence of cis and trans prolines in the polypeptide backbone, makes the denatured state less well-defined [50]. Such a situation could explain the occurrence of heterogeneity.
5. Conclusions
The effect of pressure denaturation on BSA was examined at different urea concentrations, and a combination of urea and pressure was found to enhance denaturation. The results for the pressure denaturation of BSA at sub-denaturing concentrations of urea can be extrapolated to atmospheric pressure to yield more precise data. In addition, plots of  versus ln[U] can easily be compared with the classical plot
  versus [U]. The biphasic nature of both plots suggests different urea sensitivities and the presence of protein heterogeneity. The monomeric nature of BSA means that there is limited interference with the dissociation induced by urea and/or
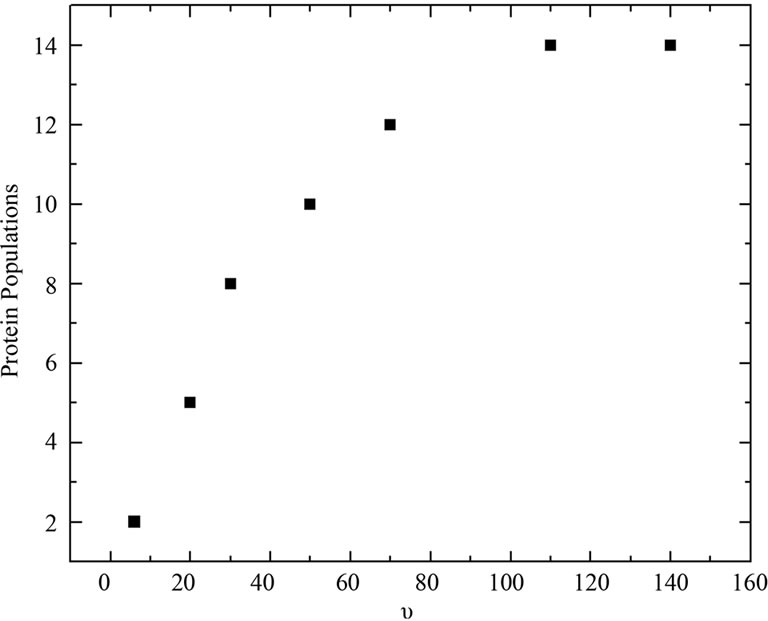
Figure 8. Number of populations P necessary for a good fit to the experimental curve of BSA (Figure 5(b)), based on the stoichiometric coefficient. The populations used were based on the relationship lnKi = lnK0 + iZ = 0 to P – 1, where Z corresponds to the increment in lnK for each population.
pressure. Comparison with other proteins suggests that the approach used here is applicable to protein-urea interactions in general. In addition, examination of the effects of temperature, pH and glycerol could improve our understanding of pressureand urea-induced BSA denaturation. The heterogeneity that explains the quantitative findings of the denaturation curves should be susceptible to analysis by special biophysical techniques based on dynamic approaches.
With judicial use, the approach used here to study the denaturation of monomeric BSA should allow better free energy measurements of several controlled thermodynamic parameters and should improve our understanding of the mechanisms of protein denaturation and stability.
6. Acknowledgements
We thank Ines Joekes and Julien Roche for helpful discussions and Stephen Hyslop for editing the English of the manuscript. This work was supported by CNPq (Conselho Nacional de Desenvolvimento Científico e Tecnológico), FAPESP (Fundação de Amparo à Pesquisa do Estado de São Paulo) and CAPES (Coordenação de Aperfeiçoamento de Pessoal de Nível Superior).
REFERENCES
- C. Camilloni, A. G. Rocco, I. Eberini, E. Gianazza, R. A. Broglia and G. Tiana, “Urea and Guanidinium Chloride Denature Protein L in Different Ways in Molecular Dynamics Simulations,” Biophysical Journal, Vol. 94, Mo. 12, 2008, pp. 4654-4661.
- K. L. Schweiker, V. W. Fitz and G. I. Makhatadze, “Universal Convergence of the Specific Volume Changes of Globular Proteins upon Unfolding,” Biochemistry, Vol. 48, No. 46, 2009, pp. 10846-10851. doi:10.1021/bi901220u
- C. F. S. Bonafe, C. M. R. Vital, R. C. B. Telles, M. C. Gonçalves, M. S. A. Matsuura, F. B. T. Pessine, D. R. C. Freitas and J. Vega, “Tobacco Mosaic Virus Disassembly by High Hydrostatic Pressure in Combination with Urea and Low Temperature,” Biochemistry, Vol. 37, No. 31, 1998, pp. 11097-11105. doi:10.1021/bi980349n
- J. L. R. Santos, R. Aparicio, I. Joekes, J. L. Silva, J. A. C. Bispo and C. F. S. Bonafe, “Different Urea Stoichiometries between the Dissociation and Denaturation of Tobacco Mosaic Virus as Probed by Hydrostatic Pressure,” Biophysical Chemistry, Vol. 134, No. 3, 2008, pp. 214-224. doi:10.1016/j.bpc.2008.02.010
- C. F. S. Bonafe, M. Glaser, E. W. Voss, G. Weber and J. L. Silva, “Virus Inactivation by Anilinonaphthalene Sulfonate Compounds and Comparison with Other Ligands,” Biochemical and Biophysical Research Communications, Vol. 275, No. 3, 2000, pp. 955-961. doi:10.1006/bbrc.2000.3402
- C. F. S. Bonafe, M. Villas-Boas, M. C. Suarez and J. L. Silva, “Reassembly of a Large Multisubunit Protein Promoted by Nonprotein Factors. Effects of Calcium and Glycerol on the Association of Extracellular Hemoglobin,” Journal Biological Chemistry, Vol. 266, 1991, pp. 13210-13216.
- J. L. R. Santos, J. A. C. Bispo, G. F. Landini and C. F. S. Bonafe, “Proton Dependence of Tobacco Mosaic Virus Dissociation by Pressure,” Biophysical Chemistry, Vol. 111, No. 1, 2004, pp. 53-61. doi:10.1016/j.bpc.2004.04.003
- J. A. C. Bispo, J. L. R. Santos, G. F. Landini, J. M. Gonçalves and C. F. S. Bonafe, “pH Dependence of the Dissociation of Multimeric Hemoglobin Probed by High Hydrostatic Pressure,” Biophysical Chemistry, Vol. 125, 2007, No. 2-3, pp. 341-349.
- R. Simpson and W. Kauzmann, “The Kinetics of Protein Denaturation, 1. The Behavior of the Optical Rotation of Ovalbumin in Urea Solutions,” Journal of the American Chemical Society, Vol. 75, 1953, pp. 5139-5152. doi:10.1021/ja01117a001
- C. Tanford, “Physical Chemistry of Macromolecules,” John Wiley & Sons, New York, 1961.
- J. Wyman, “Linked Functions and Reciprocal Effects in Hemoglobin—A Second Look,” Advances in Protein Chemistry, Vol. 19, 1964, pp. 223-286.
- J. A. Schellman, “Solvent Denaturation,” Biopolymers, Vol. 17, 1978, pp. 1305-1322. doi:10.1002/bip.1978.360170515
- J. A. Schellman, “Macromolecular Binding,” Biopolymers, Vol. 14, No. 5, 1975, pp. 999-1018. doi:10.1002/bip.1975.360140509
- I. V. Baskakov and D. W. Bolen, “Monitoring the Sizes of Denatured Ensembles of Staphylococcal Nuclease Proteins: Implications Regarding M Values, Intermediates, and Thermodynamics,” Biochemistry, Vol. 37, 1998, pp. 18010-18017. doi:10.1021/bi981849j
- Y. Kita, T. Arakawa, T. Y. Lin and S. N. Timasheff, “Contribution of the Surface Free Energy Perturbation to Protein-Solvent Interactions,” Biochemistry, Vol. 33, No. 50, 1994, pp. 15178-15189. doi:10.1021/bi00254a029
- M. Auton and D. W. Bolen, “Predicting the Energetics of Osmolyte-Induced Protein Folding/Unfolding,” Proceedings of the National Academy of Sciences, Vol. 102, No. 42, 2005, pp. 15065-15068. doi:10.1073/pnas.0507053102
- R. F. Greene and C. N. Pace, “Urea and Guanidine Hydrochloride Denaturation of Ribonuclease, lysozyme, a-Chymotrypsin, and β-Lactoglobulin,” Journal of Biological Chemistry, Vol. 249, No. 17, 1974, pp. 5388-5393.
- J. A. Schellman, “The Thermodynamic Stability of Proteins,” Annual Review of Biophysics and Biophysical Chemistry, Vol. 16, No. 1, 1987, pp. 115-137. doi:10.1146/annurev.bb.16.060187.000555
- A. A. Paladini and G. Weber, “Absolute Measurements of Fluorescence Polarization at High Pressures,” Review of Scientific Instruments, Vol. 52, No. 3, 1981, pp. 419-427. doi:10.1063/1.1136596
- J. A. Schellman, “Protein Stability in Mixed Solvents: A Balance of Contact Interaction and Excluded Volume,” Biophysical Journal, Vol. 85, No. 1, 2003, pp. 108-125. doi:10.1016/S0006-3495(03)74459-2
- E. F. Casassa and H. Eisenberg, “Thermodynamic Analysis of Multicomponent Solutions,” Advances in Protein Chemistry, Vol. 19, 1964, pp. 287-395. doi:10.1016/S0065-3233(08)60191-6
- E. P. Hade and C. Tanford, “Isopiestic Compositions as a Measure of Preferential Interactions of Macromolecules in Two-Component Solvents. Application to Proteins in Concentrated Aqueous Cesium Chloride and Guanidine Hydrochloride,” Journal of the American Chemical Society, USA, Vol. 89, No. 19, 1967, pp. 5034-5040. doi:10.1021/ja00995a036
- I. V. Baskakov and D. W. Bolen, “The Paradox between M Values and Delta Cp’S for Denaturation of Ribonuclease T1 with Disulfide Bonds Intact and Broken,” Protein Science, Vol. 8, No. 6, 1999, pp. 1314-1319. doi:10.1110/ps.8.6.1314
- P. Banerjee, S. Pramanik, A. Sarkar and S. C. Bhattacharya, “Deciphering the Fluorescence Resonance Energy Transfer Signature of 3-Pyrazolyl 2-Pyrazoline in Transport Proteinous Environment,” Journal of Physical Chemistry B, Vol. 113, No. 33, 2009, pp 11429-11436. doi:10.1021/jp811479r
- H. Wu, P. Wang, X. Hu, Z. Dai and X. Zou, “Site-Selective Probe for Investigating the Asynchronous Unfolding of Domains in Bovine Serum Albumin,” Talanta, Vol. 84, No. 3, 2011, pp. 881-886. doi:10.1016/j.talanta.2011.02.027
- R. Kumaran and P. Ramamurthy, “Denaturation Mechanism of Bsa by Urea Derivatives: Evidence for Hydrogen-Bonding Mode from Fluorescence Tools,” Journal of Fluorescence, Vol. 21, No. 4, 2011, pp. 1499-1508. doi:10.1007/s10895-011-0836-0
- D. Barrick, “What Have We Learned from the Studies of Two-State Folders, and What Are the Unanswered Questions about Two-State Protein Folding?” Physical Biology, Vol. 6, No. 1, 2009, pp. 1-9. doi:10.1088/1478-3975/6/1/015001
- D. Barrick, D. U. Ferreiro and E. A. Komives, “Folding Landscapes of Ankyrin Repeat Proteins: Experiments Meet Theory,” Current Opinion in Structural Biology, Vol. 18, No. 1, 2008, pp. 27-34. doi:10.1016/j.sbi.2007.12.004
- C. N. Pace, E. J. Hebert, K. L. Shaw, D. Schell, V. Both, D. Krajcikova, J. Sevcik, K. S. Wilson, Z. Dauter, R. W. Hartley and G. R. Grimsley, “Conformational Stability and Thermodynamics of Folding of Ribonucleases Sa, Sa2 and Sa3,” Journal of Molecular Biology, Vol. 279, No. 1, 1998, pp. 271-286. doi:10.1006/jmbi.1998.1760
- R. F. Latypov, T. S. Harvey, D. Liu, P. V. Bondarenko, T. Kohno, R. A. Fachini, R. D. Rosenfeld, R. R. Ketchem, D. N. Brems and A. A. Raibekas, “Biophysical Characterization of Structural Properties and Folding of Interleukin-1 Receptor Antagonist,” Journal of Molecular Biology, Vol. 368, No. 4, 2007, pp. 1187-1201. doi:10.1016/j.jmb.2007.02.031
- B. Farruggia and G. A. Picó, “Thermodynamic Features of the Chemical and Thermal Denaturations of Human Serum Albumin,” International Journal of Biological Macromolecules, Vol. 26, No. 5, 1999, pp. 317-323. doi:10.1016/S0141-8130(99)00054-9
- J. H. Carra, E. A. Anderson and P. L. Privalov, “Thermodynamics of Staphylococcal Nuclease Denaturation. I. the Acid-Denatured State,” Protein Science, Vol. 3, No. 6, 1994, pp. 944-951. doi:10.1002/pro.5560030609
- P. Sen, B. Ahmad and R. H. Khan, “Formation of a Molten Globule Like State in Bovine Serum Albumin at Alkaline pH,” European Biophysical Journal, Vol. 37, No. 8, 2008, pp. 1303-1308. doi:10.1007/s00249-008-0335-7
- M. Y. Khan, S. K. Agarwal and S. Hangloo, “UreaInduced Structural Transformations in Bovine Serum Albumin,” The Journal of Biochemistry, Vol. 102, No. 2, 1987, pp. 313-317.
- C. A. Royer, “Revisiting Volume Changes in PressureInduced Protein Unfolding,” Biochimica et Biophysica Acta, Vol. 1595, No. 1-2, 2002, pp. 201-209. doi:10.1016/S0167-4838(01)00344-2
- I. Luque, S. Leavitt and E. Freire, “The Linkage between Protein Folding and Functional Cooperativity: Two Sides of the Same Coin?” Annual Review of Biophysics & Biomolecular Structure, Vol. 31, 2002, pp. 235-256. doi:10.1146/annurev.biophys.31.082901.134215
- N. Tanaka, H. Nishizawa and S. Kunugi, “Structure of Pressure-Induced Denatured State of Human Serum Albumin: A Comparison with the Intermediate in UreaInduced Denaturation,” Biochimica et Biophysica Acta, Vol. 1338, No. 1, 1997, pp. 13-20. doi:10.1016/S0167-4838(96)00175-6
- B. Ahmad, M .K. A. Khan, S. K. Haq and R. H. Khan, “Intermediate Formation at Lower Urea Concentration in B Isomer of Human Serum Albumin: A Case Study Using Domain Specific Ligands,” Biochemical and Biophysical Research Communications, Vol. 314, No. 1, 2004, pp. 166- 173. doi:10.1016/j.bbrc.2003.12.069
- B. Ahmad, Ankita and R. H. Khan, “Urea Induced Unfolding of F Isomer of Human Serum Albumin: A Case Study Using Multiple Probes,” Archives of Biochemistry and Biophysics, Vol. 437, No. 2, 2005, pp. 159-167. doi:10.1016/j.abb.2005.03.013
- D. A. Egan, T. M. Logan, H. Liang, E. Matayoshi, S. W. Fesik and T. F. Holzman, “Equilibrium Denaturation Of Recombinant Human FK Binding Protein in Urea,” Biochemistry, Vol. 32, No. 8, 1993, pp. 1920-1927. doi:10.1021/bi00059a006
- C. N. Pace, “Determination and Analysis of Urea and Guanidine Hydrochloride Denaturation Curves,” Methods in Enzymology, Vol. 131, 1986, pp. 266-280. doi:10.1016/0076-6879(86)31045-0
- C. N. Pace, D. V. Laurents and R. E. Erickson, “Urea Denaturation of Barnase: Ph Dependence and Characterization of the Unfolded State,” Biochemistry, Vol. 31, No. 10, 1992, pp. 2728-2734. doi:10.1021/bi00125a013
- M. H. Brumano and M. G. Oliveira, “Urea-Induced Denaturation of b-trypsin: An Evidence for a Molten Globule State,” Protein and Peptide Letters, Vol. 11, No. 2, 2004, pp. 133-140. doi:10.2174/0929866043478257
- T. A. Dar, L. R. Singh, A. Islam, F. Anjum, A. A. Moosavi-Movahedi and F. Ahmad, “Guanidinium Chloride and Urea Denaturations of b-Lactoglobulin at pH 2.0 and 25˚C: The Equilibrium Intermediate Contains Non-Native Structures (Helix, Tryptophan and Hydrophobic Patches),” Biophysical Chemistry, Vol. 127, No. 3, 2007, pp. 140- 148. doi:10.1016/j.bpc.2007.01.006
- Y. J. Shiu, U. S. Jeng, Y. S. Huang, Y. H. Lai, H. F. Lu, C. T. Liang, I. J. Hsu, C. H. Su, C. Su, I. Chao, A. C. Su and S. H. Lin, “Global and Local Structural Changes of Cytochrome C and Lysozyme Characterized by a Multigroup Unfolding Process,” Biophysical Journal, Vol. 94, No. 12, 2008, pp. 4828-4836. doi:10.1529/biophysj.107.124214
- A. R. H. Babbes, E. T. Powers and J. W. Kelly, “Quantification of the Thermodynamically Linked Quaternary and Tertiary Structural Stabilities of Transthyretin And Its Disease-Associated Variants: The Relationship between Stability and Amyloidosi,” Biochemistry, Vol. 7, 2008, pp. 6969-6984. doi:10.1021/bi800636q
- A. C. Ferreon and D. W. Bolen, “Thermodynamics of Denaturant-Induced Unfolding of a Protein That Exhibits Variable Two-State Denaturation,” Biochemistry, Vol. 43, No. 42, 2004, pp. 13357-13369. doi:10.1021/bi048666j
- H. Kokubo, J. Rösgen, D. W. Bolen and B. M. Pettitt, “Molecular Basis of the Apparent Near Ideality of Urea Solutions,” Biophysical Journal, Vol. 93, No. 10, 2007, pp. 3392-3407. doi:10.1529/biophysj.107.114181
- M. C. Stumpe and H. Grubmüller, “Interaction of Urea with Amino Acids: Implications for Urea-Induced Protein Denaturation,” Journal of the American Chemical Society, Vol. 129, No. 51, 2007, pp. 16126-16131. doi:10.1021/ja076216j
- T. E. Creighton, “Toward a Better Understanding of Protein Folding Pathways,” Proceedings of the National Academy of Sciences, USA, Vol. 85, No. 14, 1988, pp. 5082- 5086.
NOTES
*Corresponding author.