Open Journal of Radiology
Vol.2 No.2(2012), Article ID:20414,6 pages DOI:10.4236/ojrad.2012.22008
Optimization of Liver Iron Load Assessment by Pixel-Based T2* MRI in Thalassemic Patients
1Department of Nuclear Engineering, Science and Research Branch of Azad University, Tehran, Iran
2Department of Magnetic Resonance Imaging, Noor Medical Imaging Center, Tehran, Iran
3Control and Intelligent Processing Center of Excellence (CIPCE), School of Electrical Engineering, College of Engineering, University of Tehran, Tehran, Iran
4Image Analysis Laboratory, Department of Radiology, Henry Ford Health System, Detroit, USA
5School of Electrical Engineering, Sharif University of Technology, Tehran, Iran
6Department of CT & MRI Imaging, Tehran Medical Imaging Center, Tehran, Iran
7Cardivascular Disease Research Center, Ahvaz Joundishapour University, Ahvaz, Iran
Email: *ne_gholizadeh@yahoo.com
Received February 25, 2012; revised April 2, 2012; accepted April 20, 2012
Keywords: Thalassemia; Liver; Iron Overload; MRI; T2*
ABSTRACT
Purpose: To improve liver iron load assessment by investigating the precision of different approaches of T2* Measurement. Background: Iron overload is a major problem in the treatment of thalassemic patients. Liver iron concentration (LIC) is an important index toward the management of body iron load. The accuracy of iron load estimation may suffer from the methodology of T2* measurement and there is no complete agreement upon the best approach of T2* calculation. Methods: 32 β-thallasemic patients (18 male) with the mean age of (20.0 ± 6.5) years were involved in this study. A multi-echo fast gradient-echo technique on a 1.5 T MRI system was used to measure liver iron overload and the T2* map of liver was reconstructed on a pixel-by-pixel basis. The T2* map and MRI images were utilized to determine accurate location of ROI (region of interest). The mean of T2* were computed from the ROIs. The reproducibility of calculated T2* values in two methods were obtained. Moreover, the mean of the pixel’s T2* was calculated in the entire liver parenchyma of one slice. The T2* value of the entire slice was compared with the ROI approach. Results: In the ROI based method, the CoV for the intra-observer reproducibility was 8.5% and for the inter-observer was 9.78%. In the pixel based method, the CoVs for intra-observer and inter-observer reproducibility were 2.79% and 3.91%. There was an acceptable correlation (r = 0.96) between the T2* values calculated by the ROI and the entire slice. Conclusions: The pixel-based approach is more precise to determine the appropriate placement of the ROI. The assessment of T2* in the entire slice reduces the user-based errors significantly.
1. Introduction
Treatment of β-thalassemic patients necessitates multiple blood transfusions which lead to tissue iron accumulation. Although heart failure due to iron overload is the most common cause of mortality in these patients, assessment of liver iron concentration (LIC) is a valuable index of body iron load [1-4]. Liver is the foremost affected organ in which iron accumulates and it is shown to correlate closely with the total body iron load [5,6].
Regular assessment of iron deposition has an important role in managing the therapeutic process [7,8]. MRI represents a reliable and most common noninvasive technique to assess hepatic iron content [9,10]. Iron accumulation causes magnetic field distortion; consequently, T2 and T2* relaxation times decrease. The measurement of T2 or T2* is used to quantify iron load deposition. Two basic MRI sequences, spin echo and gradient echo, are applied to determine T2 and T2* changes. Recent studies have demonstrated that both relaxation times are able to estimate the hepatic iron concentration [2,11,12]. Both methods have advantages and disadvantages. T2 is less sensitive to magnetic inhomogeneity, while T2* can be affected by this factor. In contrast, T2* can determine iron deposition in the wide scale [2]. Although both sequences have robustness to determine liver iron concentration, we used the gradient echo for this study. It is faster and more sensitive.
Two approaches are used to assess T2* parameter. The first is the ROI-based method which calculates T2* by averaging the signal intensity (SI) at different echo times (TE) within a region of interest in which (ROI) is drawn in homogenous part of the liver parenchyma [9,13,14]. The second method is the pixel-wise in which the mean of T2* of pixels in a homogenous parenchyma is calculated [6,7,15]. In both approaches, a single exponential with truncation latter echo time or an exponential model with constant offset can be used for the signal curve fitting.
Iron accumulates in tissue heterogeneously. As the result, the location of the ROI would have a considerable effect on the precision of the measured T2*. The userdependent placement of the ROI causes sampling errors [6]. In this study, Different approaches of T2* estimation have been compared to compared to obtain the most preferred and optimal method. The purpose of this study is to improve the precision of the liver iron measurement by decreasing the user dependency errors.
2. Methods and Materials
2.1. Study Population
32 β-major thalassemic patients (14 female, 18 male) with an average age of 20.0 ± 6.5 were assessed for liver iron load in 2009 and 2010. All patients had received regular blood transfusions and chelation therapy since childhood. The informed consent was provided for all patients and the study was approved by the local institutional review board.
2.2. MRI Technique
All patients underwent MRI examinations on a 1.5T MR scanner (Symphony, Siemens, Germany). A standard RF body coil was used in all measurements and a multi-echo fast gradient echo sequence based on the Brompton protocol was utilized [13]. A single trans-axial slice through the center of the liver was imaged at 12 different echo times (1.29 to 23 ms, increasing in 2.2 ms increments). The TR was set to 174 ms and the other imaging parameters were: flip angle: 20˚, matrix size: 128 × 64 pixels; slice thickness: 10 mm, and field of view 39 cm. The total acquisition time was about 9 sec.
2.3. T2* Calculation
T2* values were evaluated for the patient population. Two approaches were used to determine appropriate location of the ROI. First, in the ROI-based algorithm, the MR Image was utilized as a guide. The ROI was drawn on the homogenous region of parenchyma in MRI. Second, in the pixel-based algorithm, the T2* map was used as a guide for choosing a homogenous region of interest.
An In-house software which was validated by CMR tools of brompton [13], used to calculate T2* in the ROIbased algorithm. A homogeneous region of interest (ROI) was outlined in liver parenchyma. The mean signal intensity of the ROI was measured for each image and plotted against the TE. A mono-exponential trend-line was fitted with an equation in the form y = Ke–TE/T2*, where K represents a constant, TE represents the echo time and y represents the image signal intensity (Figure 1). To minimize the impact of noise which may cause over-estimation of T2* in heavy iron loads, data from late echo times were not used for curve fitting [9].
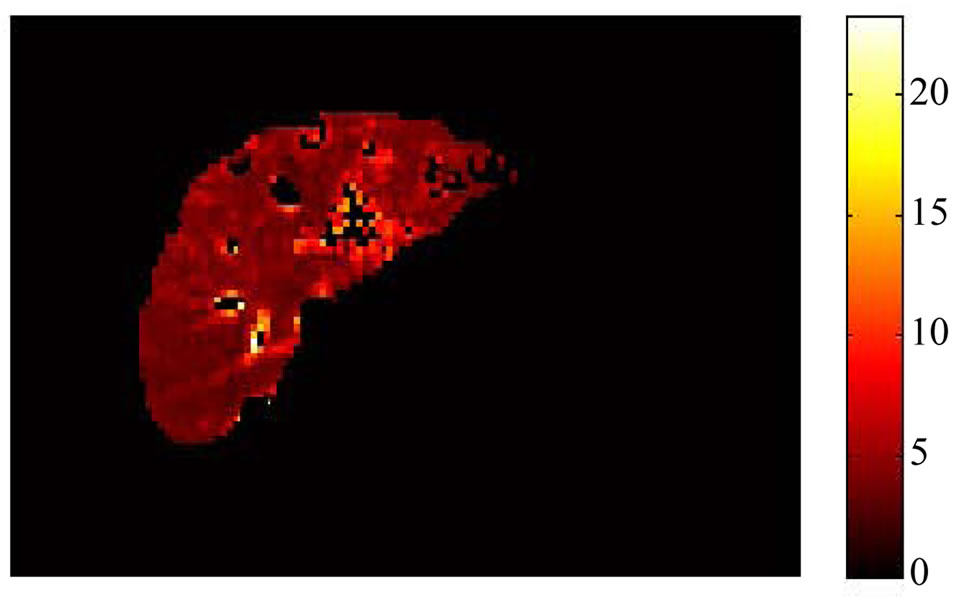
In the pixel-based approach, vessel pixels were separated from parenchyma by the Eigentool software (Henry Ford Health System, Detroit, Michigan, USA). Segmented images [16] were imported into MATLAB (Math Works, Natick, Massachusetts, USA). The signal intensity of each pixel was plotted against the TE. T2* was calculated by fitting a mono exponential equation to the time course of each pixel and the map image was formed based on the pixel’s T2* value. The T2* map of liver was created for all patients in the study group (Figure 2). The T2* map was used as a guide for choosing a homogenous region of interest. The mean of the T2* values of the pixels in the ROI was obtained.
Both mentioned approaches were utilized to determine appropriated location of ROI by two expert observers and the inter-observer variability was calculated. The study was repeated and the intra-observer differences were investigated.
We also investigated the correlation of T2* values in the ROI and in the entire slice of liver. The mean of the pixels’ T2* was calculated for the entire liver parenchyma of one slice. The result was compared with the T2* value of the ROI.
2.4. Statistical Analysis
Data were analyzed by the MedCalc software version 11.6.1. Inter-observer (A versus B) and intra-observer (A1 versus A2) differences were compared by making the Bland-Altman plot. The coefficient of variation (CoV) was defined as the standard deviation of the differences between the two separate measurements divided by their
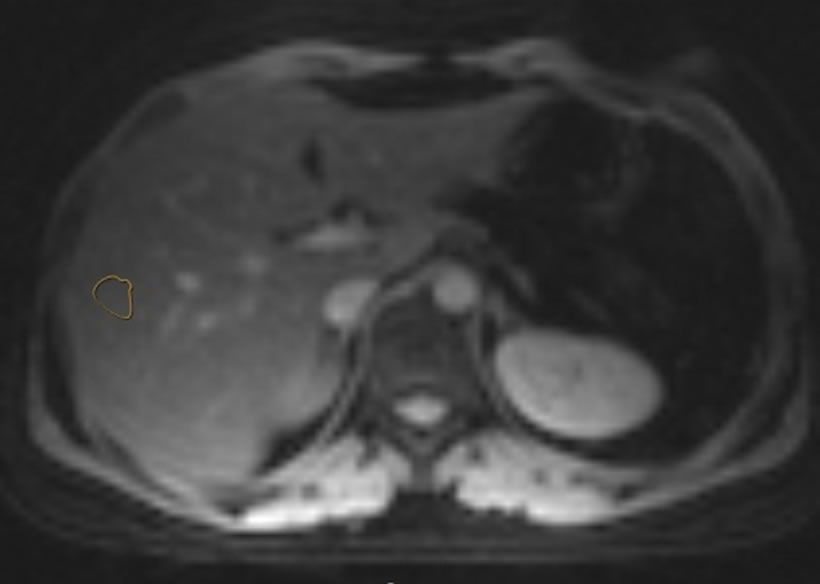
Figure 1. The ROI was drawn in liver parenchyma.
 (a)
(a)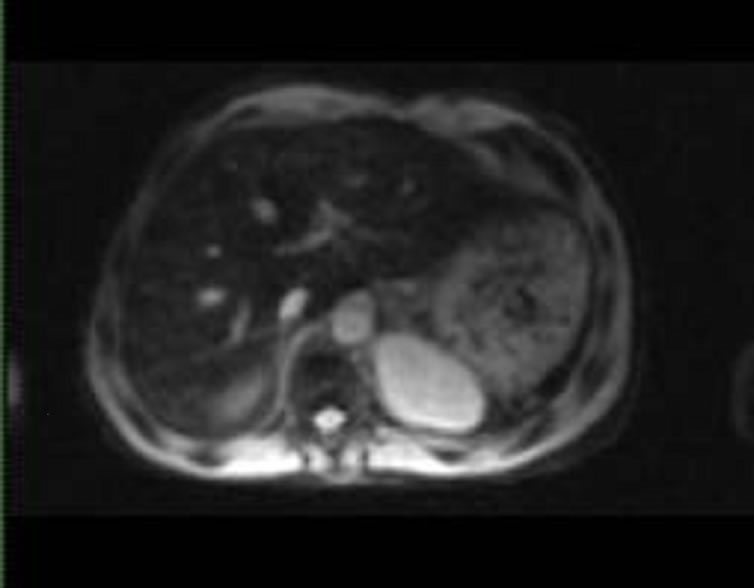 (b)
(b)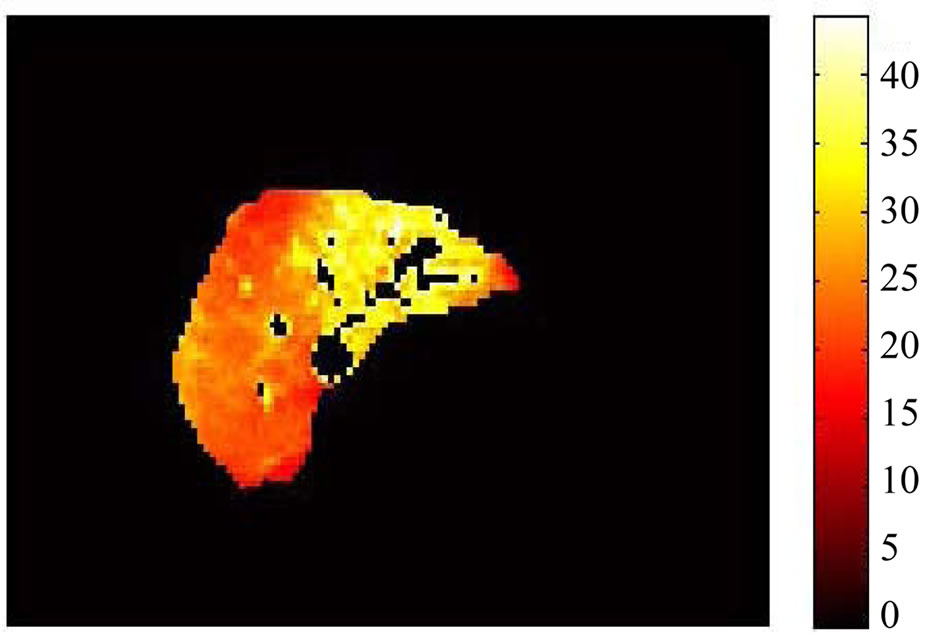 (c)
(c)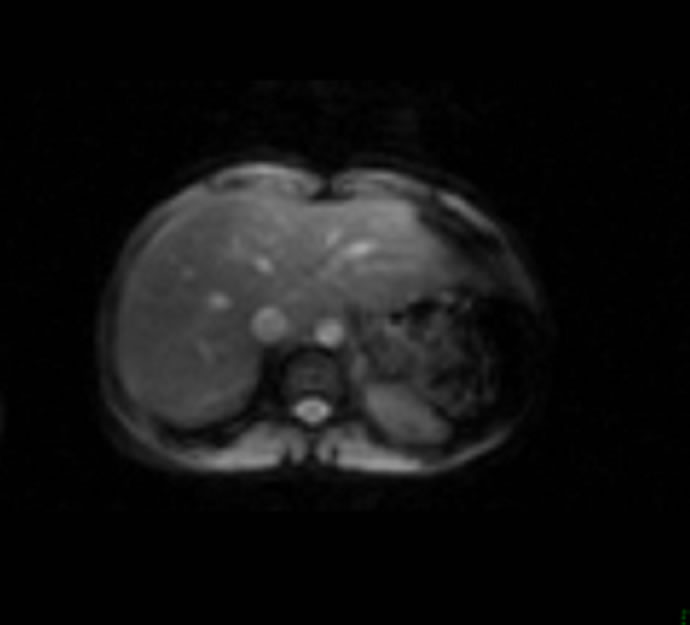 (d)
(d)
Figure 2. (a) and (c), are T2* map in liver evaluated by pixel-wise approach; (b) and (d), are MR Images based on a signal intensity. The T2* map is more robust to represent iron distribution.
mean and expressed as a percentage. The correlations between T2* measurements in the ROI and the entire slice of the liver were tested by linear regression. The paired Student’s t-test was used to assess whether differences between mean T2* values of the ROI and the entire slice methods were significant. The statistical significance was considered for p < 0.05.
3. Results
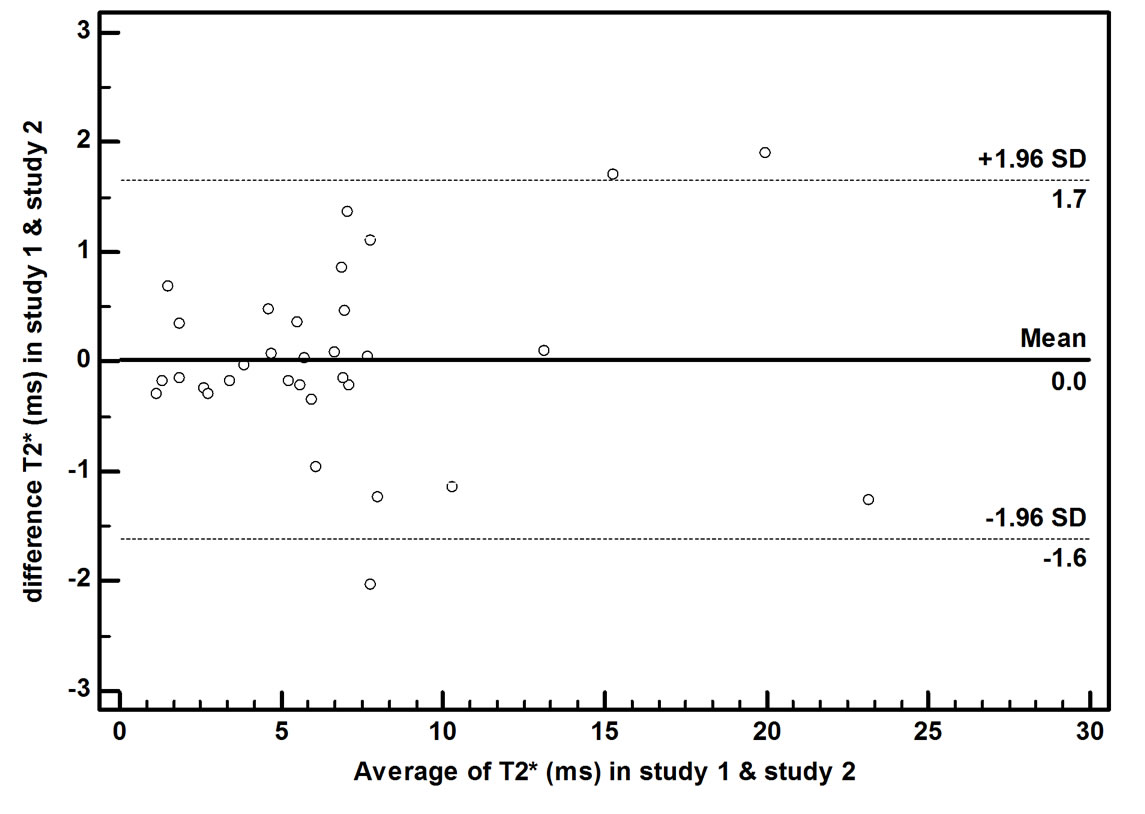
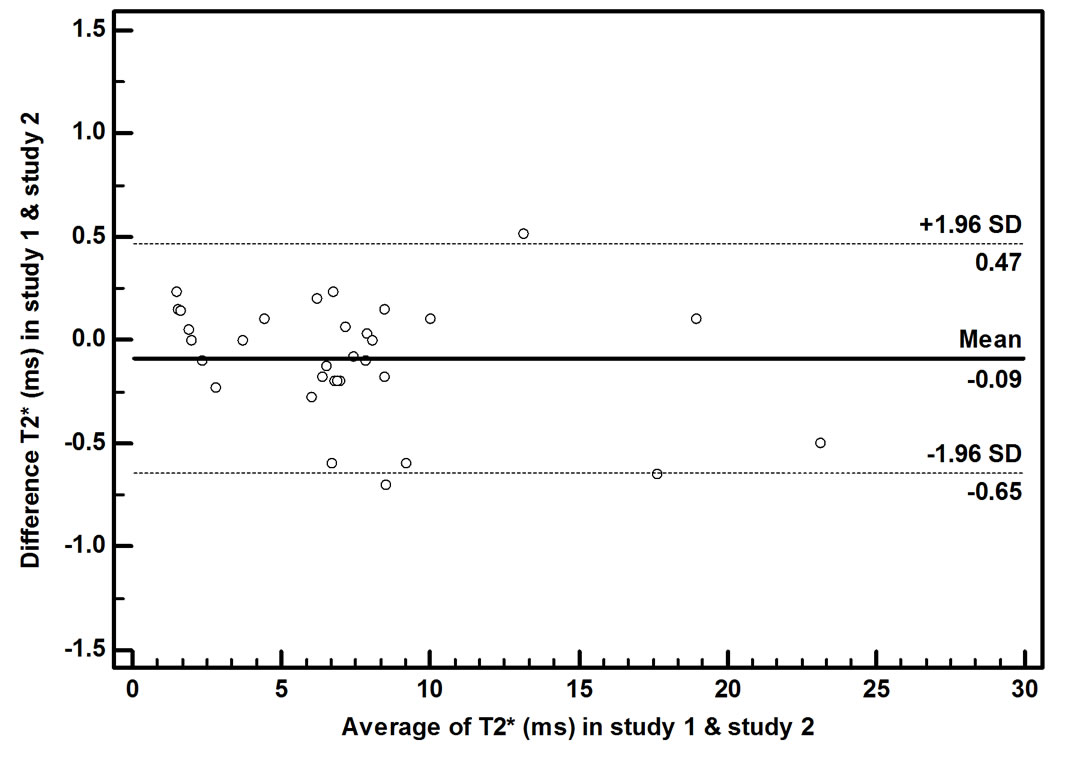
In the ROI-based approach, the CoV for the intra-observer reproducibility was 8.50%. The mean absolute difference in T2* between the two measurements was 0.58 ms, the inter-observer reproducibility was 9.78% and the mean difference between the two measurements was 0.74 ms. Figure 3 shows the Bland-Altman plots of the T2* values variability obtained by the ROI-based method. In the pixel-based approach, the CoV for the intra-observer reproducibility was 2.79%. The mean difference between the two measurements was 0.19 ms and the CoV was 3.91% for inter-observer reproducibility. The mean absolute difference between the two measurements was 0.28 ms. Figure 4 shows Bland-Altman plot for the pixel-based method. There was a close correlation (r = 0.96) between the T2* value estimated by the ROI and the entire slice. The mean T2* values for the ROI assessment was (5.40 ± 5.34) ms and for the entire slice was (5.75 ± 6.07) ms. The difference between the two assessments was not significant (P = 0.103).
4. Discussion
Several methods were investigated and utilized to improve liver iron load assessment by MRI. The accuracy of iron load estimation can be affected by the method of T2* calculation. One of the important issues in iron load estimation is whether to use the ROI method or the pixel-wise method. Mainly, iron is stored in the form of ferritin, hemosiderin in the body. Iron deposition in tissue has local cluster shapes and is not uniform [3,4,13, 17]. As a result, location of the ROI can affect the estimated liver iron load.
Positano et al. [6] used a simulated liver model and evaluated different approaches of T2* estimation. They showed that all ROI-based methods might suffer from sampling errors due to user-dependent placement of the ROI. They proposed a global method which decreases the operator dependency and sampling errors. In this study, we investigated the effect of ROI and pixel methods in liver iron load assessment from real patient’s data.
There is no consensus for the superiority of the ROIbased method to the pixel-wise method or vice versa. Both methods were used in different studies. Anderson et al. [13] and many other researchers [9,18] used an ROI in a homogenous region of the liver parenchyma to determine an average signal intensity.
Maris et al. [4] indicated that the use of ROIs rather than maps introduced an averaging error into the data prior to the fit. In some studies, T2* map has been applied as a
 (a)
(a)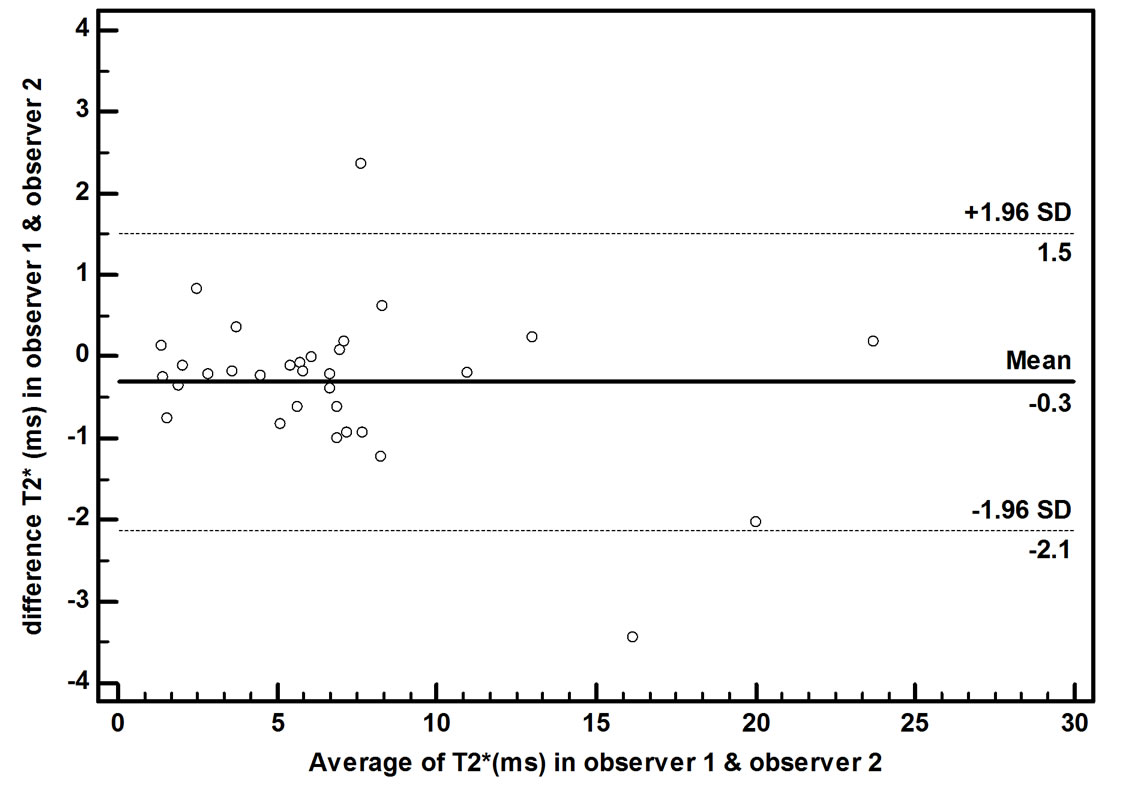 (b)
(b)
Figure 3. Bland Altman plots for intra-observer (a) and inter-observer (b) variability of the ROI-based method. The ROI was drawn on liver parenchyma in MR Image.
 (a)
(a)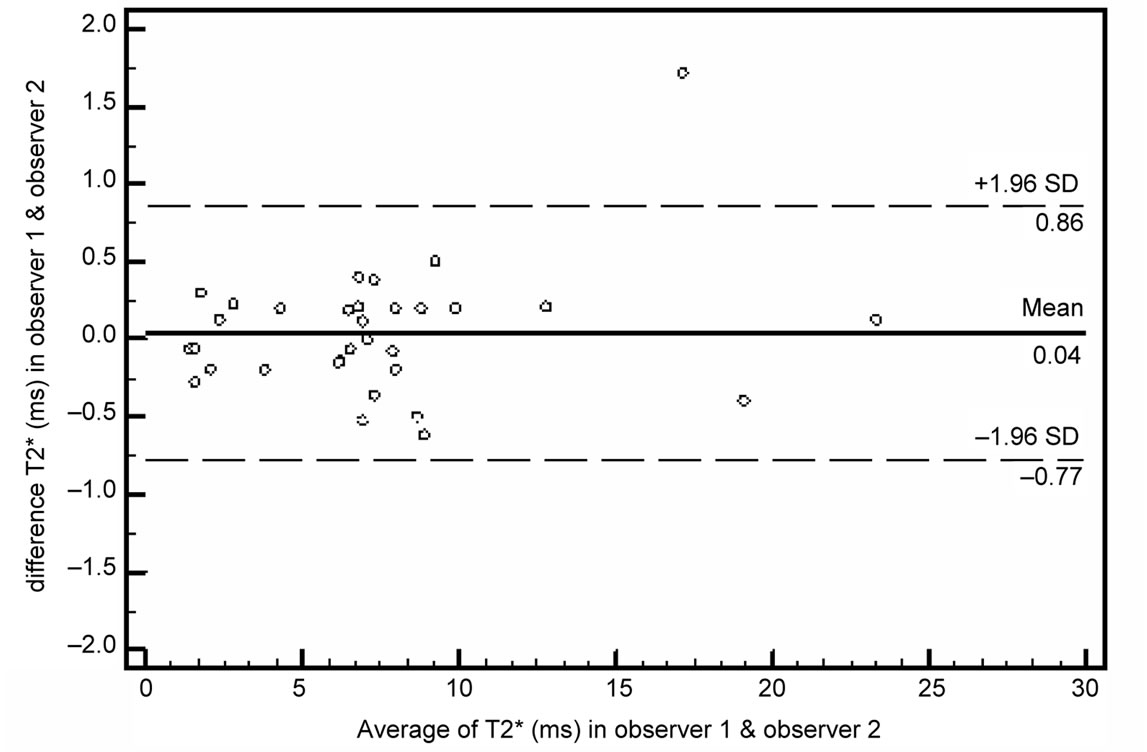 (b)
(b)
Figure 4. Bland Altman plots for intra-observer (a) and inter-observer (b) variability of the pixel-wise method. The ROI was drawn on liver parenchyma in T2* map image.
guide for choosing homogeneous regions of interest [15,19,20].
In this study, we used the conventional ROI-based method and the T2* map to define an appropriate ROI (Figure 2). As shown in fig.1, the heterogeneity of iron distribution is obvious in the parenchymal T2* map. In comparison with T2* map, the MR image based on the signal intensity is not able to distinguish the non-uniformity of iron accumulation. Moreover, in the T2* map, the partial volume effect of the vessels in the area close to the hepatic vessel is more visible. As a result, the T2* map can be a superior choice for calculation of iron distribution in the liver and it reduces the error of the vessels effects.
The evaluation of calculated T2* in different approaches via biopsy of liver is difficult to be performed on large groups of patients [6]. We did not have any ethical permission to biopsy the patients; furthermore, the biopsy specimens can be affected by non-homogenously hepatic iron distribution and high levels of fibrosis in thalassemic patients [21]. We compared the reproducibility of the mentioned methods in our study. To perform an effective comparison, images were randomly analyzed by two expert observers.
In both approaches, the CoV of the intra-observer is smaller than the inter-observer. This is acceptable as in general, the intra-observer correlation is larger [22]. In comparison with the ROI-based method, the CoV of T2* map approach is lower. This indicates that the determination of ROI via T2* map decreases the operator error. It also reduces sampling errors related to ROI position.
In Positano et al. [6] study, for the ROI-based approach, the CoV for intra-observer reproducibility was 3.7% and the CoV for inter-observer reproducibility was 5.6%. In our study, the CoV for intra-observer reproducibility was 8.5% and the inter-observer reproducibility was 9.8%. In pixel-based approach, the assessed CoVs for intra and inter observer reproducibility were 2.8% and 3.9%. It indicates that our achieved result is meaningful. Not only, the CoVs of pixel based approach is smaller than Our ROI-based method, but also, it is lower than previous study.
Based on the Bland Altman plots of the inter-observer and the intra-observer data, the variability of T2* values in the T2* map approach is smaller than ROI method (Figures 3 and 4). We found that the variability of the two measures increased with the T2* value, similar to Positano et al. [6] study. As they mentioned, for T2* values in the borderline range (5 - 18 ms) and in the normal range (>18 ms), the susceptibility artifact and incorrect contrast between parenchyma and vessels could affect ROI-based measurement.
We utilized the pixel-base method to calculate the mean T2* value of the entire mid-slice of liver. After choosing the vessel and parenchyma to segment the liver, the procedure was totally automatic. This procedure causes the removal of sampling errors related to the ROI position.
There is a close correlation between T2* values calculated by the ROI and the entire slice of the liver in the T2* map approach. Furthermore, the result of t-test shows that the difference between the slice and the ROI calculation is not significant (P = 0.103). Note that it is not required to draw an ROI in the entire slice calculation and this may eliminate user-dependent errors.
We encountered a limitation in this study. Patient population was selected randomly and it led to a few patients who had T2* values between 10 to 20 ms. This range includes normal value of iron loading.
In conclusion, in order to assess T2*, we suggest using the entire slice method rather than an ROI. This is because the entire slice method will decrease the user-dependent errors. This was compared with the currently used method in the clinical practice. On the other hand, drawing the ROI via the pixel wise approach (T2* map) will reduce the error of an incorrect placement of the ROI. This study developed a dramatic reduction in operator-based method. This may be important for diagnosis of difficult cases and for performing effective follow ups.
5. Acknowledgments
We would like to thank Dr. Majid Shakiba for his helpful consideration in this research.
REFERENCES
- J. M. Alustiza , A. Castiella, M. D. De Juan, J. I. Emparanza, J. Artetxe, et al., “Iron overload in the liver diagnostic and quantification,” European Journal of Radiology, Vol. 61, No. 3, 2007, pp. 499-506. doi:10.1016/j.ejrad.2006.11.012
- J. C. Wood, C. Enriquez, N. Ghugre, J. M. Tyzka, S. Carson, M. D. Nelson, et al., “MRI R2 and R2* Mapping Accurately Estimates Hepatic Iron Concentration in transfusion-Dependent Thalassemia and Sickle Cell Disease Patients,” Blood, Vol. 106, No. 4, 2005, 1460-1465. doi:10.1182/blood-2004-10-3982
- T. g. He, P. D. Gatehouse, L. J. Anderson, et al., “Development of a Novel Optimized Breathhold Technique for Myocardial T2 Measurement in Thalassemia,” Journal of Magnetic Resonance Imaging, Vol. 24, No. 3, 2006, pp. 580-585.
- T. G. Maris, O. Papakonstantinou, V. Chatzimanoli, A. Papadakis, et al., “Myocardial and Liver Iron Status Using a Fast T*2 Quantitative MRI (T*2qMRI) Technique,” Magnetic Resonance in Medicine, Vol. 57, No. 4, 2007, pp. 742-753. doi:10.1002/mrm.21204
- E. Angelucci, G. M. Brittenham, C. E. McLaren, M. Ripalti, D. Baronciani, et al., “Hepatic Iron Concentration and Total Body Iron Store in Thalassemia Major,” New England Journal of Medicine, Vol. 343, No. 5, 2000, pp. 327- 331.
- V. Positano, B. Salani, A. Pepe, M. F. Santarelli, D. De Marchi, A. Ramazzotti, et al., “Improved T2* assessment in Liver Iron Overload by Magnetic Resonance Imaging,” Magnetic Resonance Imaging, Vol. 27, No. 2, 2009, pp. 188-197. doi:10.1016/j.mri.2008.06.004
- E. Alexopoulou, F. Stripeli, P. Baras, I. Seimenis, et al., “R2 Relaxometry with MRI for the Quantification of Tissue Iron Overload in β-Thalassemic Patients,” Journal of Magnetic Resonance Imaging, Vol. 23, No. 2, 2006, pp. 163-170.
- A. Christoforidis, A. Haritandi, I. Tsitouridis, I. Tsatra, et al., “Correlative Study of Iron Accumulation in Liver, Myocardium, and Pituitary Assessed with MRI in Young Thalassemic Patients,” Journal of Pediatric Hematology/ Oncology, Vol. 28, No. 5, 2006, pp. 311-315. doi:10.1097/01.mph.0000212915.22265.3b
- M. A Tanner, T. g. He, M. A. Westwood and D. N. Firmin, “Multi-Center Validation of the transferability of the Magnetic Resonance T2* Technique for the quantification of tissue iron,” Haematologica, Vol. 91, No. 10, 2006, pp. 1388-1391.
- M. I. Argyropoulou and L. Astrakas, “MRI evaluation of Tissue Iron Burden in Patients with β-thalassaemia major,” Pediatric Radiology, Vol. 37, No. 12, 2007, pp. 1191-1200. doi:10.1007/s00247-007-0567-1
- J. C. Wood, M. Otto-Duessel, M. Aguilar, H. Nick, M. D. Nelson, T. D. Coates, et al., “Cardiac Iron Determines Cardiac T2*, T2, and T1 in the Gerbil Model of Iron Cardiomyopathy,” Circulation, Vol. 112, No. 4, 2005, pp. 535-543. doi:10.1161/CIRCULATIONAHA.104.504415
- T. G. St. Pierre, P. R. Clark, W. Chua-anusorn, A. J. Fleming, G. P. Jeffrey, et al., “Noninvasive measurement and imaging of Liver Iron Concentrations Using Proton Magnetic Resonance,” Blood, Vol. 105, No. 2, 2005, pp. 855- 861. doi:10.1182/blood-2004-01-0177
- L. J. Anderson, S. Holden, B. Davis, E. Prescott, C. C. Charrier, N. H. Bunce, et al., “Cardiovascular T2-star (T2*) Magnetic Resonance for the Early Diagnosis of Myocardial Iron Overload,” European Heart Journal, Vol. 22, No. , 2001, pp. 2171-2179. doi:10.1053/euhj.2001.2822
- A. Pepe, M. Lombardi, V. Positano, E. Cracolici, M. Capra, et al., “Evaluation of the efficacy of Oral Deferiprone in β-Thalassemia Major by Multislice Multiecho T2*,” European Journal of Haematology, Vol. 76, No. 3, 2006, pp. 183-192.
- C. Rossi, A. Boss, M. Haap, P. Martirosian, et al., “Wholebody T2* mapping at 1.5 T,” Magnetic Resonance Imaging, Vol. 27, No. 4, 2009, pp. 489-496. doi:10.1016/j.mri.2008.08.004
- H. Soltanian-Zadeh, D. J. Peck, D. O. Hearshen and R. R. Lajiness-O’Neill, “Model-Independent Method for fMRI Analysis,” IEEE Transactions on Medical Imaging, Vol. 23, No. 3, 2004, pp. 285-296. doi:10.1109/TMI.2003.823064
- R. t. Song, A. R. Cohen and H. K. Song, “Improved Transverse Relaxation Rate Measurement Techniques for the Assessment of Hepatic and Myocardial Iron Content,” Journal of Magnetic Resonance Imaging, Vol. 26, No. 1, 2007, pp. 208-214. doi:10.1002/jmri.20994
- M. Westwood, L. J. Anderson, D. N. Firmin, et al., “A Single Breath-Hold Multiecho T2* Cardiovascular Magnetic Resonance Technique for diagnosis of Myocardial Iron Overload,” Journal of Magnetic Resonance Imaging, Vol. 18, No. 1, 2003, pp. 33-39.
- S. Mavrogeni, E. Gotsis, V. Ladis, E. Berdousis, et al., “Magnetic Resonance Evaluation of liver and Myocardial Iron Deposition in Thalassemia Intermedia and β- Thalassemia Major,” International Journal of Cardiovascular Imaging, Vol. 24, No. 8, 2008, pp. 849-854.
- S. Mavrogeni, E. D. Gotsis, E. Berdousi, V. Ladis, et al., “Myocardial and hepatic T2* Magnetic Resonance Evaluation in Ex-Thalassemic Patients after Bone-Marrow Transplantation,” International Journal of Cardiovascular Imaging, Vol. 23, No. 6, 2007, pp. 739-745. doi:10.1007/s10554-006-9203-7
- E. Angelucci, P. Muretto, A. Nicolucci, et al., “Effects of Iron Overload and hepatitis C virus positivity in Determining Progression of Liver Fibrosis in Thalassemia Following Bone Marrow Transplantation,” Blood, Vol. 100, No. 1, 2002, pp. 17-21.
- A. W. Olthof, P. E. Sijens, H. G. Kreeftenberg, et al., “Non-Invasive Liver Iron Concentration Measurement by MRI, Comparison of Two Validated Protocols,” European Journal of Radiology, Vol. 71, No. 1, 2009, pp. 116-121.
NOTES
*Corresponding author.