Journal of Computer and Communications
Vol.05 No.04(2017), Article ID:74726,13 pages
10.4236/jcc.2017.54002
Indoor Human Detection Based on Thermal Array Sensor Data and Adaptive Background Estimation
Anna A. Trofimova, Andrea Masciadri, Fabio Veronese, Fabio Salice
Department of Electronics, Information and Bioengineering Politecnico di Milano, Como, Italy

Copyright © 2017 by authors and Scientific Research Publishing Inc.
This work is licensed under the Creative Commons Attribution International License (CC BY 4.0).
http://creativecommons.org/licenses/by/4.0/


Received: January 14, 2017; Accepted: March 11, 2017; Published: March 14, 2017
ABSTRACT
Low Resolution Thermal Array Sensors are widely used in several applications in indoor environments. In particular, one of these cheap, small and unobtrusive sensors provides a low-resolution thermal image of the environment and, unlike cameras; it is capable to detect human heat emission even in dark rooms. The obtained thermal data can be used to monitor older seniors while they are performing daily activities at home, to detect critical situations such as falls. Most of the studies in activity recognition using Thermal Array Sensors require human detection techniques to recognize humans passing in the sensor field of view. This paper aims to improve the accuracy of the algorithms used so far by considering the temperature environment variation. This method leverages an adaptive background estimation and a noise removal technique based on Kalman Filter. In order to properly validate the system, a novel installation of a single sensor has been implemented in a smart environment: the obtained results show an improvement in human detection accuracy with respect to the state of the art, especially in case of disturbed environments.
Keywords:
Thermal Array Sensor, Indoor Human Detection, Adaptive Background Estimation, Kalman Filtering, Smart Environment

1. Introduction
Facilitating older seniors independent living has become an important issue of the current research in the field of assistive technologies fostered by worldwide governments. Indeed, as reported in the technical report of the United Nations [1] , the over-60 world population in the next 15 years is projected to grow by 56 percent, from 901 millions to more than 1.4 billions. The ageing process is par- ticularly evident in Europe and in Northern America, where in 2015, more than one out of five people was over 60, and it is growing rapidly in other regions as well. Thus, Bierhoff et al. [2] , for example, report health-care systems among the products and services based on smart home technologies. In particular, since their aim is to detect critical conditions or predict them on early stages and alert caregivers, emergency treatment services are crucial for older adults living in smart homes. This kind of systems usually relys on a network of sensors to unobtru- sively monitor the life of a person, providing feedback to his/her beloved [3] . A concrete example of a widely demanded feature by the families of the elderly people who live alone is a Fall Detector; indeed falls are nowadays considered as the most frequent hazard for older seniors and they may endanger the physical and psychological health of a person, hindering independent living [4] . For this reasons, monitoring elderly people at home makes them feel safer and helps their relatives to be more confident, knowing the well-being of their beloved.
Low Resolution Thermal Array Sensors (LR-TASs) are very suitable in a home environment for substantial reasons. Thanks to their low-resolution, these sen- sors provide useful data without invading the privacy of the dweller as it could happen using cameras or microphones. Furthermore, these devices are small, cheap, easy to be installed in a normal room, and they can work even in absence of light.
LR-TASs are composed of infrared sensing elements, acquiring the temperature of a two-dimensional area. In this paper, we refer to experiments conducted using the Grid-Eye [5] sensor developed by Panasonic. This device is an 8-by-8 LR-TAS with sampling rate of 10 samples/s, a temperature range from −20˚C to 80˚C with 0.25˚C resolution, field of view of 60˚ and maximum dis- tance declared to detect humans of 5 m. Moreover, Grid-Eye sensor comes with an on-board thermistor that provides the environment temperature from −20˚C to 80˚C with 0.0625˚C resolution. It communicates through interface to a wireless station which sends all the data to a central processing unit for the analysis.
2. Background
Human localization has several applications in Smart Home Environments, e.g., surveillance, health monitoring, and energy management. In particular, LR-TAS has been used to accomplish different tasks.
The goal of the work proposed by Sixsmith et al. [6] is to detect falls of the older seniors through SIMBAD: Smart Inactivity Monitor using Array-Based De- tectors. This system relies on two parallel modules to raise alarms. First of all, it analyzes target motion to detect falls characteristic dynamics. Then, it monitors target inactivity and compares it with a map of acceptable inactivity periods in different locations in the field of view. This system has been tested in laboratory simulating predefined fall scenarios, reporting limited results in true positive rate without any false positive. This research includes also results related to a trial last- ing two months in a single occupant house. After a training period where experts tuned the system parameters according to the output, still an unacceptably high false-larm rate emerged.
Erickson et al. [7] use a Thermal Array Sensor Network in order to measure occupancy of a building. The provided information is used to control heating, cooling, ventilation, and lighting of the building to optimize energy usage. The method proposed by the authors consists in removing the background to detect the pixels of the matrix that refer to humans, followed by an analysis of the con- nected components using K-Nearest Neighbors classifier, to estimate the num- ber of people. Unfortunately, no significant results have been reported.
In Basu et al. [8] the authors present a method to estimate number of people and the direction of their motion from LR-TASs data. A support vector machine has been used to classify connected components and local peak counts, estima- ting the number of persons with 80% accuracy. Finally, they inferred the direc- tion of a subject motion across a set of scenes using cross-correlation analysis.
Mashiyama et al. [9] report a system for Activity Recognition using LR-TASs. The proposed method aims to detect five activities―no event, stopping, walking, sitting, and falling―in three steps: human body detection, feature extraction and classification. Considered the high performances of this method in classifying activities as reported by its authors, we have decided to further analyze and re- implement it in order to compare results obtained in a field trial test.
For sake of clarity and completeness let’s report the crucial passages of the work proposed by Mashiyama et al. with the notation used in the rest of this pub- lication. Given an instant of time , the frame represents the set of measurements taken by a LR-TAS sensor at time , each one related to the co- rresponding pixel. Fixing a time windows , the variance of each pixel with is computed as it follows:
(1)
If the obtained variance exceeds a given threshold , a moving person (walking, sitting, or falling) is detected in the current frame. Conversely, if no movement has been detected, the discrimination between a Stopping per- son or No event is done according to the difference ( ) between a person tem- perature and the background temperature . Given as the number of pixel covered by a standing person, the average of the first pixels of a frame ordered by descending temperature gives . Similarly, the average of the remaining pixels gives . Finally, only if exceeds a given threshold a standing person is revealed. The authors tested their system in a test bed expe- riment, reporting particularly good accuracy results in classifying the mentioned activities, specially considering just the detection phase, excluding the activity classification method.
Most of the work done in activity recognition and human detection using LR- TAS report experimental data obtained by tests performed in a controlled envi- ronment. However, as highlighted by Sixsmith et al. [6] , there are some limita- tions in this approach that have to be considered when building an effective indoor monitoring system. First of all, the positioning of the sensors must take into account the geometry of the environment and its contents to ensure that the vision of the sensor is not obstructed. Indeed, a system to detect falls would be useless if it would not guarantee its effectiveness over the entire walkable area of the house. Moreover, another factor requiring a deep study is the noise mana- gement: radiators, appliances, heaters or sunlight reflections have to be consi- dered in the model of the system. Our work is mainly focused in improving hu- man detection’s performances handling noisy data.
3. Human Detection
The following method aims at retrieving a probability estimation of the presence of at least one person in the LR-TAS field of view. The main steps of the algo- rithm are summarized in the flow presented in Figure 1: noise removal, back- ground estimation and probabilistic foreground detection.
3.1. Noise Removal
LR-TAS (Low Resultion-Termal Array Sensor) raw temperature data are charac- terized by the presence of noise perturbing the desired measured signal. These type of sensors usually denote low accuracy on a single measurement: Grid-Eye sensor, for example, report the value within Typ.  [5] . In order to re- move the effect of the noise on the measured signal, we will consider the indoor environment as a dynamic system influenced by the external temperature, air conditioning systems, and the presence of people and appliances in general. Re- ducing the noise components from the measured signal makes the human de- tection system more robust to external variations. As already mentioned, Grid Eye is a matrix of
sensing elements measuring the temperature of a certain re- gion of space. To get the temperature distribution in the space, the temperature
[5] . In order to re- move the effect of the noise on the measured signal, we will consider the indoor environment as a dynamic system influenced by the external temperature, air conditioning systems, and the presence of people and appliances in general. Re- ducing the noise components from the measured signal makes the human de- tection system more robust to external variations. As already mentioned, Grid Eye is a matrix of
sensing elements measuring the temperature of a certain re- gion of space. To get the temperature distribution in the space, the temperature
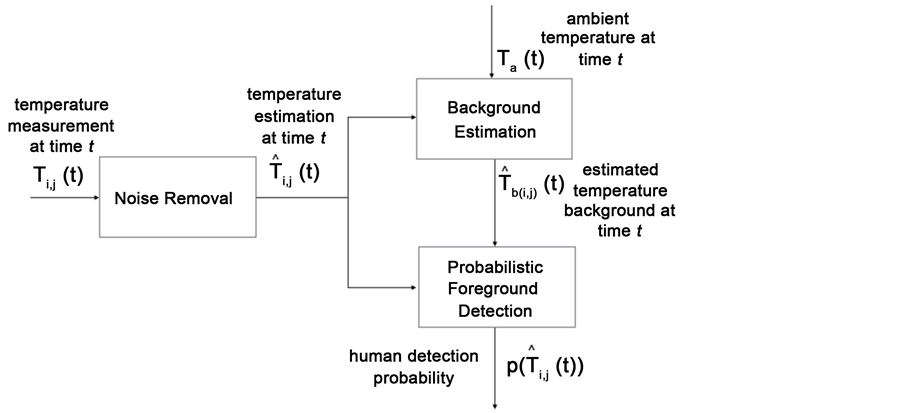
Figure 1. Algorithmic flow of the proposed human detection method.
evolution process on a single region will be taken as an independent dynamic system and, hence, the measurement made by a single sensing element will be fil- tered independently from other measurements.
3.1.1. Kalman Filtering
Consider a dynamic system represented as follows:
(2)
where is the variable to be estimated, is the value obtained mea- suring which is affected by the measurement noise term , is the state variable at time , models the process noise, is the system ma- trix and is the measurement matrix. The proposed noise removal technique is based on Kalman Filter (KF) [10] and it is composed of two phases: extra- polation and correction. During the extrapolation phase the filter receives a pre- diction of the system state for the current step using the system state estimate made on the previous step. During the correction phase the state prediction is adjusted by current measurements to obtain the corrected estimate . The state prediction is expressed as:
(3)
while the state estimate is represented as:
(4)
where is the Kalman Gain [10] at time .
3.1.2. LR-TAS Data Filtering
In order to obtain the expected value of the measured temperature, separating it from the noise component, we applied the Kalman-Filtering technique described in the previous paragraph. Let the state variable be represented by : the average temperature of the objects placed in the field of view of the sensing element in position at time . Similarly, is the measure of as acquired by the sensing element in position at time . Finally, in order to get the prediction on the state as described in Equation (3), the system matricies have to be set as follows:
(5)
Thus, from Equation (2):
(6)
while the variable to be estimated can be derived from Equation (2):
(7)
The result of the application of KF to measurements collected by a single sen- sing element is shown in Figure 2: data have been collected in a perturbed envi- ronment with appliances in the sensor field of view and activating the air con- ditioning system. The influence of these factors on the ambient temperature is evident analyzing the room temperature collected by the on-board sensor ther- mistor (Figure 3).
3.2. Background Estimation
The fundamental assumption to discriminate humans from the background is that the human temperature distribution has to differ from the ambient temperature distribution. In this condition, the human recognition task converges to the ana- lysis of the difference between the current measurements of the sensor cells and the corresponding values of estimated temperature background. Nevertheless, the

Figure 2. Result of application of Kalman Filter to the temperature measurements done by a single cell sensor: original signal (black) and filtered (white).
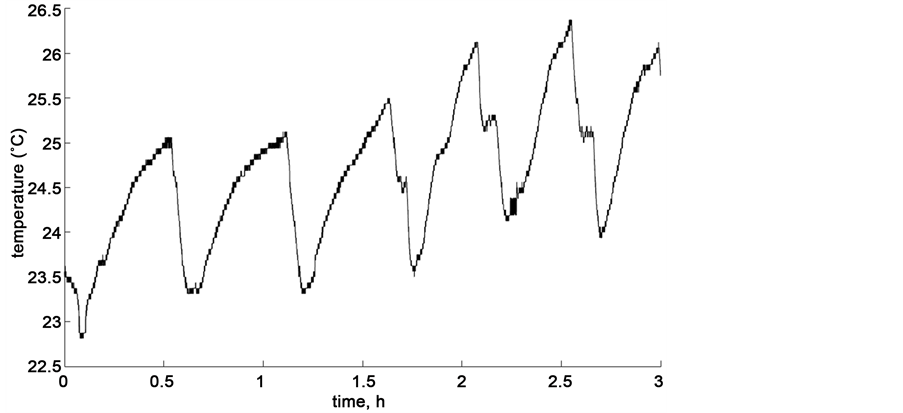
Figure 3. Ambient temperature measurements done by the on-board sensor thermistor. The oscillation is caused by the air conditioning system.
temperature background estimation should adapt to the environmental condi- tion changes that can be relatively rapid.
Assuming that the thermistor measurement of the ambient temperature is almost not affected by the presence of humans, this information can be used as a reference to detect changes in the environmental conditions. Thus, the depen- dence between the background temperature of the sensing element in position and the ambient temperature is a function , it is possible to compute from . The ana- lysis of the sensor cells and thermistor measurements shows a linear dependence (Figure 4): the average correlation coefficient between and is 0.62, and between and is 0.9. Hence, the function can be ex- pressed as:
(8)
In order to compute that globally minimized the least square errors, it is necessary to collect a great number of samples. In the final implementation of the proposed method, to make the learning period shorter and let the back- ground estimation algorithm work on-line, an approximation of is used [11] . Setting:
(9)
as been computed as it follows:
(10)
where is a time window and means pseudo inverse operation.
Thus, the estimated background temperature is computed as it follows:
(11)
while the residual squares are given by:

Figure 4. Dependence between ambient temperature and filtered sensor cell measure- ments.
(12)
Finally, since the estimation of should involve only the background related measurements, Equation (10) is extended using the analysis of the residual squares:
(13)
3.3. Probabilistic Foreground Detection
In order to provide as much information as possible in uncertain situations, the proposed method also computes for every cell the probability of human detection in every instant. For this reason, we modeled the probability function , describing whether the measurement belongs to the background temperature distribution , as a logistic function:
(14)
where is the steepness of the function and the probability that that measurement does not belong to the background distribution is (Figure 5):
(15)
4. Installation and Results
The proposed method aims to improve the accuracy of Human Detection algo- rithms using LR-TAS data in noisy environments. For this reason, the environ- ment has been perturbed during the experiment using air-conditioning system, appliances, and exposing the sensor to sunlight reflection.
4.1. Sensor Mount
In the literature, there are two opinions on the placement of LR-TAS for human

Figure 5. Modeled probability function for foreground detection.
detection: the wall [12] [13] and the ceiling [9] . After carrying out several expe- riments, it was found that the installation on the wall has several drawbacks:
• Under real condition, furniture and other objects can obstruct the view of the sensor.
• The movement of a human-coming closer and further to the installation point- influences the amount of pixels representing him/her.
• Since the sensor tends to average the value of the temperature in the observed space, human movement also affects the temperature distribution.
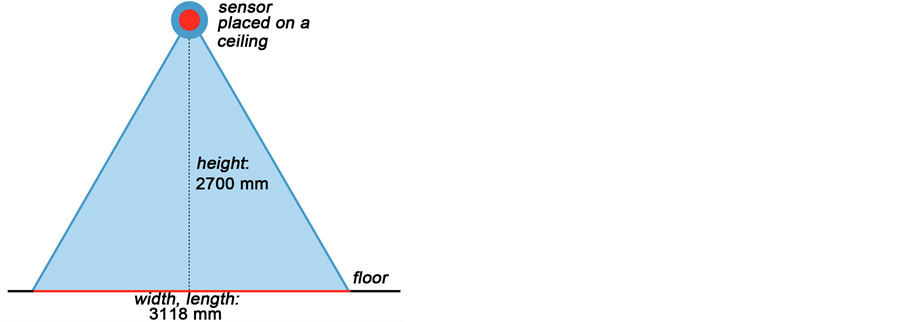
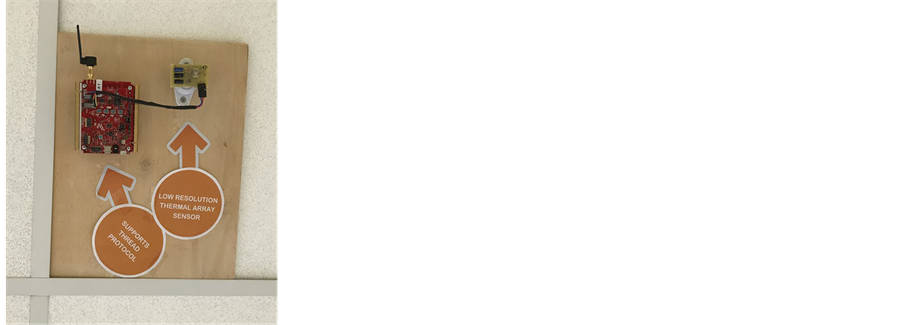
For these reasons, the sensor was mounted on the ceiling at the height of 2.7 m with a resultant detection area on the floor of approximately 9 m2 (Figure 6). Streaming data have been transmitted and stored on a central device. The comun- nication has been implemented using thread protocol [14] : an innovative solution designed by the thread group for IoT applications. This protocol allows to easily create an IPv6, meshed, robust and secure network of sensors.
4.2. Experiments
We have collected several datasets for a total duration of 4 days. During this pe- riod people were asked to perform everyday activities passing and staying under the sensor. The experiment data have been manually annotated to validate the pro- posed algorithm: every pixel is labeled as “1” if it represents human and “0” other- wise.
4.3. Results
The proposed method has been tested on the retrieved datasets. Figure 7(a) shows the performance of the temperature background estimation for a single pixel sen- sor. Comparing it with Figure 7(b), it is visible that where the filtered measure- ments are distant from the estimated background, the probability of human detec- tion is very high.
In order to compare the obtained results with the method that, in our know- ledge, reports the best accuracy value in the literature, we implemented also the
 (a)
(a)
 (b)
(b)
Figure 6. LR-TAS: ceiling installation.
 (a)
(a) (b)
(b)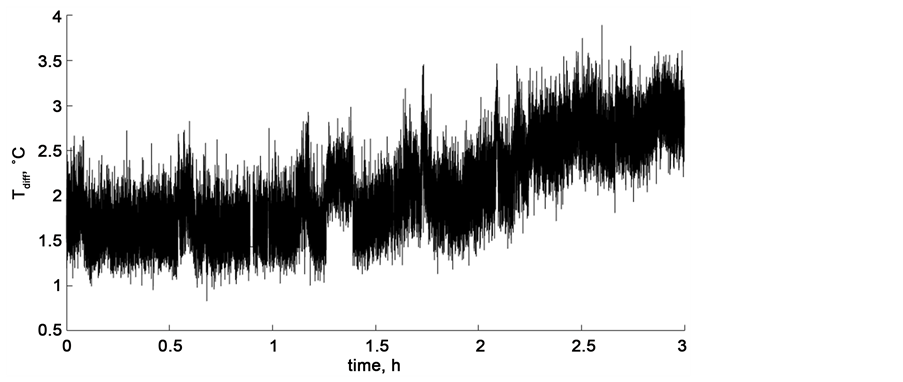 (c)
(c)
Figure 7. Outcome of different steps computed over 3 hours sample data. (a) Background estimation results: original measurements (light gray), measurements obtained after Kal- man Filtering (gray) and the estimated background temperature (black) obtained through Equation (11); (b) The probability of Human Detection computed with the proposed me- thod; (c) as computed with the method by Mashiyama et al.
human detection algorithm proposed by Mashiyama et al. [9] : Figure 7(c) shows computed using the method proposed by Mashiyama. Unfortunately, au- thors do not suggest any method to compute the threshold and it is very di- fficult to manually tune it.
To compare the results of the work of two algorithms, the measurement is said to represent human when a frame contains at least one measurement whose pro- bability . The parameters used in both of the algorithms are pro- vided in Table 1, while the obtained results are presented in Table 2.
The proposed method shows surprising results in terms of precision and recall, proving that it is able to detect humans even in a noisy environment. The me- thod proposed by Mashiyama instead, reports a low recall value since it is missing a lot of detections, which means high false negative value. Moreover, the number of detections (true positive + false positive) is much lower than in the proposed scenario and it is strictly related to the temperature threshold: in this settings Ma- shiyama method obtains a high precision value. The final measure to compare the performance of two methods is given by the ACCURACY measure:
(16)
where TP, TN, FP, FN are: true positive, true negative, false positive and false ne- gative values.

Table 1. Parameters used in the proposed method and Mashiyama et al. method.
Table 2. Comparison between the proposed method and Mashiyama et al. method in de- tecting humans using LR-TAS in a noisy environment.
5. Conclusions
We have presented a novel technique to detect humans in indoor environments using Low Resolution Thermal Array Sensor. This approach considers the tem- perature variation in the room due to external dynamics and noise. A Kalman Fil- ter has been used to filter the noise on the temperature measurements while a back- ground estimation technique aims to separate the background from humans.
Final results show an improvement in the human detection accuracy com- pared with the state of the art when performing a field trial in a real environ- ment passing from 70% to 97%.
Currently, the main limitation of the proposed method is that it is hard to dis- tinguish a human presence from other moving heat sources. Further studies in this direction may improve the human detection accuracy in real smart home envi- ronments, reducing the overall system’s false positive rate.
Finally, the mentioned results have been collected using a single sensor insta- llation, however a multisensor system needs to be implemented in order to set up a real scenario in a smart environment. This extension, which requires to handle tech- nical theoretical problems―from placing the sensors to retrieving one overall model with the global state of dwellers and environment―will be part of our future work.
Acknowledgements
This work was partially financed from project ADALGISA-Regione Lombardia (CUP: E68F13000360009). We thank Dr. Ratti Alessandro from R.S.R. srl (Co- mo, Italy) who provides insight and expertise that greatly assist the research.
Cite this paper
Trofimova, A.A., Masciadri, A., Veronese, F. and Salice, F. (2017) Indoor Human Detection Based on Thermal Array Sensor Data and Adaptive Background Estimation. Journal of Compu- ter and Communications, 5, 16-28. https://doi.org/10.4236/jcc.2017.54002
References
- 1. Nations, U. (2015) World Population Ageing 2015. Tech. Rep., Department of Economic and Social Affairs, Population Division, New York.
- 2. Bierho, I., van Berlo, A., Abascal, J., Allen, B., Civit, A., Fellbaum, K., Kemppainen, E., Bitterman, N., Freitas, D. and Kristiansson, K. (2007) Smart Home Environment.
- 3. Mangano, S., Saidinejad, H., Veronese, F., Comai, S., Matteucci, M. and Salice, F. (2015) Bridge: Mutual Reassurance for Autonomous and Independent Living. IEEE Intelligent Systems, 30, 31-38. https://doi.org/10.1109/MIS.2015.58
- 4. Noury, N., Fleury, A., Rumeau, P., Bourke, A., Laighin, G., Rialle, V. and Lundy, J. (2007) Fall Detection Principles and Methods. 2007 29th Annual International Conference of the IEEE Engineering in Medicine and Biology Society, Lyon, 22-26 August 2007, 1663-1666. https://doi.org/10.1109/IEMBS.2007.4352627
- 5. Panasonic-Grid-Eye: Infrared Array Sensor (2016) https://na.industrial.panasonic.com/products/sensors/sensors-automotive -industrial-applications/grid-eye-infrared-array-sensor
- 6. Sixsmith, A. and Johnson, N. (2004) A Smart Sensor to Detect the Falls of the Elderly. IEEE Pervasive Computing, 3, 42-47. https://doi.org/10.1109/MPRV.2004.1316817
- 7. Erickson, V.L., Beltran, A., Winkler, D.A., Esfahani, N.P., Lusby, J.R. and Cerpa, A.E. (2013) Thermosense: Thermal Array Sensor Networks in Building Management. Proceedings of the 11th ACM Conference on Embedded Networked Sensor Systems, Roma, 11-15 November 2013, 87. https://doi.org/10.1145/2517351.2517437
- 8. Basu, C. and Rowe, A. (2015) Tracking Motion and Proxemics Using Thermal-Sensor Array. arXiv:1511.08166
- 9. Mashiyama, S., Hong, J. and Ohtsuki, T. (2015) Activity Recognition Using Low Resolution Infrared Array Sensor. 2015 IEEE International Conference on Communications, London, 8-12 June 2015, 495-500. https://doi.org/10.1109/ICC.2015.7248370
- 10. Kalman, R.E. (1960) A New Approach to Linear Filtering and Prediction Problems. Journal of Basic Engineering, 82, 35-45. https://doi.org/10.1115/1.3662552
- 11. Hastie, T., Tibshirani, R. and Friedman, J. (2013) The Elements of Statistical Learning. Vol. 1, Springer, New York.
- 12. Gonzalez, L.I.L., Troost, M. and Amft, O. (2013) Using a Thermopile Matrix Sensor to Recognize Energy-Related Activities in Offices. Procedia Computer Science, 19, 678-685. https://doi.org/10.1016/j.procs.2013.06.090
- 13. Jeong, Y., Yoon, K. and Joung, K. (2014) Probabilistic Method to Determine Human Subjects for Low-Resolution Thermal Imaging Sensor. 2014 IEEE Sensors Applications Symposium, Queenstown, 18-20 February 2014, 97-102. https://doi.org/10.1109/SAS.2014.6798925
- 14. Thread Group (2017) Iot Designed Network Protocol. https://www.threadgroup.org/