Journal of Computer and Communications
Vol.2 No.6(2014), Article ID:44599,11 pages DOI:10.4236/jcc.2014.26002
Research and Implementation of Text Similarity System Based on Power Spectrum Analysis
Ying Xie1, Shouning Qu2, Huanhuan Song1
1School of Information Science and Engineering, University of Jinan, Jinan, China
2Information Network Center, University of Jinan, Jinan, China
Email: xiey_2009@163.com
Copyright © 2014 by authors and Scientific Research Publishing Inc.
This work is licensed under the Creative Commons Attribution International License (CC BY).
http://creativecommons.org/licenses/by/4.0/


Received 7 February 2014; revised 5 March 2014; accepted 12 March 2014
ABSTRACT
The paper proposed the research and implement of text similarity system based on power spectrum analysis. It is not difficult to imagine that the signals of brain are closely linked with writing process. So we build text modeling and set pulse signal function to get the power spectrum of the text. The specific detail is getting power spectrum from economic field to build spectral library, and then using the method of power spectrum matching algorithm to judge whether the test text belonged to the economic field. The method made text similarity system finish the function of text intelligent classification efficiently and accurately.
Keywords:Pulsing Signal Function, Power Spectrum Matching Algorithm, Text Similarity System, Text Intelligent Classification

1. Introduction
1.1. Existing Studies
For the text similarity analysis having been paid attention to by the people, there are a lot of researches at home and abroad. In foreign countries, Lambros proposed the method based on surface structure and content of sentence [1] . The text, which is redistricted, is compared with different length using the dynamic programming algorithm. William Taylor uses ontology to measure text similarity and through the use of Word Net vocabulary database, constructing forest content to represent text semantics, and by comparing the different document concept of forest to realize the contrast of text similarity [2] .
Similarly, with the new methods and models emerging in an endless stream, Chinese text similarity also achieved a good result. In recent years, Xiaobo Zheng et al. proposed the algorithm based on the Word Net and generalized vector space model (GVSM), through the length of semantic path and the deep of path computing semantic relatedness [3] . Kui Wu et al. proposed a concept semantic similarity algorithm based on estimation of Bayes [4] . According to the statistical sample, he calculated the posterior parameter of Bayesian estimation and used the semantic similarity algorithm to acquire concept semantic similarity which combined subjective experiences and the objective facts.
1.2. Research Purpose and Structure
So far, the text analysis is established on the quantitative calculation. Under the certain conditions, quantification processing can take advantage of the mathematics to gain its ends. However, it is difficult that the related algorithms get rid of ambiguity in language and sentence, and the inferior results caused by the change of word order, especially the moment with the text rewrote. To solve this problem, the paper proposed a new idea that we set up a text modeling and construct pulse signal function by domain multi-characteristics to obtain power spectrum of the text. We use the power spectrum to distinguish the text similarity. The text similarity system which used the idea finished the function of text intelligence classification efficiently and accurately.
This paper is organized as follows: the first part introduced related works about the system. The second part showed the power spectrum matching algorithm. The third part described the process of the system. The fourth part showed the running results of the system. The last part concluded the whole article.
2. Related Works about the System
2.1. Extract the Eigenvalue
2.1.1. Weight Calculation
Term Frequency Inverse Document Frequency (TF-IDF) algorithm is a classic method to measure weight of the words. Term Frequency is document frequency. And, the more the word item appears in a text, the more relevant with the theme of the text. Noting that there are many specific words that can’t contribute to the text and should be excluded, such as \a", \an". Inverse Document Frequency is the reciprocal of the document, which described the range of application. The main idea is that the words can represent the text theme, must emerge with high frequency in this text, and the most notable is low frequency in other documents. As the classical algorithm, TF-IDF algorithm is widely used in the researching of information processing because of its effectiveness and simplicity [5] . The weight formula is given by as follows [6] .

In the equation,  is the frequency of word
  in text
 ; N is the total number of documents;
  is the number of documents which include word
 ;
;  is a constant, which value usually as 0.01; the denominator is the normalization factor.
2.1.2. Information Entropy
Information is an abstract concept. We usually speak how many or less the information is. In fact, it is hard to say what the number of information is exactly. In 1948, Shannon put forward the concept of “information entropy”, solved the quantization of information, and whose published paper—A Mathematical Theory of Communication—points out that everything exists redundancy. Furthermore, how many or less the redundancy is have something to do with the probability of every symbol (numbers, letters or words) appearing. Shannon sees the average information from the thermodynamic that have excluded redundancy as “information entropy”, and puts forward the mathematical expression for calculating the information entropy [7] .

2.2. Constructing Thesauri
The methods of constructing thesauri consist of using the existing vocabulary, using expert system, automatically building with the knowledge of linguistics and automatically building by co-occurrence analysis. By comparison, we choose the method of automatically building by co-occurrence analysis. The method can convert natural language text data into thesauri quickly, which meets people the requirements of thesauri.
Co-occurrence analysis is a natural language processing technology which uses the method of statistics. It uses three methods to choose words, such as calculating word frequency, calculating interval, using poisson distribution. Co-occurrence analysis technology gets potential semantic relations in the corpus through the theory of knowledge mining and knowledge discovery. The method is often able to find potential knowledge framework in the free text library, which is the lack of artificial construction methods. The paper chooses the method of calculating word frequency.
2.3. Construct the Pulse Signal Function
The paper uses power spectrum to representative a text. In the area of medicine, brain movement can take the shape of brain wave [8] . According to this idea, it is not difficult to think that we are able to take advantage of brain wave to describe the process of writing. Because of the different importance of each word in a text, different brain stimulation consequently generates and then the brain wave is not same. Combined with text eigenvalue, we set text pulse signal function.
The paper select two features randomly that the two-dimensional feature set included, which is weight and information entropy. The weight computed by TF-IDF algorithm represents the importance in the entire economic field. The bigger the weight is, the greater contribution the word makes to the text. Here considered the weight as the effect of amplitude factors. And further, information entropy represents the uncertainty of words. The fuzzier the author writes about the meaning of the words, the smaller the value is and the slower the brain activity is and vice versa.
The moment when the author writing the word, the brain wave will have amplitude to some degree and the pulse signal function will have a process of reduction with the writing continued. Supposing that the word is not used again in the process of writing, the stimulation to the brain will tend to disappear, which is similar to the exponential function . Every word in the text has a process like this. So the word pulse signal function defined as the following equation.

In the equation,  is the strength of the pulse signal;
  is the weight;
  is the information entropy; x is the sequence of word. Over lapping pulse signals of all the words, the text pulse signal come into being.

In the equation, y is the whole text pulse signal;  is the weight;
  is the information entropy; x is the sequence of word.
2.4. The Method of Power Spectrum Analysis
There are many methods to analyze power spectrum, such as direct method or indirect method with continuous signal, classic power spectrum estimation or modern power spectrum estimation with discrete signal. By comparison, we use the PBURG function which is in the method of modern power spectrum to acquire the power spectrum. The variance of the method is smaller and the method is strong operability. The form as follows: . In this equation, y is the text pulsing signal function. P is the order of AR model. fs is the sampling frequency. Nfft is the length of fft algorithm. xpsd is the power spectral estimation of function y. F is frequency vector [9] [10] .
3. Power Spectrum Matching Algorithm
3.1. The Basis of Matching
Before you begin to format your paper, first write and save the content as a separate text file. Keep your text and graphic files separate until after the text has been formatted and styled. Do not use hard tabs, and limit use of hard returns to only one return at the end of a paragraph. Do not add any kind of pagination anywhere in the paper. Do not number text heads—the template will do that for you.
Finally, complete content and organizational editing before formatting. Please take note of the following items when proofreading spelling and grammar:
Assuming the function ,
,  , called the equation
 , Defining field is
 . If the distance bigger than the threshold, the two function are similar. The expression like this:
 . If not, they are not similar [11] [12] . Of course, in this paper,
  and
and  are the power function which can gained the power spectrum by MATLAB. We can obtain the area surrounded by subtracting one function from another
 . Then curving fitting to
  and through integral with it to gain the area that surrounded by the two functions as the basis of text similarity.
3.2. Power Spectrum Matching Algorithm
The algorithm has three steps. There are gaining the values from domain vocabulary, gaining the power spectrum of the text according to pulse signal function and matching the power spectrum of the text.
Step 1: gain the values from domain vocabulary
For i←0 to FDocument.length ‘FDocument is table to store segmentation text f←FDocument.get (i).getFContentSeg () ‘gain the split words of each text fdc []←f.split(",")
For n←0 to fdc.length If fieldword.wordfdc [n]
Then weight←fieldword.weight Then entropy←fieldword.entropy Output (weight)
Output (entropy)
Else execute fdc[n+1]
Step 2: gain power spectrum of text according to pulse signal function
Input (weight)
Input (entropy)
y←0 For i=0 to n Yi←weight (i)*exp-(x/entropy (i))
y←y+Yi EndFor Output(y)
[ps,f]=pburg(y,order,nfft)‘gain the power spectrum Plot (ps,f)‘build spectral library
Step 3: match the power spectrum of the text
For j=0 to m ‘m as the number of test text’s power spectrum For i=0 to n ‘n as the number of power spectral in the library

Dist=int (f(x), a,b) ‘distance of two power spectrum EndFor EndFor If dist<ε
Then output (“matching success”)
Else output (“matching failed”)
EndIf End Matching algorithm of power spectrum
3.3. The Flow Chart of Power Spectrum Matching Algorithm
The flow chart of power spectrum matching algorithm is shown in Figure 1.
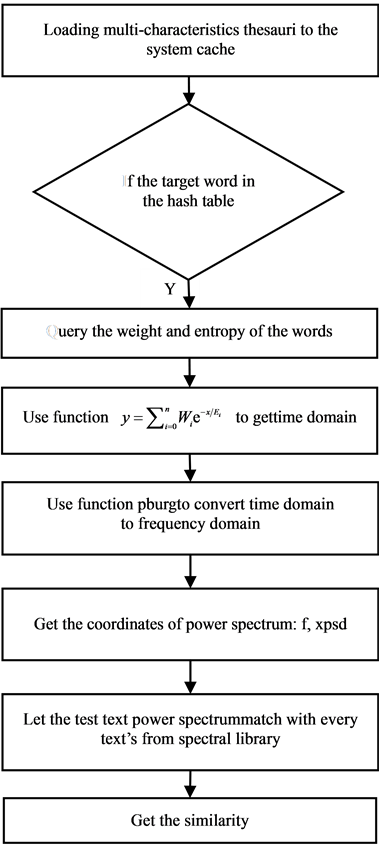
Figure 1. The flowchart of the power spectrum matching algorithm.
4. The Implementation of Text Similarity System
4.1. The Architecture of the System
The text similarity system use the theory discussed above to finish the function of text intelligent classification. The architecture of the system is made up with six modules. The six modules are document upload, word segmentation, eigenvalue extraction, thesauri construction, eigenvalue query and power spectrum analysis. Among them, power spectrum analysis module includes calculating coordinates of power spectrum, drawing power spectrum and matching power spectrum. The system adopts three mainstreams Web Framework Struts Spring and Hibernate which based on J2EE architecture. In the framework, Struts take charge of the presentation layer, completing page displaying and answering user’s requirements, Spring takes charge of business logic, completing the business logic and management of application programs, Hibernate takes charge of data persistence layer, completing interactive with the database. By this we can solve some problems brought by the high complexity of the system structure, such as the coupling degree of codes, the maintenance of the application system, and the reusability of the components. We import Java bytecode file compiled by Matlab to solve the problem that it is hard to acquire accurate and large dataset from Java Runtime Environment. The whole system flow chart is shown in Figure 2.
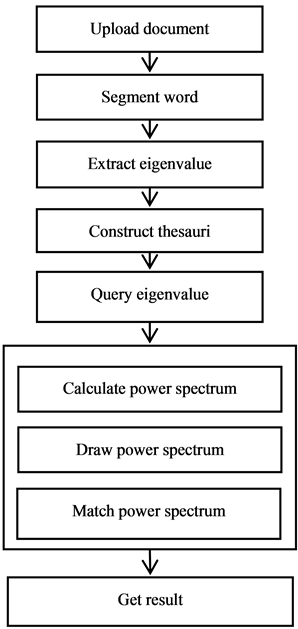
Figure 2. The whole system flowchart.
4.2. Text Processing
4.2.1. Document Analysis
We use the jQuery framework as the front presentation layer and the Struts framework as the background controller layer in the system. In order to achieve the throughput capacity of large file upload, the front layer uses the SWF-Upload component. The uploaded documents are accepted by the Struts upload component, and then Classified by the document classifier according to suffix type. After classification, the document classification decision component will decide which analysis component is to analyze the target document. At last, the results of the target document will be stored in database.
1) SWF-Upload component: this component is used to put all the files which the client has submitted into the file upload queue. When the files in the queue are processed by background server, the SWF-Upload component will refresh the front page and alert client some information.
2) The document classification component and the text analysis component: These two components are used to choose the corresponding strategies and text parse component according to the file type.
3) The document parser component: this component is used to parse PDF documents with the PDF parser; parse the DOC documents with the word extractor; and parse the DOCX documents with the POI-XML text extractor.
Different classification platforms for different documents have efficiently avoided the problem caused by different types of documents. At the same time, it effectively solves the garbled situation due to different system platforms. The flow chart of document analysis is shown in Figure 3.
4.2.2. Word Segmentation
The system uses the biggest positive matching algorithm based on Chinese word segmentation dictionary. The main idea is as follows: the algorithm firstly defines a max possible string length m and then sequentially scans the string from the first character. If it is found in the Chinese word segmentation dictionary, the system will output the word until successfully traversing the string. The system is always doing the same until traversing the
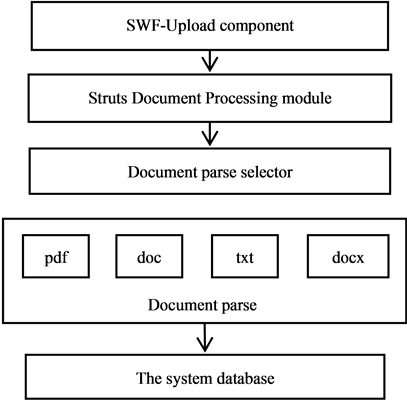
Figure 3. The flowchart of document analysis.
whole text. The method is easy to complete and has lower time complexity. Aiming to improve the efficiency and accuracy of word segmentation, when starting server container, we load the Chinese word segmentation dictionary into system cache with the data structure of Hash Table. The flow chart of word segmentation is shown in Figure 4.
4.2.3. Eigenvalue Extraction
In order to improve the running speed of the system, we have to construct thesauri for extracting eigenvalue. When constructing thesauri, we load the words into the system Cache in the type of Hashtable. In the Hashtable, the key is the word in the thesauri; the value is the corresponding weight and information entropy. The structure is like this: . The module is made up with thesauri construction and eigenvalue query.
First we structure thesauri and then we put all the characteristic words into it. All of the characteristic words are Composed of weight and entropy of the word which we calculate the value through a large number of field text template. When the server starts, All the words’ weight and entropy will be loaded the to the system cache as the data structure of hash table. We define the global variable hash table the form is: field Word Hash Table . In this global variable field Word Hash Table, the key value is the word text value in the thesaurus, the value set is composed of the word weight and entropy. Because of quick search of hash table; we search the word’s weight and entropy and then store the document feature information into the corresponding database. The program flow chart is shown in Figure 5.
4.3. Power Spectrum Analysis
4.3.1. Drawing Power Spectrum
In order to reduce the variance of power spectrum, we get the discrete signal pulse and then use the PBURG function to acquire the power spectrum. The form as follows: [xpsd, f] = pburg(y, p, Nfft, fs, ‘half’) [xpsd, f]. In this equation, y is the text pulsing signal function. P is the order of AR model. fs is the sampling frequency. Nfft is the length of fft algorithm. xpsd is the power spectral estimation of function y. f is frequency vector.
This system takes advantage of high performance computing ability of Matlab to do the complex formula and large database. In the stage of power spectrum analysis, each Chinese word weight and entropy are bound as arrays, and these arrays will be passed as spectral parameters to the matlab workstation. After a sequence of calculation in matlab workstation, we will get the coordinates of power spectrum. Then the system stores the results to the corresponding database. The flow chart of power spectrum calculation process is shown in Figure 6.
4.3.2. The Implementation of Power Spectrum Matching Algorithm
Assuming the function ,
,  , called the equation
 , Defining
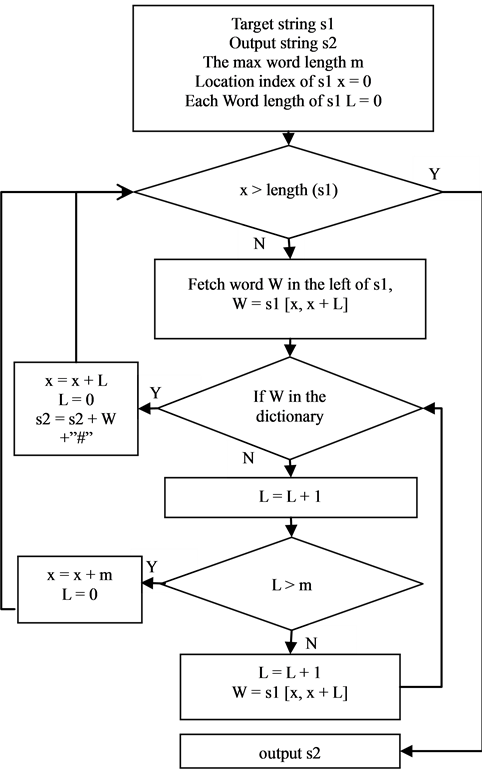
Figure 4. The flowchart of word segmentation.
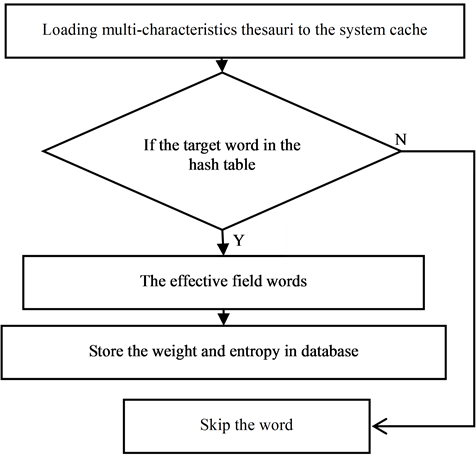
Figure 5. The flowchart of eigenvalue extraction.
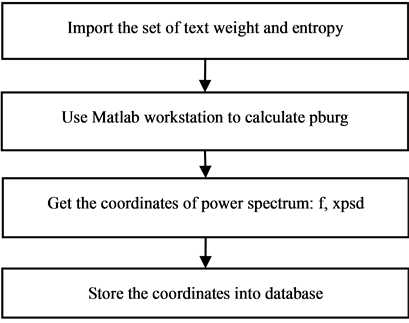
Figure 6. Power spectrum calculation process.
field is . If the distance bigger than the threshold, the two function are similar. The expression like this:
 . If not, they are not similar. In the system we use the type of Big-Decimal in Java language as the high precision data computing type. The Fitting function domain is [0.0, 3.1416], the step size of X axis is 0.0015, The Implementation of the code are as follows:
1) For i=0 to 3.1416; the domain of i is [1, 3.1416], step length is 0.0015 2) f1(x) =data1.getY (); ‘f1(x) is the power spectrum of text under test 3) f2(x) =data2.getY (); ‘f2(x) is the power spectrum of sample text 4) F(x) =abs (f1(x)-f2(x)); ‘f(x) is the difference value of two line 5) Set
8) For j=0 to Set
5. Running Results of the System
The system have realized intelligent classification for more than 20 areas, such as economic, education, computer, literature, art, environment, legal, medical, sports. We use the economic field as an example to introduce the running results of the system.
In the experiment, we randomly extracted 800 documents as the test set which includes 600 from economic field which is used to build spectral library and 200 test text among 50 from economic field and 150 from noneconomic field. Let the test text power spectrum match with every text’s from the field spectral library, forming a two-dimensional spectral matching threshold table. It is obvious that every text matching with the spectral library will emerge a threshold sequence, and then we get rid of its isolated points and get its average of these points which determines the final threshold. If the final threshold achieve larger, all of the spectra can match, which lead to the false acceptance rates in higher; On the contrary, if the final threshold achieve smaller, it will produce larger false rejection rate. Through the analysis of experimental data, the final thresholdε is 10.0844. Table 1 showed a part of experiment dates.
We select two tested text randomly, and one from the economic field, the other from other field. Let them match with the same text from the spectral library. The running results of the system as follows.
This is the result of matching the two curves. As we can see in the Figure 7, the two peaks mainly concentrate in the signal frequency 1.25 and 2.50. The peak value represents the text energy. The higher the peak value is, the stronger the text energy is. We are easy to make text analysis in the two frequencies. The red one is an

Table 1. Two-dimensional spectral matching threshold.
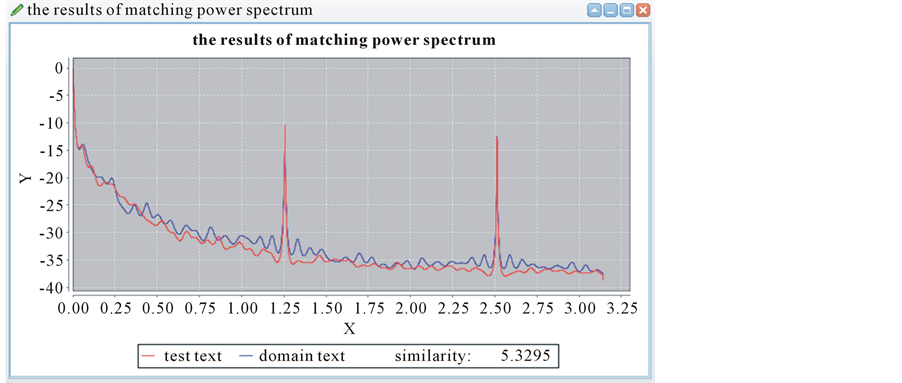
Figure 7. The curve matching both from economic field.
economic field text waiting to be measured, and the blue one is randomly selected from the spectral library. Through the picture above, we can see that the similarity of the two texts is 5.3295, and the value 5.3295 < e = 10.0844. We can determine that the text belongs to the economic field.
This is the anther result of matching two curves. As we can see in the Figure 8, the two peaks mainly concentrate in the signal frequency 1.25 and 2.50. The peak value represents the text energy. The higher the peak value is, the stronger the text energy is. We are easy to make text analysis in the two frequencies. The red one is noneconomic field waiting to be measured, and the blue one is randomly selected from the spectral library. Through the picture above, we can see that the similarity of the two texts is 15.0693, and the value 15.0693 > e = 10.0844. We can determine that the text doesn’t belong to the economic field.
In addition, the limitation of the system is when the test text is so short and the domain test is so long or the test text is so long and the domain test is so short, the system will appear inaccurate matching result. Finally, the experimental results are in the 200 texts, 180 texts can correctly judge the field. The system accuracy is 90%. False rejection rate is 10%.
6. Conclusion
The paper uses the method of power spectrum analysis based on text eigenvalue to get the text similarity. The
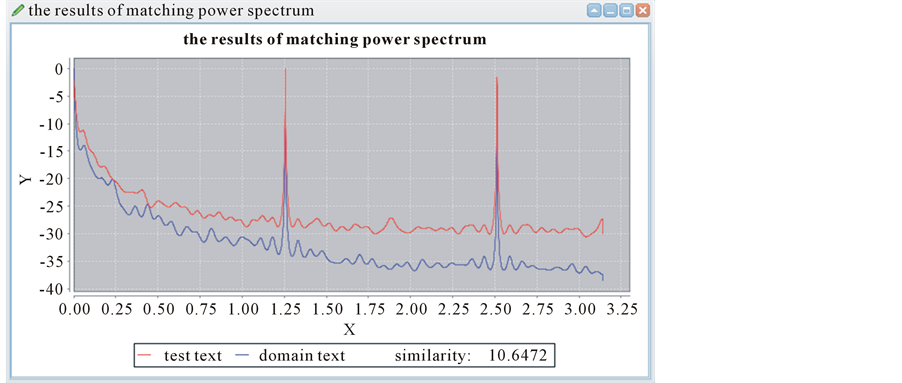
Figure 8. The curve matching from different fields.
process is that we use word weight and entropy to set pulse signal function, and then get power spectrum of each text. These power spectrums will be saved as spectral library. When meeting a test text, we can get the text similarity by the power spectral matching algorithm to judge which field the text belongs to. The method not only gets rid of ambiguity in language, but also avoids the error caused by the change of the word order. The system based on the method has efficiently realized intelligent classification for more than 20 areas, such as economy, education, computer, literature, art, environment, legal, medical and sports.
References
- Lambros, C., Harris, P. and Stelios, P. (1994) A Matching Technique in Example-Based Machin Translation. In: Proceedings of COLING’94, Association for Computational Linguistics, Stroudsburg, 100-104.
- Taylor, W. and Wang, J.Z. (2007) Concept Forest: A New Ontology-Assisted Text Document Similarity Measurement Method. In: 2007 ACM International Conference on Web Intelligence, Fremont, 2-5 November 2007, 395-401.
- Xiong, C.G. and Tian, H. (2010) Improved Text Similarity Model Based on Page Rank Value. Network Security Technology and Application, 30, 23-25.
- Wu, K. and Zhou, X.Z. (2010) Concept Semantic Similarity Algorithm Based on Bayesian Estimation. Journal of Chinese Information, 24, 52-57.
- Charniak, E. (2011) The Brain as a Statistical Inference Engine—And You Can Too. Computational Linguistics, 37, 643-655.
- Zhang, M.M., Qu, S.N. and Du, T. (2013) Subject Thesaurus Automatic Construction Based on Multidomain Distribution Entropy. Journal of Computational Information Systems, 9, 3485-3492.
- Turney, P.D. and Pantel, P. (2010) From Frequency to Meaning: Vector Space Models of Semantics. Journal of Artificial Intelligence Research, 37, 141-188.
- Zhou, J.G. and Luo, X.S. (2008) The Study and Analysis of EEG Features. Master’s Thesis, Guangxi Normal University, Guilin.
- Chen, H.J. (2004) Digital Signal Processing. Higher Education Press, Beijing, 266-299.
- The Center Research of Feisi Science and Technology (2005) The Auxiliary Signal Processing Technology and Application by MATLAB. Electronic Industry Press, Beijing, 293-328.
- Alon, E. and Fan, Q.F. (2007) Curve Matching, Time Warping, and Light Fields: New Algorithms for Computing Similarity between Curves. Journal of Mathematical Imaging and Vision, 27, 203-216.
- Zhu, J. (2008) A New Curve Research on Similarity Criterion. Master’s Thesis, Wuhan University of Technology, Wuhan.