Spectral Analysis Review
Vol.2 No.3(2014), Article ID:48374,9 pages
DOI:10.4236/sar.2014.23024
The Puzzle of the La I Lines 6520.644 Å and 6519.869 Å
Laurentius Windholz1, Bettina Gamper1, Przemysław Głowacki1,2, Jerzy Dembczyński3
1Institut für Experimentalphysik, Technische Universität Graz, Graz, Österreich
2Laboratory of Quantum Engineering and Metrology, Faculty of Technical Physics, Poznań University of Technology, Poznań, Poland
3Institute of Control and Information Engineering, Faculty of Electrical Engineering, Poznań University of Technology, Poznań, Poland
Email: windholz@tugraz.at
Copyright © 2014 by authors and Scientific Research Publishing Inc.
This work is licensed under the Creative Commons Attribution International License (CC BY).
http://creativecommons.org/licenses/by/4.0/
![]()
![]()

Received 10 May 2014; revised 16 June 2014; accepted 7 July 2014
Abstract
The strong La line 6520.644 Å is present in a Fourier Transform Spectrum (signal to noise ratio of 240), but its wavelength in commonly used tables (e.g. [1] ) is given as 6520.770 Å, while in [2] the wavelength is given as 6520.74 Å, unclassified, with the remark “h” (hazy). The line could not be classified using known energy levels of the La atom (La I) and its first ion (La II). It appears as a single broadened peak. By a combination of laser optogalvanic spectroscopy, laser-induced fluorescence and Doppler-reduced saturation spectroscopy we could introduce a new even parity La I energy level, 35449.041 cm−1, J = 13/2, with hyperfine (hf) constants A = −8.0(5) MHz, B = 10(10) MHz. For a second, up to now unknown neighbouring La I line (wavelength 6519.869 Å) we introduced another even parity energy level involved in the formation of the line, 41207.994 cm−1, J = 13/2, A = 91.6(5) MHz, B = 170(50) MHz. We tried also to explain why in old tables the wavelength given was so different.
Keywords:Lanthanum, Energy Levels, Laser Spectroscopy

1. Introduction
Our group is performing systematic investigations of the hyperfine (hf) resolved spectrum of the La atom (atomic number 57), more precisely on the stable isotope La139 (natural abundance 99.91%). This isotope has nuclear spin quantum number 7/2 [3] , a magnetic dipole moment µI = 2.7830455(9) µN and a small electric quadrupole moment Q = 0.20 (1) × 10−28 m2 [4] . Its energy levels show nice hyperfine splitting which can be used as finger print for the corresponding level.
Final goal is a theoretical description of the levels with respect to configuration and designation of the La levels. Since by far not all theoretically expected levels are experimentally known, experimental effort to find the missing levels is necessary.
In order to gain information on up to now unknown energy levels, we investigate spectral lines which can not be explained as transitions between already known energy levels. An accurate determination of the energy of the atomic levels is connected with accurate determination of transition wavelengths; for this we use a wave number calibrated Fourier-transform (FT) spectrum. First results based on this spectrum are already published, together with results of laser spectroscopic investigations [5] -[9] . Sometimes unclassified strong lines can be found in the FT emission spectrum. In this paper we report on investigations of two of them. Figure 1 shows a part of the FT spectrum investigated here.
2. Experiment
The FT spectrum, its features and its calibration is described in detail in Ref. [7] . Here we describe the methods applied in laser spectroscopic investigations.
For laser spectroscopic investigations we use the setup shown in Figure 2. Tunable narrow-band (1 MHz) laser light is produced by a combination of an Argon-ion laser and a dye ring laser, working with dye DCM. The laser light frequency can be either set fixed to a strong hf component or scanned over the hf pattern of the investigated spectral line. In the latter case, the change of the laser light frequency is documented by recording the transmission signal of a calibrated marker etalon (free spectral range 197.6 MHz).
Free La atoms are produced in a see-through hollow cathode discharge. The cathode, 20 mm long, has a hole of 3 mm in diameter; its inner wall is made of La. The anodes are made of Al. The discharge is operating with Ar at ca. 0.3 mbar pressure. Immediately after starting the discharge works only with Ar atoms, but within some minutes La atoms are sputtered from the inner wall of the cathode, and these atoms participate in the discharge. Finally most of the discharge processes take place in La vapour, and the La spectral lines dominate. This can be observed visually since the discharge increases its intensity and changes its colour from blue-grey to brilliant white.
The laser beam, adapted in diameter by lenses forming a telescope, is passing through the hollow cathode lamp and changes the detailed equilibrium of the processes in the discharge. However, these changes are small,
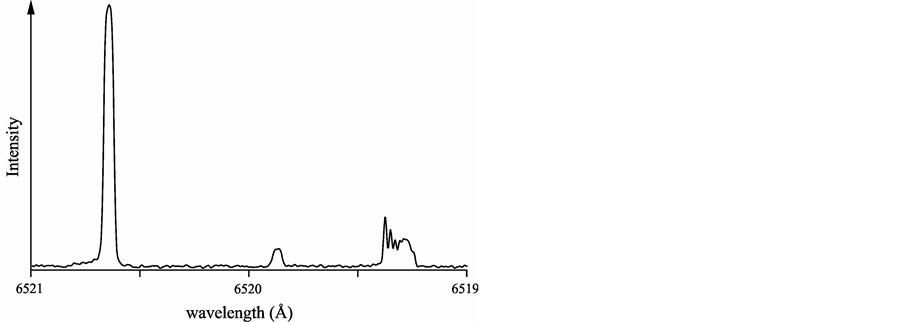
Figure 1. Part of the FT spectrum. The left line, 6520.644 Å (SNR 240), is an unclassified line, well known but given as 6520.770 Å in spectral tables [1] . The right line, 6519.319 Å (SNR 46), is mentioned in [1] as 6519.345 Å. The line inbetween, 6519.869 Å, is surprisingly not contained in tables [1] [2] , but clearly visible in an emission spectrum taken by ourselves with help of a 1 m grating spectrograph (compared to Figure 6). Also this last line could not be classified using known levels.
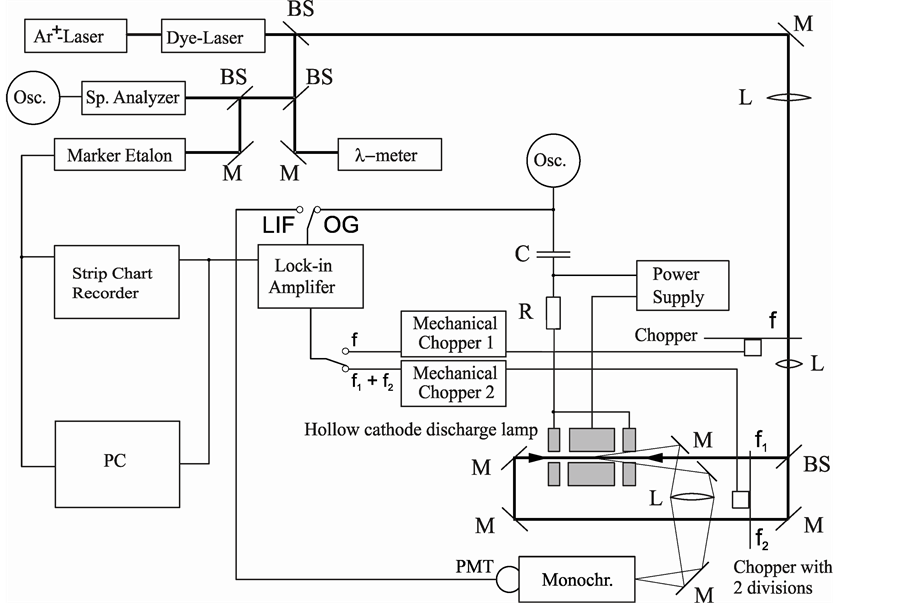
Figure 2. Setup for laser spectroscopic investigations. BS beam splitter, M mirror, L lens, f chopper wheel with frequency f, PMT photomultiplier (Hamamatsu R955), LIF laser-induced fluorescence, OG optogalvanic signal.
and for observation we need to chop (mechanical chopper 1) the laser light and to amplify the signals by a phase-sensitive device (Lock-In amplifier). Detecting the change of the discharge resistance we obtain a so-called optogalvanic (OG) signal. For identifying levels involved in an excitation process, we have to detect laser-induced fluorescence (LIF) signals. For this, the emission light of the discharge is imaged to the entrance slit of a monochromator, which selects one special spectral line on which the intensity is modulated with the chopper frequency.
In most cases, for the investigation of spectral lines only one pass of the laser light through the hollow cathode discharge is used. In this case, the hf components of the lines are detected Doppler-limited (FWHM ca. 800 MHz), and for lines having a widely split hf structure the hf constants A and B of the involved energy levels can be determined without difficulties.
For spectral lines showing an hf pattern, which is only partly resolved in a Doppler-limited recording (or when a high accuracy of the hf constants is desired), we perform saturation spectroscopy: the laser beam is divided into two beams of similar intensity by a beam splitter in front of the discharge. The mechanical chopper 1 is not used; instead of it we use a special chopper 2 which modulates both beams with frequencies f1 and f2, respectively, having a fixed phase relation to each other. As synchronizing signal, the sum frequency f1 + f2 is fed to the Lock-In amplifier. The beams then intersect the hollow cathode lamp counterpropagating. In this way, a Doppler-reduced line profile can be recorded, if there is a non-linear signal response to the laser light intensity (saturation spectroscopy). The saturation signal can be recorded again either as an OG signal or as a LIF signal.
3. Investigation of the Line 6520.644 Å
In the FT spectrum, the line λ = 6520.644 Å has a signal to noise ratio (SNR) of 240. It is mentioned as 6520.770 Å in spectral tables [1] and as 6520.74 Å, unclassified, with remark “h” (hazy) in ref. [2] . Excitation of this line with laser light caused a quite strong Doppler-limited optogalvanic signal (Figure 3) with excellent signal to noise-ratio (SNR). In fact, by chopping the exciting laser light the whole discharge was modulated with
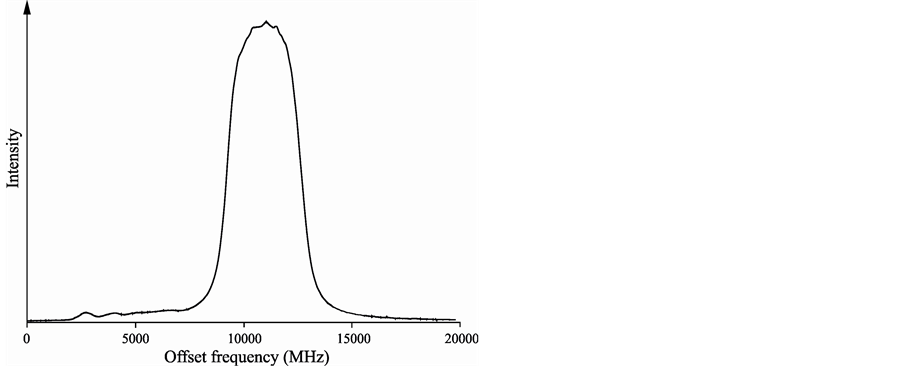
Figure 3. Optogalvanic scan of the line 6520.644 Å. On the left side, there is a blending transition (explanation see part “Check of wavelength accuracy of literature values”). The ripples on the top of the curve stem from irregularities of the discharge current.
high current amplitude, and thus we observed laser-induced fluorescence signals from all strong spectral lines of Ar and La. The recorded line profile showed a single peak with full width at half maximum (FWHM) of 3.5 GHz (see Figure 3) but was not suited to say much concerning the angular moments and hf constants of the involved levels, since the hf components are not resolved. But due to the good SNR, we could conclude that such shape without any components in the line wings, can only be obtained if the hf constants A of both involved levels are quite small (below 100 MHz), and if the angular moments of the involved levels have high values.
A schematic level scheme is shown in Figure 4. For observing the OG signal shown in Figure 3, we had to adjust the phase of the Lock-In amplifier accordingly to the phase of the wheel of chopper 1. The discharge current increases when the laser light is on. The same is true for the intensity of a direct fluorescence line (f in Figure 4): it increases, since the interaction of the laser light with the atoms causes a higher population of the upper level of the excited transition. When an observed LIF line has its maximum intensity at opposite phase of the Lock-In amplifier (compared to the optogalvanic signal or a direct fluorescence line), we call it a “negative” fluorescence line (nf in Figure 4). That means, such line is originating from a level which is depopulated by the laser light and which might serve as the lower level of the excited transition. If a level is depopulated in strong way by laser excitation, neighbouring levels can transfer population to the laser excited one by collisional energy transfer, and give rise to indirect “negative” lines (nf’ in Figure 4).
In our case no direct fluorescence lines (f) were observed, all strong LIF lines were “negative” lines. Since it was not possible to decide which “negative” decays occur directly or indirectly, by adding the corresponding transition energy to all the identified levels a number of hypothetical upper levels was generated. Most of these levels could be ruled out since it was not possible to simulate the spectrally small observed structure using the hf constants of the known lower levels. Also from these considerations we came to the conclusion, that only levels having high angular moments (J ³ 11/2) and quite small hf constants A (A £ 100 MHz) can act as lower level of the investigated transition.
In order to gain more information concerning the hf constants of the involved levels, we applied Doppler-reduced saturation spectroscopy. The observed hf pattern is shown in Figure 5, trace a, together with the result of the fit (trace b) and the position of the hf components. For optimizing the spectral resolution (the line components finally were fitted assuming Lorentzian profiles with 300 MHz FWHM), the current of the discharge had to be reduced to ca. 50 mA, while usually in the Doppler-limited case we use 90 - 100 mA. Nevertheless, the optogalvanic saturation signal had a suitable signal to noise ratio.
For the hf structure in Figure 5 we obtained the minimum least squared error sum assuming the upper level having J = 11/2, A = 10 MHz or J = 13/2, A = 8 MHz, while for the lower level we got J = 11/2, A = 60 MHz. Then we searched if one of the observed strong fluorescence lines has an upper level with J = 11/2 and an
Figure 4. a) Schematic level scheme. e transition excited by laser light. f direct fluorescence line. nf direct “negative” fluorescence line (phase of the Lock-In amplified signal opposite to the phase of line f). cpt collisional population transfer; the transition rules for parity and J are not valid here. Nf’ indirect (collisioninduced) “negative” fluorescence. Identification and classification of line nf allows to identify the lower laser-excited level. b) The situation after solving the puzzle. Only one indirect “negative” fluorescence line is shown.
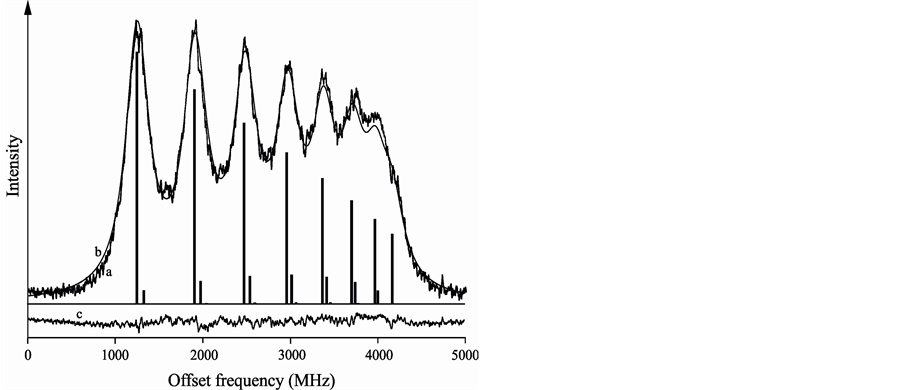
Figure 5. Saturation OG spectrum of the line 6520.644 Å. Trace a) experiment; trace b) fitted curve, assuming a Lorentzian line profile; trace c) residual. Positions and theoretical intensities of the hf components are shown as bold lines.
A-factor close to 60 MHz. Indeed, this condition was fulfilled for the line 6249.913 Å (transition from level 20117.368 cm−1, odd, J = 11/2, A = 60 MHz to the lower level 4121.572 cm−1, J = 9/2, A = 489.534(1) MHz, B = 32.180(34) MHz (values from Ref. [10] )).
Following our previous considerations, we assumed that the level 20117.368 cm−1 is the lower level involved in the investigated line. Adding the centre of gravity (cg) wave number of the line (15331.672 cm−1) to this energy, we obtained a new, up to now unknown even parity energy level at 35449.040 cm−1.
Further it turned out that the hf constant of the level 20117.368 cm−1, acting as lower level of the excited transition, was known only with relatively large uncertainty. In order to increase the accuracy, we performed saturation spectroscopy on the line 6249.913 Å, too. Since the hf constants of the lower level are known from atomic beam magnetic resonance spectroscopy [10] with high accuracy, we determined for level 20117.368 cm−1: A = 60.4(5) MHz, B = 100(10) MHz.
Taking these now more accurately determined A-values as fixed values in the fit procedure, the hf constants of the new level could be determined with satisfying uncertainty. As can be seen in Figure 5, trace c, no systematic deviations between fitted and observed hf patterns occurred.
Finally, based to theoretical treatments, we came to the conclusion that the new upper level involved in formation of the line λ = 6520.644 Å has angular momentum 13/2 and is the lowest possible level with J = 13/2. The energy was determined to be 35449.040 cm−1, and for the hf constants we obtained A = −8.0(5) MHz, B = 10(10) MHz.
If we introduce a new level, normally we try to confirm its existence by at least one further laser excitation. Unfortunately this is not possible for this level caused by its high angular momentum: besides 6520 Å, no further possible excitation wavelength in the range of our lasers (690 - 550 nm) exists. If we assume J = 11/2, a possible excitation at 6125.85 Å is calculated, but when we investigated this line, no LIF-signal at 6520 Å was observed. This observation supports the assumption J = 13/2.
Fortunately one line in the FT spectrum supports the existence of 35449.041 cm−1: this level explains a line in the infrared region at 14908.421 Å, with respect to wave number and hf pattern.
4. Check of Wavelength Accuracy of Literature Values
As can be noticed in Figure 3, there is another line in the low-frequency wing of line 6520.644 Å, having an OG signal quite weak compared to the main peak. It appears in our FT spectrum with S/N ratio 5. Setting the laser frequency to the highest hf component of this line, we observed fluorescence at 5740 Å, again with phase opposite to the OG signal. From this line we identified the level 20082.989 cm−1 as the lower level of the laser-excited transition, and as upper level, the well-known level 35414.441 cm−1. The observed structure corresponded nicely with the calculated pattern, using the J-values and hf constants of both combining levels, and we determined a cg wavelength 6520.735 Å. Please note that the upper levels of both lines, 6520.644 and 6520.735 Å, have nearly the same energy, thus one would assume that both upper levels are populated in the discharge in equal way, independent on the fact that one can not assume a Boltzmann law for the population since we may have a non-equilibrium low pressure gas discharge.
Nevertheless, even if we assume that the intensity ratio of both lines is different under changed experimental conditions, it is hard to see why in the tables [1] [2] the wavelength differs so much from our value. Of course, the old photographic spectra were not hyperfine-resolved and thus the cg wavelength is difficult to determine. To check, to which extent the wavelength is influenced by the calibration and high resolution of the FT spectrum, we recorded the emission spectrum of our discharge by a 1 m grating spectrograph (Yobin-Yvonne, HR1000), using a grating with 1200 lines/mm. The spectrum in comparison with the FT spectrum is shown in Figure 6.
In order to have a feeling on the accuracy of wavelengths, we investigated the most neighbouring line mentioned in the tables. In [1] we find 6519.343 Å, while in [2] this line is not contained. Taking into account the hf structure of the line and having thus a better possibility to find the cg wavelength, we determined 6519.319 Å, different to the old value only by 0.024 Å. This small difference may be explained by the possibility to determine the cg wavelength with higher accuracy in an hf-resolved spectrum. An uncertainty of the same order of magnitude one should expect also for the neighbouring, stronger line, but not a difference of 0.126 Å. Thus it remains unexplained why in [1] instead of 6520.644 Å a wavelength of 6520.770 Å and in [2] a value 6520.74 Å are given.
5. Investigation of the Line 6519.869 Å
As mentioned earlier, between the known lines 6520.644 Å and 6519.319 Å there is another line, 6519.869 Å, neither mentioned in [1] nor in [2] , but clearly visible in our spectra (see Figure 1 and Figure 6). When we tuned the laser wavelength to the line, we observed—similar to the excitation of 6520.644 Å—a huge number of fluorescence lines. Scanning the laser frequency over the line in the Doppler-limited set-up, the hf structure appeared unresolved in the OG signal. Thus we applied also for this line saturation spectroscopy and we were able to resolve the hf pattern nicely (see Figure 7).
Again we found that the structure can be simulated only assuming combining levels which have high angular momentum and low A-values. Among the fluorescence lines we found the line 6266 Å, which had as its upper level 25874.500 cm−1, odd parity, A = 46.6(20) MHz [11] . The phase of this line was opposite to the OG signal.
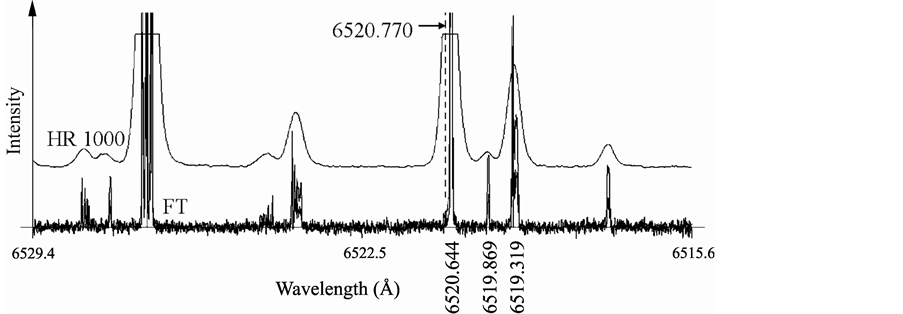
Figure 6. Comparison of the FT spectrum with an emission spectrum taken by a 1 m grating spectrograph (HR 1000, grating 1200 lines/mm). 6520.770 Å is clearly not in the center of the peak in the monochromator spectrum. Between the lines 6520.644 Å and 6519.319 Å clearly the new line 6519.869 Å is visible in the FT and in the monochromator spectrum.
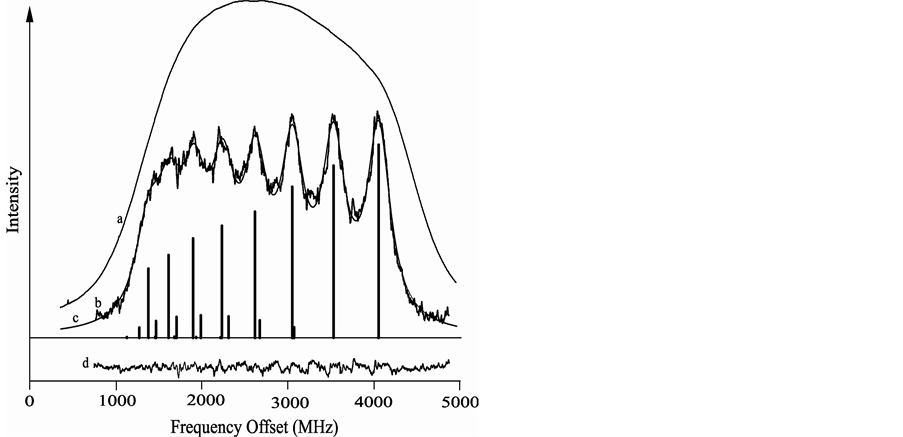
Figure 7. The line 6519.869 Å. Trace a) Doppler-limited OG signal; trace b) Doppler-reduced OG signal; trace c) fit result; trace d) residual.
Assuming this level as the lower level of the laser excitation, we obtained a new level with energy 41207.994 cm−1, parity even, A = 93 MHz. Then we investigated also the line 6266 Å using saturation spectroscopy in order to get more accurate hf constants of the level 25874.500 cm−1.
The new upper level involved in formation of the line λ = 6519.869 Å has J = 13/2, energy 41207.994 cm−1, A = 91.6(5) MHz, B = 170(50) MHz.
These assumptions are supported by lines in the FT spectrum: level 41207.994 cm−1 explains the spectral lines 6108.319 Å and 7673.103 Å, which were well known but unclassified. Moreover, excitation of 6108.319 Å revealed the expected hf pattern and did lead to LIF signals at 6519 and 7673 Å.
All investigated lines treated in this paper and their classifications are summarized in Table1 Columns 1 - 3 contain information on the spectral line: wavelength in air, comment and SNR in our FT spectrum. Columns 4 - 8 deal with properties of the (new) upper level: angular momentum J, parity, energy, hf constants A and B. Columns 9 - 14 contain information on the lower level: angular momentum J, parity, energy, hf constants A and B, and a reference to the hf constants of the lower level. Finally, in column 15 a remark is given (Explanations of the abbreviations, see table caption).

Table 1. Spectral lines investigated in this study.
Column 2: Comment: e excited line, f observed as fluorescence line after excitation of the upper level of the transition, FT line identified in the FT spectrum, but not excited and not observed as fluorescence line; Column 3: Signal to noise ratio (SNR) in the FT spectrum. - line not noticeable; Columns 5 and 10: Parity of the level; Column 13: - B not reliably determined, assumed to be zero; Column 14: Reference to the hf constants of the lower level (columns 12 and 13). t.w. this work; Column 15: Remark: f and wavelength: LIF observed as decay of the upper level of the excited transition, nf and wavelength: LIF signal observed on a decay line from the lower level, OGS investigated by optogalvanic saturation spectroscopy, DL investigated by Doppler-limited spectroscopy.
6. Conclusions
During this study, we discovered two new levels of the neutral lanthanum atom:
35449.040 cm−1, even parity, 5d2(3F)6d 4H, J = 13/2, A = −8.0(5) MHz, B = 10(10) MHz, and 41207.994 cm−1, even parity, 5d2(1G)6d 2I, J = 13/2, A = 91.6(5) MHz, B = 170(50) MHz.
Further we have improved the hf constants of the ground levels involved in the investigated transitions:
Level 20117.368 cm−1: A = 60.4(5) MHz, B = 100(10) MHz (no literature value available) and Level 25874.500 cm−1: A = 44.0(5) MHz, B = 168(10) MHz (old values: A = 46.6(20), B assumed to be zero, see Ref. [11] ).
The wavelength discrepancy between the value 6520.644 Å and 6520.770 Å [1] could not be explained, but we suspected a typing error (might be 0.670 instead of 0.770). At wavelength 6519.858 Å, one finds in [1] an Nd line instead of our La-line 6519.869 Å. This might be the reason why the latter La-line was not mentioned in [1] .
From theoretical point of view, the discovery of the new J = 13/2 levels was very important, since 35449.040 cm−1 is the lowest level having this angular momentum quantum number, and 41207.994 cm−1 supports the calculations with respect to wave number and hf constant A.
The paper also shows that for solving difficult classification problems, a combination of all available spectroscopic techniques is necessary.
Acknowledgements
This work was partially supported by The National Centre for Science Poland under the Project No. N519 650740.
References
- Harrison, G.R. (1969) Wavelength Tables. Massachusetts Institute of Technology, The M.I.T. Press, Cambridge, Massachusetts, and London, England
- Meggers, W.F., Corliss, C.H., and Scribner, B.F. (1961) National Bureau of Standards Monograph 32. Part I, U.S. Government Printing Office, Washington D.C.
- Anderson, O. (1934) The Nuclear Mechanical Moment of Lanthanum from Hyperfine Structure. Physical Review, 45, 685. http://dx.doi.org/10.1103/PhysRev.45.685
- Raghavan, P. (1989) Table of Nuclear Moments. Atomic Data and Nuclear Data Tables, 42, 189-291. http://dx.doi.org/10.1016/0092-640X(89)90008-9
- Nighat, Y., Raith, M., Manzoor, H. and Windholz, L. (2010) Investigation of the Hyperfine Structure of Lanthanum lines by a Laser-Induced Fluorescence Technique. Journal of Physics B: Atomic, Molecular and Optical Physics, 43, 125001. http://dx.doi.org/10.1088/0953-4075/43/12/125001
- Gücelcimen, F., Siddiqui, I., Basar, B., Kr?ger, S. and Windholz, L. (2012) New Energy Levels and Hyperfine Structure Measurements of Neutral Lanthanum by Laser-Induced Fluorescence Spectroscopy. Journal of Physics B: Atomic, Molecular and Optical Physics, 45, 135005. http://dx.doi.org/10.1088/0953-4075/45/13/135005�
- Güzelcimen, F., Ba?ar, G?., Tamanis, M., Jarmola, A., Kruzins, A., Ferber, R., Windholz, L. and Kr?ger, S. (2013) High-Resolution Fourier Transform Spectroscopy of Lanthanum in Ar Discharge in the Near-Infrared. The Astrophysical Journal Supplement Series, 208, 18. http://dx.doi.org/10.1088/0067-0049/208/2/18�
- Siddiqui, I., Shamim, K., Gamper, B., Dembczyński, J. and Windholz, L. (2013) Optogalvanic Spectroscopy of the Hyperfine Structure of Weak La I Lines: Discovery of New Even Parity Fine Structure Levels. Journal of Physics B: Atomic, Molecular and Optical Physics, 46, 065002. http://dx.doi.org/10.1088/0953-4075/46/6/065002
- Gamper, B., G?owacki, P., Siddiqui, I., Dembczyński, J. and Windholz, L. (2014) New Even Parity Fine Structure Levels of the Lanthanum Atom Discovered by Means of Optogalvanic Spectroscopy. Journal of Physics B, in Press.�
- Childs, W.J. and Goodman, L.S. (1971) Hyperfine and Zeeman Studies of Low-Lying Atomic Levels of La139 and the Nuclear Electric-Quadrupole Moment. Physical Review A, 3, 25.
- Furmann, B., Stefańska, D. and Dembczyński, J. (2007) Hyperfine Structure Analysis Odd Configurations Levels in neutral Lanthanum: I. Experimental. Physica Scripta, 76, 264 http://dx.doi.org/10.1088/0031-8949/76/3/010
- Ba?ar, Gü., Ba?ar, G?. and Kr?ger, S. (2009) High Resolution Measurements of the Hyperfine Structure of Atomic Lanthanum for Energetically Low Lying Levels of Odd Parity. Optics Communications, 282, 562-567. http://dx.doi.org/10.1016/j.optcom.2008.10.048�