World Journal of Engineering and Technology
Vol.2 No.1(2014), Article ID:42601,10 pages DOI:10.4236/wjet.2014.21002
Evaluation of Low Saline “Smart Water” Enhanced Oil Recovery in Light Oil Reservoirs
1University of Regina, Regina, Canada
2Faculty of Engineering, University of Tripoli, Tripoli, Libya
Email: *ezeddin.shirif@uregina.ca
Received 5 October 2013; revised 4 November 2013; accepted 12 November 2013
ABSTRACT
With the depletion of natural driving forces responsible for pushing the oil from reservoirs & dec-lination of oil recovery after secondary stage, the emphasis is now on EOR techniques. The low sa-line flooding is a type of EOR which gains the attention of researchers due to its easiness to use implications, less cost & environment-friendly nature. Though the low salinity effect has been seen in various labscale core flooding experiments as well as field pilot projects, the mechanism which actually leads to this enhancement in recovery is still the area of research among researchers which is wide open and needs to gain consensus. Seeing the wide mechanisms taking place under different scenarios, it is certain that more than one mechanism is actually supplementing each other in reducing the residual oil saturation while LSW flooding. This study has been undertaken investigations on the low saline flooding in unconsolidated Ottawa sandpack cores with two dif-ferent, Weyburn & Pelican crude oil, to find out the optimum salinity, LSW Slug Size & underlying mechanisms during LSW flooding. Several core flooding experiments were performed under sec-ondary as well as tertiary recovery stage by unsteady state method. With the reduction of brine salinity from 5000 PPM to 1500 PPM, the oil recovery increased in secondary stage & decreased further upon reduction in salinity to 500 PPM gaining the peak at 1500 PPM. Small enhancement in tertiary recovery of 2.24% observed upon switching to 1500 NaCl PPM brine after injection of formation brine in secondary stage for Weyburn Oil, though large tertiary recoveries of the or-der of 9.95% for effective oil viscosity of 4 cP and 7.32% for 29.7 cP were observed for n-dodecane diluted Pelican Oil. LSW slug size of 25% pore volume was found to be effective in producing Weyburn Oil in secondary stage.
Keywords:Low Saline Flooding; EOR; Slug Size; Relative Permeability; Secondary Flooding

1. Introduction
With the decline of recovery from conventional oil reservoirs & limitations of finding new conventional oil pool, the petroleum researchers are focusing on new low-cost, environment-friendly EOR techniques to sweep the residual oil left behind by secondary recovery. Low saline waterflooding is a kind of EOR techniques which by decreasing the injection of water salinity (1000 - 5000 PPM) & choosing the specific composition of ions, residual oil saturation could be diminished by a significant amount in tertiary recovery stage and more importantly in secondary recovery stage, at the early-start life of a reservoir. This LSW recovery has been proven in field [1-4] as well as in laboratory coreflood [5-12] tests simultaneously by several researchers. Several studies in the last two decades have showed that selecting the low salinity and particularly ionic composition can improve oil recovery by affecting the oil/brine/rock interfaces, occurrence of multicomponent ion exchange, reduction in interfacial tension, pH reduction cum in-situ saponification, clay migration, wettability alteration, double layer expansion, emulsion formation, thus enhancing the microscopic displacement efficiency and decreasing the residual oil saturation left behind by secondary flood. Though the enhanced recovery by low saline flooding has been proven, the mechanism of this phenomenon which actually leads to enhancement is still debatable as other researchers observed different phenomenon leading to recovery. Several researchers have undertaken studies to quantify this behavior of enhancement of recovery simultaneously in sandstone and carbonate laboratory core-flood experiment and found different ionic concentration, composition & temperature affecting it. Though low saline flooding has been proven widely, there are instances that investigators do not observe any enhancement in tertiary recovery [3,9]. In the current study, several coreflooding experiments were performed under secondary & tertiary recovery stage to determine the optimum salinity, enhancement in recovery by decreasing salinity, slug size & mechanism affecting low saline waterflooding in unconsolidated Ottawa sandpack cores with two different, Weyburn & Pelican crude. Relative permeability curves were plotted for experiments using graphical technique by Jones & Roszelle (1978) [13]—SPE 6045 to find out the wettability state of sandpack.
2. Material Used
Two different crude oils has been used under this study, Weyburn Oil (9.5 cP) & Pelican Oil, where the pelican oil is diluted with laboratory grade reagent n-dodecane in the ratio of 1:1 & 1.5:1 to get a effective crude oil of viscosity 4 cP & 29.7 cP respectively. The physical & chemical property of the weyburn crude oil is mentioned in table 1 [14]. Weyburn formation water (22,775 PPM) has been used for initial saturating the sandpack & classified as high salinity water. Brines of different salinity was made with laboratory grade NaCl with high quality RO water (~4 TDS) in the range of 500 - 50,000 to be used in sandpack flooding experiments. All the brines used for experimentation was characterized first by measuring pH, conductivity (S/m), viscosity (cP) & density (gm/cc). Table 2 shows the characterization details of all the brines used in this study. Ottawa sand has been used in this study for packing in core.
3. Experimental Apparatus
Model 500 D syringe pump & D series pump controller which is been supplied by ISCO has been used in this study to inject the respective brines. The oil viscosities are measured at ambient conditions through DV-II + Pro viscometer supplied by Brookfield where the temperature is maintained through water bath & Digital Polystar temperature controller supplied by Cole-Parmer. The crude oil is first centrifuged by using Model Benchmark 2000 centrifuge; LAB-01130; supplied by L-K Industries Inc., Houston, Texas. The weights of different salts are measured digitally through Mettler PM 4600 Digital weight meter to prepare the brines. The pressure drop across the core is measured through Heise, PM Indicator transducer. Brines pH & conductivity is measured through pH/ION/COND Meter supplied by HORIBA for characterizing brine before each experiment. All brines
Table 2. Characterization details of all the brines used in this study.
are thoroughly stirred after preparation through Cole-Parmer Stirrer at 40 Deg C & later cooled down to ambient conditions before using in each experiment. HANNA HI 4522 Metre & HI 76312 probe is used to measure the TDS (PPM) value of the formation water. Anton Paar DMA 4500 Density Meter supplied by 10201 Maple Leaf Court, Ashland VA 23005 has been used to find out the individual brine density. Cannon CT-500 Series II & Cannon calibrated viscometer Ubbelohde has been used to find out the brine viscosities used in this study. Figure 1 shows the schematic diagram of experimental set up used in this study.
4. Experimental Procedure
The sand pack core holder is first packed with Ottawa sand using the standard procedure prescribed for core flooding. The core is then fully saturated with formation water to find out the porosity of the sandpack. Once the core is fully saturated the flow rate is increased in steps measuring the pressure drop across core to find out the absolute permeability using Darcy’s law which was found to be 4.013 D. After finding out the absolute permeability the formation water is stopped & crude oil is imbibed through different transfer cylinder to reach the connate water saturation. Next in the secondary stage experiment particular strength NaCl brine is imbibed at the flow rate of 0.7 ml/min through third transfer cylinder and oil is produced initially followed by a mixture of oil & water after breakthrough. This NaCl brine is imbibed until the sandpack pore volume is flooded with 3 PV which has been used as the reference for comparison. While in the Tertiary stage experiments first the sandpack is flooded with high salinity formation water (22,775 PPM) until the oil stops flowing which takes around 7 - 10 PV followed by low salinity brine of 1500 PPM to visualize the low salinity effect. The flooded fractions are simultaneously collected in the graduated test tubes which are later centrifuged in the Centrific Model 228 supplied by Fisher Scientific. The average pressure drop is noted down for each collected fraction which is later used for plotting Relative Permeability curves using the graphical technique mentioned by Jones & Roszelle (1978) [13] SPE 6045. The corresponding fraction of oil & water collected upon injection of low salinity brine is then tabulated and percentage recovery curve is plotted against PV of brine injected. To analyze the effective slug size of low salinity brine three experiments were conducted where 0.25, 0.5 & 1 PV of low salinity
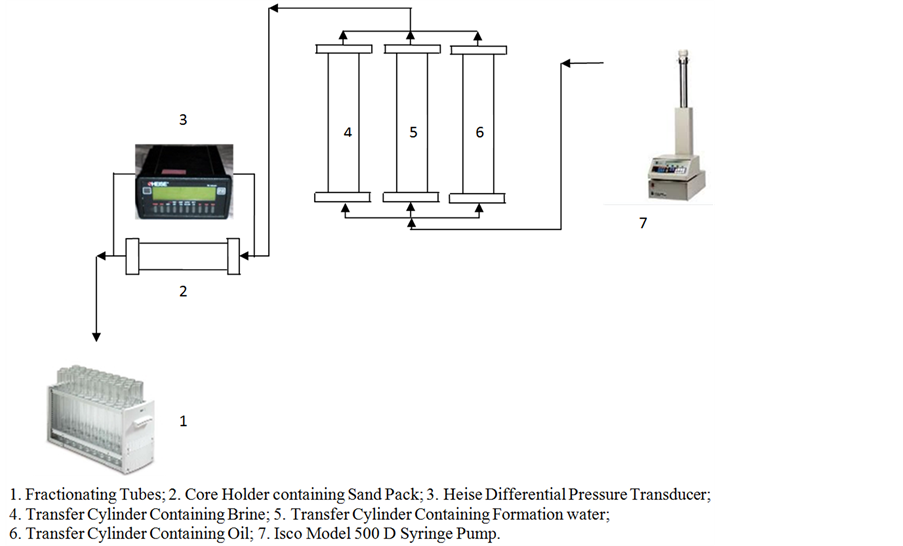
Figure 1. Schematic diagram of experimental set up used in this study.
brine (1500 PPM) is injected first followed by 2.75, 2.5 & 2 PV of RO water respectively in the secondary recovery stage. To analyze the low salinity enhanced oil recovery not oil dependent, Pelican oil is also used in the tertiary stage experiment where the original viscosity of pelican oil is diluted with Laboratory grade n-dodecane in the ratio of 1:1 & 1.5:1 (pelican oil:n-dodecane) to form effective oil of viscosity 4 cP & 29.7 cP respectively.
5. Results & discussion
5.1. Secondary Waterflooding
5.1.1. Weyburn Oil
The secondary waterflooding with different concentration NaCl brines, FW & RO water brought different recoveries presented in table 3. Recovery percentage curves at the end of 3 PV with various NaCl brines, RO, FW & diluted FW is shown in figure 2. An interesting trend has been observed upon decreasing the NaCl brine concentration from 5000 to 1500 PPM where the secondary oil recovery at the end of 3 PV is enhanced from 64.58% to 74.98% marking a rise in recovery of 10.4% though observed 2% - 8% OOIP by Gamage & Thyne (2011) [15]. This recovery later falls from 74.98% to 72.24% upon decreasing the NaCl brine concentration further from 1500 PPM to 500 PPM. This trend shows us the LSW optimum concentration of NaCl ions which changes the wettability state from more oil-wet to water-wet state. A high recovery of the order of 71.54% is observed at 50,000 PPM NaCl brine concentration which is unusual since the recoveries actually increase with the decrease in brine concentration but the thing to be noted that the injected brine 50,000 PPM is 2.2 times the connate brine salinity & none of the researchers before shown the effects where extra high salinity brine is injected into high salinity connate brine core. This high recovery point out towards a different interfacial phenomenon acting which is actually different from the LSW. The recovery with 22,775 PPM formation water is higher than any brine excluding 1500 PPM optimum concentration indicating that it’s the presence of different salt ions in FW which actually helps make the Ottawa sand more water wet than only NaCl. RO water has also acted well in brining recovery at 3 PV of the order of 71.94% but which is only 0.4% higher than 50,000 PPM but lesser than other brines used in this study. The high recovery of the order of 73.73% obtained by Injecting Formation water brine of 22,775 PPM in the sand pack where the connate brine is also of the same quality is actually 21.94% higher than the recovery seen by Morrow & Buckley [16] where by Injecting High Salinity (HS)
Table 3. Showing the type of brine concentrations used for Run 1 - 9, the individual porosity, connate water saturation, pore volume & secondary recovery achieved at the end of 3 PV Injection.
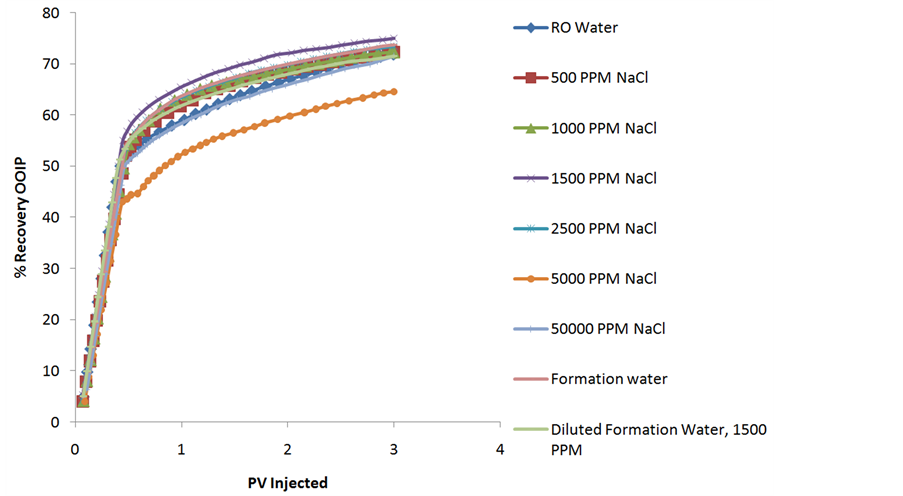
Figure 2. Showing the % recovery at the end of 3 PV with different concentrations of NaCl brine used from 500 - 50,000 PPM, RO, FW & diluted FW.
brine in HS connate water core gave 50% OOIP. Morrow & Buckley (2011) didn’t mentioned anything about the recoveries obtained by injecting Low Salinity (LS) brine in MS connate water core & extra high salinity brine in HS connate brine cores. A standard comparative order of 3 PV is chosen for Injection in Secondary recovery stage as most of the oil recoveries are obtained in this range [8]. Interestingly the maximum recovery obtained at the optimum Low salinity brine concentration of 1500 PPM is in the range observed by Cissokho et al. (2010) (2500 - 1000 PPM), Idowu et al. (2011) [17], Zhang & Morrow (2006) [18] where they observed the highest recovery at 1500 PPM NaCl brine in tertiary recovery stage. All these recoveries have been obtained in clay free Ottawa sand pack but the presence of clay is beneficial on other occasion as seen by other researchers.
5.1.2. Relative Permeability Curves
Relative Permeability curves have been plotted for each secondary flooding experiment performed under 3 PV Injection condition shown in Figure 3. The relative permeability curves have been plotted using Graphical technique explained by Jones & Roszelle (1978) [13], SPE 6045. Different equations have been used described in the paper & graphs were plotted. The graphs were then later fitted with befitting equations to find out the slopes at different cumulative pore volumes of brine injected, giving finally the values of kro & krw at different saturation of water at the outlet of core, Sw (outlet). From the relative permeability figures it has been noticed that the intersection of kro & krw shifts to the extreme right 0.61 at the optimum NaCl brine concentration of 1500 PPM where the secondary recovery after 3 PV of brine injection is maximum. This shifting of intersection point clearly indicate towards the resulting sandpack becoming more water-wet in case of 1500 PPM NaCl brine facilitating high permeability of residual oil. From the intersection of relative permeability curves it has been concluded that the intersection point starts shifting to the extreme right 0.61 with decrease in brine concentration from 5000 PPM to 1500 PPM & then starts decreasing from 0.61 to 0.56 as the brine concentration is reduced further from 1500 to 500 PPM.
5.1.3. Comparison of 1500 PPM NaCl Brine with Diluted FW 1500 PPM Brine
In the figure 4 the overall % recovery with 1500 PPM NaCl brine at 3 PV which is 74.986 (OOIP) is compared against % recovery with 1500 PPM diluted formation brine at 3 PV equivalent to 71.47 (OOIP). The two recovery curves overlaps for the initial part but the % Recovery with 1500 NaCl PPM Brine overtakes for the latter region giving the ultimate recovery to be %74.986 OOIP. The recovery by NaCl Brine is 3.51% higher than diluted FW brine compared at 3 PV of brine Injection. This curve shows the effectiveness of single ion (NaCl) brine over multi-ion composed diluted formation brine. Thus low salinity EOR is also dependent on the constituent of the brine rather than just the total dissolved solid (TDS) of the brine. It has been Inferred from the curve where the connate brine is the formation water of 22,775 PPM & the injected brine is diluted formation water of order 1500 PPM is less effective than 1500 NaCl brine by 3.51%.
5.2. Tertiary Recovery
5.2.1. Weyburn Oil
Tertiary stage experiment is conducted on Ottawa sand core plug first by injecting high salinity formation water (FW), 22,775 PPM brine in the secondary recovery stage till no more oil is produced. After injecting 5.71 PV of high salinity FW brine an oil recovery of 81.06% OOIP is achieved & where oil ceases to flow. To make sure that no more oil flows the flooding rate is increased from 0.7 ml/min to 1.5 ml/min where an additional 0.48% OOIP is recovered by injecting 0.135 PV of FW. The flow rate is further increased from 1.5 ml/min to 3.0 ml/min whereby an additional 0.137% OOIP is produced by injecting 0.252 PV additional FW. Thus at the end of 6.1 PV of FW injection the recovery reached the maximum limit of 81.68% OOIP even after increasing flow rate. This is followed by low salinity brine of 1500 PPM where 1.02 PV of brine is injected further to produce tertiary recovery of 2.24% OOIP giving a total recovery of 83.92% at the end shown in figure 5. The observed tertiary recovery of the order of 2.24% OOIP is less compared to other researchers who have obtained tertiary recoveries of the order of 10% OOIP while decreasing brine salinity from 50,000 PPM to 1000 PPM [8] but in range with 2% - 18% obtained by lager et al. (2006) for 18 reservoir sandstones and Skrettingland et al. (2010) [3]. This may be due to the fact that the FW (high salinity) used in our case is already of the order of 22,775 PPM which is more than half in concentration of the high salinity brine used in Cissokho experiments thereby giving high recoveries in the secondary stage itself. Moreover Cissokho experiments were performed at moderate temperature of 35 Deg C as in our case they were performed at room temperature of 22 Deg C. A sharp rise in recovery of 2.27% is observed at 3.53 PV where recovery already reached 75.53% is due to the fact the experiment is stopped at this point & restarted after few hours due to operational constraints building pressure again & pushing the additional oil out of sandpack.5.2.2. Pelican oil ~4 cP & Pelican Oil ~29.7 cP
Higher low salinity effect has been seen in the diluted Pelican Oil giving a tertiary recovery of 9.95% for effective oil viscosity of 4 cP and a tertiary recovery of 7.32% for effective oil viscosity of 29.7 cP shown in figure 6. Interestingly up to 95.26% oil was recovered by switching from secondary to tertiary recovery stage for diluted Pelican Oil with 29.7 cP effective viscosity. In fact 87.94% oil was recovered even in the secondary recovery stage by injecting 11.32 PV of formation brine (22,775 PPM). The oil flow was continuous though decreasing up to 11.32 PV. This wasn’t observed for the Weyburn Oil where oil ceases to flow after injecting 6.1
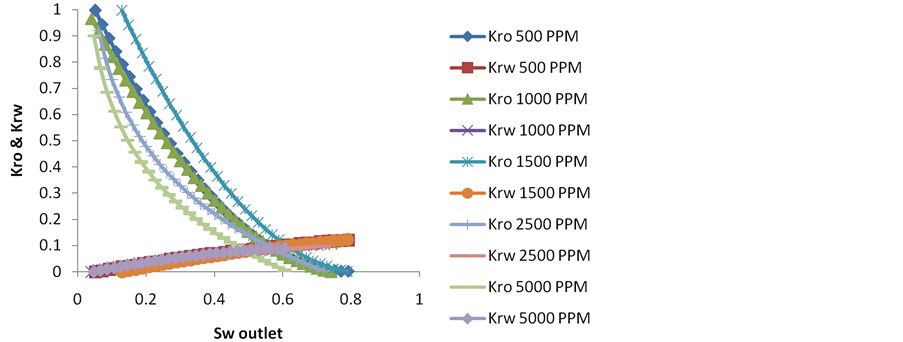
Figure 3. Showing the relative permeability curves for different brines used in secondary recovery mode.
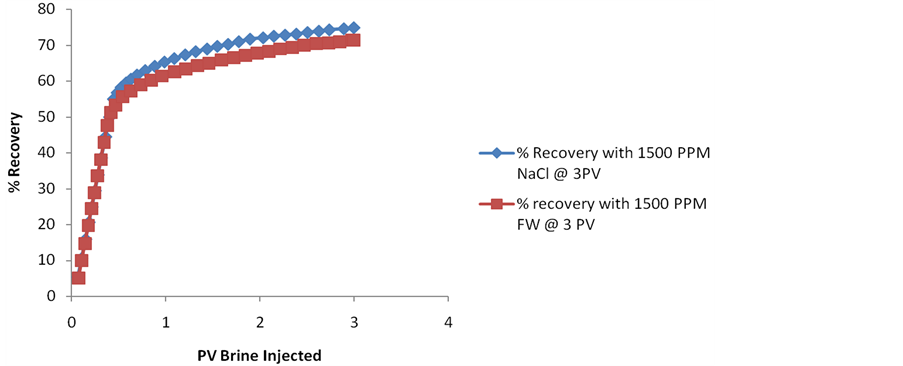
Figure 4. % Recovery comparison of 1500 PPM NaCl brine with diluted FW 1500 PPM brine.
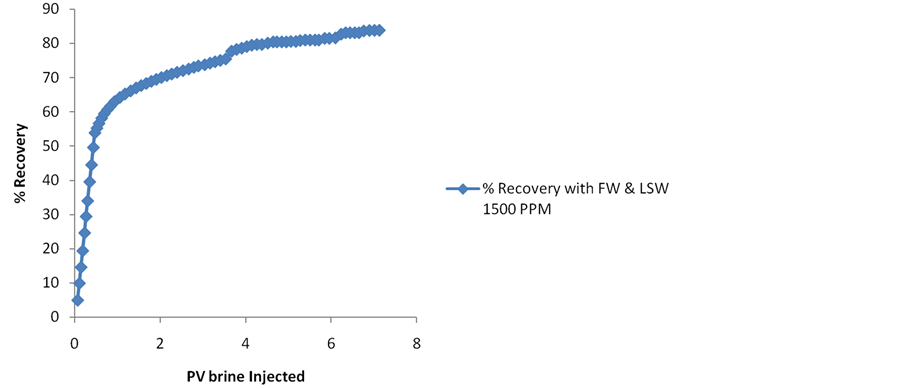
Figure 5. % Recovery with FW (6.1 PV) used first in secondary recovery mode & followed by 1500 PPM NaCl brine (1.2 PV) in tertiary recovery mode.
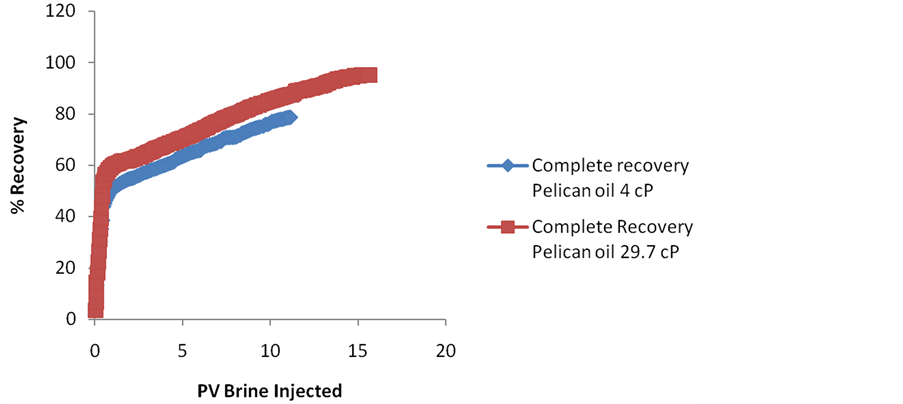
Figure 6. Complete % recovery with FW used first in secondary recovery mode for Pelican Oil diluted with n-dodecane in the ratio of 1.5:1 (29.7 cP) & 1:1 (4 cP) followed by 1500 PPM NaCl brine in the tertiary recovery mode.
PV of formation brine giving a secondary recovery of 81.69%. This may be due to higher molecular weight by drocarbons present in Pelican Oil which takes longer time to produce but could be produced with formation water & NaCl brine.
5.3. Slug Size Analysis
Seeing the recovery curves for 0.25 PV 1500 PPM brine initial slug followed by 2.75 PV RO water, 0.75 PV 1500 PPM brine initial slug followed by 2.7 PV RO water and 1 PV 1500 PPM brine initial slug followed by 2.75 PV RO presented in Figure 7 it was found that the ultimate recovery after injecting combined 3 PV of brine is maximum in case of 0.25 PV initial 1500 PPM NaCl brine slug of the magnitude of 73.73% followed by 0.5 PV, 1500 PPM NaCl brine giving 72.89% recovery & was the least in the case of 1 PV, 1500 PPM NaCl brine initial slug where only 68.51% OOIP was recovered. Seccombe et al. [2] from BP single-well tracer tests at Endicott field located on the north slope of Alaska concluded that a slug of 40% by pore volume is quite significant for recovery & project economics instead of continuous low saline water injection. Though in our case 25% pore volume slug size was better than 50% slug size giving 0.84% OOIP higher recovery & 5.22% OOIP higher recovery than 100% slug size low saline Injection. Seeing the increase in cost by almost double while going from 25% pore volume slug size to 50% slug size & the decrease in recovery it has been concluded that 25% pore volume slug size is most effective from recovery & project economics point of view.
6. Conclusions
• The presence of clay is not necessary to see the low salinity effect as clay free Ottawa sand pack gives an enhancement in tertiary recovery of 2.24% by switching to 1500 PPM NaCl brine after injecting formation brine.
• Thus presence of different clays is only a positive addition supporting the overall low salinity mechanism making the surface much wetter, but it is not necessary to see the effect.
• The 1500 PPM NaCl brine is the most effective among compared brines for secondary recovery at the 3 PV injection criteria.
• The effective oil recovery increases upon decreasing NaCl brine salinity from 5000 PPM to 1500 PPM & decreases upon reducing the salinity to 500 PPM.
• Higher low salinity effect has been seen in the diluted Pelican Oil. This wasn’t observed for the Weyburn Oil where oil ceases to flow after injecting 6.1 PV of formation brine giving. This may be due to higher molecular weight hydrocarbons presented in Pelican Oil which takes longer time to produce but could be produced with formation water & NaCl brine.
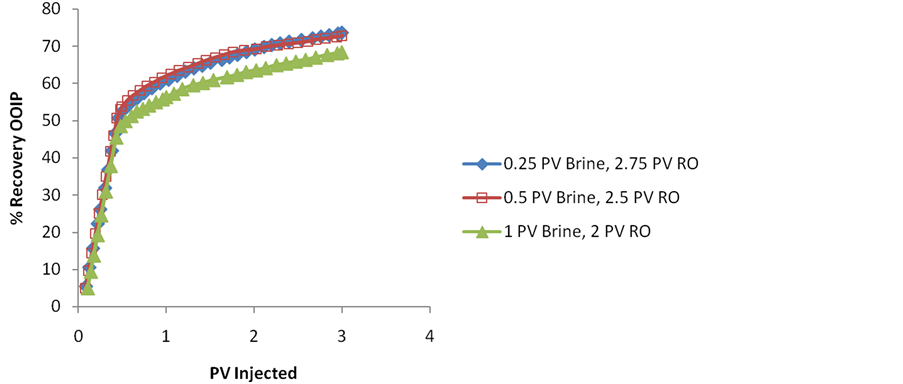
Figure 7. Comparing the effective slug size of 0.25, 0.5 & 1 PV NaCl followed by RO water upto 3 PV (pore volumes) for % recovery OOIP.
• NaCl brine of 1500 PPM is more effective in producing higher recovery as compared to 1/15 times diluted formation water brine.
• Examining the effect of slug size, it has been concluded that 25% pore volume slug size is the most effective compared to other slug size of low saline water injection.
• The secondary recovery at the end of 3 PV is higher only when the injected brine is higher in concentration than the connate brine or connate brine itself or when it’s below a substantial salinity (2500 PPM) reaching the maximum at 1500 PPM.
• The high secondary recovery at 3 PV injection in case of 1500 PPM NaCl brine is due to the shifting of the intersection point of kro & krw shifts to the extreme right. This shifting of intersection point clearly indicates that the resulting sandpack becomes more water-wet in case of 1500 PPM NaCl brine facilitating high permeability of oil.
References
[1] Webb, K., Black, C. and Al-Ajeel, H. (2004) Low salinity oil recovery log-inject-log. SPE/DOE Symposium on Improved Oil Recovery, Tulsa, 17-21 April 2004, Paper SPE 89379-MS.
[2] Seccombe, J., Lager, A., Jerauld, G., Jhaveri, B., Buikema, T., Bassler, S., Denis, J., Webb, K., Cockin, A., Fueg, E. and Paskvan, F. (2010) Demonstration of low-salinity EOR at interwell-scale, Endicott field, Alaska. 2010 SPE improved Oil Recovery Symposium, Tulsa, 24-28 April 2010, Paper SPE-129692.
[3] Skrettingland, K., Holt, T., Tweheyo, M.T. and Skjevrak, I. (2010) Snorre low-salinity-water injection-coreflooding experiments and single-well field pilot. SPE Reservoir Evaluation and Engineering, 14, 182-192.
[4] Abdulla, F., Hashem, H.S., Abdulraheem, A., Al-Naqi, M., Al-Qattan, A., John, H., Cunningham, P.R.P., Briggs, P.J. and Thawer, R. (2013) First EOR trial using low salinity water injection in the greater, Burgan field, Kuwait. SPE Middle East Oil & Gas Show and Conference, Manama, 10-13 March 2013, Paper SPE-164341.
[5] Jadhunandan, P. and Morrow, N. (1995) Effect of wettability on waterflooding recovery for crude oil/brine/rock systems. SPE Reservoir Engineering, 10, 40-46. http://dx.doi.org/10.2118/22597-PA
[6] Tang, G. and Morrow, N. (1997) Salinity, temperature, oil composition and oil recovery by waterflooding. SPE Reservoir Engineering, 12, 269-276. http://dx.doi.org/10.2118/36680-PA
[7] Loahardjo, N., Xie, X., Yin, P. and Morrow, N.R. (2007) Low salinity waterflooding of a reservoir rock. International Symposium of the Society of Core Analysts, Calgary, 10-12 September 2007, Paper SCA2007-29.
[8] Cissokho, M., Boussour, S., Cordier, P., Bertin, H. and Hamon, G. (2010) Low salinity oil recovery on clayey sandstone: Experimental study. Journal Petrophysics, 51, 305-313.
[9] Rivet, S., Lake, L. and Pope, G. (2010) A coreflood investigation of low-salinity enhanced oil recovery. SPE Annual Technical Conference and Exhibition, Florence, 19-22 September 2010, Paper SPE-134297.
[10] Austad, T., RezaeiDoust, A. and Puntervold, T. (2010) Chemical mechanism of low salinity water flooding in sandstone reservoirs. 2010 SPE Improved Oil Recovery Symposium, Tulsa, 24-28 April 2010, Paper SPE-129767.
[11] Yousef, Ali A., Al-Saleh, S. and Al-Jawfi, M. (2012) Improved/enhanced oil recovery from carbonate reservoirs by tuning injection water salinity and ionic content. Eighteenth SPE Improved Oil Recovery Symposium, Tulsa, 14-18 April 2012, Paper SPE-154706.
[12] Nasralla, R.A., Bataweel, M.A. and Nasr-El-Din, H.A. (2013) Investigation of wettability alteration and oil-recovery improvement by low-salinity water in sandstone rock. Journal of Canadian Petroleum Technology, 52, 144-154.
[13] Jones, S.C. and Roszelle, W.O. (1978) Graphical techniques for determining relative permeability from displacement experiments. Journal of Petroleum Technology, 30, 807-817. http://dx.doi.org/10.2118/6045-PA
[14] Srivastava, R.K, Huang, S.S. and Dong, M. (1999) Asphaltene deposition during CO2 flooding. SPE Production & Facilities, 14, 235-245.
[15] Gamage, P. and Thyne, G. (2011) Comparison of oil recovery by low salinity waterflooding in secondary and tertiary recovery modes. SPE Annual Technical Conference and Exhibition, Denver, 30 October-2 November 2011, Paper SPE- 147375.
[16] Morrow, N. and Buckley, J. (2011) Improved oil recovery by low-salinity water flooding. Journal of Petroleum Technology, 63, 106-112. http://dx.doi.org/10.2118/129421-MS
[17] Idowu, J., Somerville, Dr. J., Adebari, D. and Meshioye, O. (2011) Effect of salinity changes of the injected water on water flooding performance in carbonate reservoirs. Nigeria Annual International Conference and Exhibition, Abuja, 30 July-3 August 2011, Paper SPE-150816.
[18] Zhang, Y. and Morrow, N.R. (2006) Comparison of secondary and tertiary recovery with change in injection brine composition for crude oil/sandstone combinations. 2006 SPE/DOE Symposium on Improved Oil Recovery, Tulsa, Oklahoma, 22-26 April 2006, Paper SPE-99757. http://dx.doi.org/10.2118/99757-MS
Nomenclature LSW: Low Saline Water;
PV: Pore Volumes;
EOR: Enhanced Oil Recovery;
FW: Formation Water;
NOTES

*Corresponding author.


