Journal of Mathematical Finance
Vol.3 No.2(2013), Article ID:31793,14 pages DOI:10.4236/jmf.2013.32024
Price Jump Prediction in a Limit Order Book*
1Natixis, Equity Markets, Paris, France
2Departement TSI, Télécom ParisTech, Paris, France
3BNP Paribas Chair of Quantitative Finance, Ecole Centrale Paris, MAS Laboratory, Chatenay-Malabry, France
Email: ban.zheng@melix.net, eric.moulines@telecom-paristech.fr, frederic.abergel@ecp.fr
Copyright © 2013 Ban Zheng et al. This is an open access article distributed under the Creative Commons Attribution License, which permits unrestricted use, distribution, and reproduction in any medium, provided the original work is properly cited.
Received November 4, 2012; revised April 2, 2013; accepted April 26, 2013
Keywords: Limit Order Book; High Frequency Trading; Price Jump; Trade-Through; Logistic Regression; LASSO
ABSTRACT
A limit order book provides information on available limit order prices and their volumes. Based on these quantities, we give an empirical result on the relationship between the bid-ask liquidity balance and trade sign and we show that the liquidity balance on the best bid/best ask is quite informative for predicting the future market order’s direction. Moreover, we define price jump as a sell (buy) market order arrival which is executed at a price which is smaller (larger) than the best bid (best ask) price at the moment just after the precedent market order arrival. Features are then extracted related to limit order volumes, limit order price gaps, market order information and limit order event information. Logistic regression is applied to predict the price jump from the features of a limit order book. LASSO logistic regression is introduced to help us make variable selection from which we are capable to highlight the importance of different features in predicting the future price jump. In order to get rid of the intraday data seasonality, the analysis is based on two separated datasets: morning dataset and afternoon dataset. Based on an analysis on forty largest French stocks of CAC40, we find that trade sign and market order size as well as the liquidity on the best bid (best ask) are consistently informative for predicting the incoming price jump.
1. Introduction
The determination of jumps in financial time series already has a long history as a challenging, theoretically interesting and practically important problem. Be it from the point of view of the statistician trying to separate, in spot prices, those moves corresponding to “jumps” from those who are compatible with the hypothesis of a process with continuous paths, or from the point of view of the practitioner: market maker, algorithmic trader, arbitrageur, who is in dire need of knowing the direction and the amplitude of the next price change, there is a vast, still unsatisfied interest for this question.
Several attempts have been made at theorizing the observability of the difference between processes with continuous or discontinuous paths, and the major breakthrough in that direction is probably due to [1], who introduced the concept of bi-power variation, and showed that—in a nutshell—the occurrence of jumps can be seen in the limiting behavior as the time step goes to zero of the bi-power variation: for a process with continuous paths, this quantity should converge to (a multiple of) the instantaneous variance, and the existence of a possibly different limit will be caused by the occurrence of jumps.
Since then, many authors, in particular [2] have contributed to shed a better light on this phenomenon, and one can safely say that rigorous statistical tests for identifying continuous-time, real-valued processes with discontinuous paths are now available to the academic community as well as the applied researcher.
However, it is a fact that the physics of modern, electronic, order-driven markets is not easily recast in the setting of real-valued, continuous-time processes, and it is also a fact that the time series of price, no matter how high the sampling frequency, is not anymore the most complete and accurate type of information one can get from the huge set of financial data at our hands. In fact, a relatively recent trend of studies has emerged over the past 10 years, where the limit order book became the center of interest, and the price changes are but a byproduct of the more complicated set of changes on limit orders, market orders, cancellation of orders,... see e.g. [3-6] for the latest developments in the econophysics of order-driven markets. This new standpoint is quite enlightening, in that the physics of price formation becomes much more apparent, but it calls for a drastic change in the basic modeling tools: prices now live on a discrete grid with a step size given by the tick, the changes in price occur at discrete times. Furthermore, a host of important events that affect the order book rather than the price itself, events which are therefore essential in understanding the driving forces of the price changes, now become observable, and their role in the price dynamics must be taken into account when one is interested in understanding the latter.
Our point of view is slightly different: rather than concentrate on the one-dimensional price time series, we want to model the dynamics in event time of the whole order book, and focus on some specific events that can be interpreted in terms of jumps. To do so, we shall depart from the classical definitions—if any such thing exists— of a jump in a financial time series, and restrict ourselves to the more natural, more realistic and also more prone to experimental validation, concept of an inter-trade price jump and trade-through.
By definition, an inter-trade price jump is defined as an event where a market order is executed at a price which is smaller (larger) than the best limit price on the Bid (Ask) just after the precedent market order arrival. An inter-trade price jump permits a limit order submitted at the best bid (best ask) just after a market order arrival to be surely executed by the next market order arrival. A trade-through corresponds to the arrival of a new market order, the size of which is larger than the quantity available at the best limit on the Bid (for a sell order) or Ask (for a buy order) side of the order book. By nature, such an order will imply an automatic and instantaneous price change, the value of which will be exactly the difference in monetary units between the best limit price before and after transaction on the relevant side of the order book. Trade-through can be interpreted as the instantaneous price change triggered by a market order, meanwhile, inter-trade price jump is post-trade market impact. Most of researches on limit order book are based on stocks and often relates to characterizing features such as liquidity, volatility and bid-ask spread instead of making prediction, see [7-15]. Trade-through has also been the object of several recent studies in the econometrics and finance literature, see e.g. [16] (for cross-sectional relationship study) and [17].
In this work, we investigate whether the order book shape is informative for the inter-trade price jump prediction and whether trade-through contributes to this prediction. Recently, many researchers propose machine learning methods to make prediction on limit order book. [18] presents a non-parametric model for trade sign (market order initiator) inference and they show that the limit order book shape and the historical trades size are informative for the trade sign prediction. [19] applies multi kernel learning with support vector machine in predicting the EURUSD price evolution from the limit order book information. Here, logistic regression is introduced to predict the occurrence of inter-trade price jump. Variable selection by LASSO logistic regression provides us an insight into the dynamics of the limit order book and allows us to select the most informative features for predicting relevant events. We will show that some features of the limit order book have strong predictive and explanatory power, allowing one to make a sound prediction of the occurrence of inter-trade price jump knowing the state of the limit order book. Tradethrough is also confirmed to be quite informative for inter-trade price jump prediction. This result in itself is interesting in that it allows one to use the full set of available information in order to do some prediction: whereas the history of the price itself is known not to be a good predictor of the next price moves—the so-called efficiency of the market is relatively hard to beat when one only uses the price information—we shall show that the limit order volumes contain more information, and the market order size contributes also to an accurate prediction of inter-trade price jump.
This paper is organized as follows. Section 2 describes the main notations in a limit order book. Section 3 gives an empirical result on the relationship between bid-ask liquidity balance and trade sign. Section 4 introduces logistic regression for inter-trade price jump prediction and lasso logistic regression for variable selection. The conclusion is in Section 6.
2. Description and Data Notation
The Euronext market adopts NSC (Nouveau Système de Cotation) for electronic trading. During continuous trading from 9h00 to 17h30, NSC matches market orders against the best limit order on the opposite side. Various order types are accepted in NSC such as limit orders (an order to be traded at a fixed price with certain amount), market orders (order execution without price constraint), stop orders (issuing limit orders or market orders when a triggered price is reached) and iceberg orders (only a part of the size is visible in the book). Limit order is posted to electronic trading system and they are placed into the book according to their prices, see Figure 1. Market order is an order to be executed at the best available price in the limit order book. The lowest price of limit sell orders is called best ask; the highest price of limit buy orders is called best bid. The gap between the best bid and the best ask is called the spread. When a market buy order with price higher/equal than the best ask price, a trade occurs and the limit order book is updated accordingly. Limit orders can also be cancelled if there have not
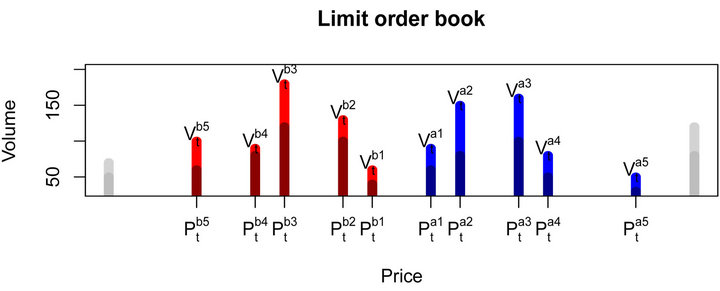
Figure 1. Limit order book description. Limit order price is discretized by tick price.
been executed, so the limit order book can be modified due to limit order cancellation, limit order arrival or market order arrival. In case of iceberg orders, the disclosed part has the same priority as a regular of limit order while the hidden part has lower priority. The hidden part will become visible as soon as the disclosed part is executed. The case that the hidden part is consumed by a market order without being visible before is quite rarely. In this study, we neglect stop orders and iceberg orders which are relatively rare compared to limit order and market order events.
In a limit order book, as shown in Figure 1, only a certain number of best buy/sell limit orders are available for public. We denote the number of available bid/ask limit prices by L.
In this study, for simplicity, we focus on limit order arrival events, limit order cancellation events and market order arrival events, see Figure 2. The number of visible limit order levels is chosen to be five L = 5. Our dataset is provided by NATIXIS via Thomson Reuter’s “Reuters Tick Capture Engine” and comprises of trades and limit order activities of the 40 member stocks of index CAC40 between April 1st 2011 and April 30th 2011. In order to get rid of open hour and close hour, we extract the data from 09h05 to 17h25. Every transaction and every limit order book modification are recorded in milliseconds. The data contains information on the L best quotes on both bid and ask sides. The trade data and quotes data are matched.
Denote t as a time index indicating all limit order book events.  and
and  for
for  define the ith best log bid/ask quote instantaneously after the tth event. We denote
 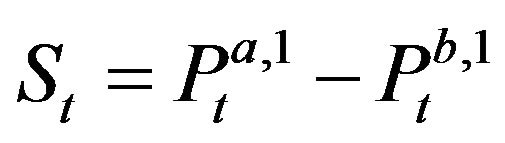 the spread instantaneously after the tth event.
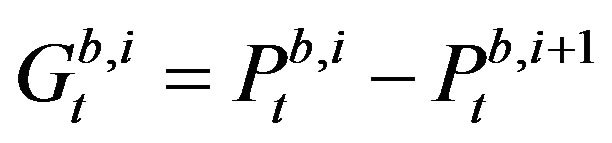 ,
,  for
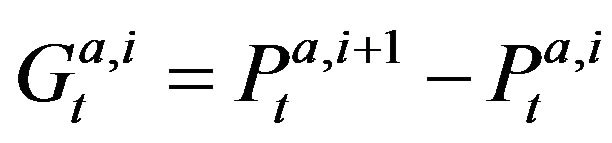
for  define respectively the ith best bid (ask) limit price gap instantaneously after the tth event. Besides,
  and
and  for
for  denote the log limit order volume on the ith best bid/ask quote instantaneously after the tth event. The volume of trade is denoted by
  (
( when there is no trade) and the price of trade is denoted by
  (
( when there is no trade,
  when a market order touches bid side and
  when a market order touches ask side). Moreover, we introduce six dummy variables
 ,
,  ,
,  ,
,  ,
,  and
and  to indicate the direction of each event: bid side or ask side, respectively for limit order event (
 and
and ), market order event (
 and
and ) and trade-through event (
 and
and ). The definition of variables is detailed in Table 1.
In order to capture the high-frequency dynamics in quotes and depths, we define a K-dimensional vector
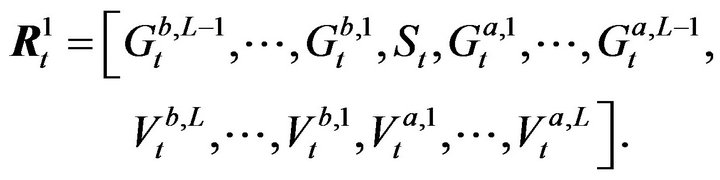
Modelling log prices and log volumes instead of absolute values is suggested by [20] studying the statistical properties of market impacts and trades and can be found in many other empirical studies. Price and volume changes in log is interpreted as related changes in percentage.
Another vector of variables is denoted by

indicating the nature of the  event.
Table 2 provides a descriptive statistics of the data used in this paper. It comprises limit order events, market order events and inter-trade price jump events. The
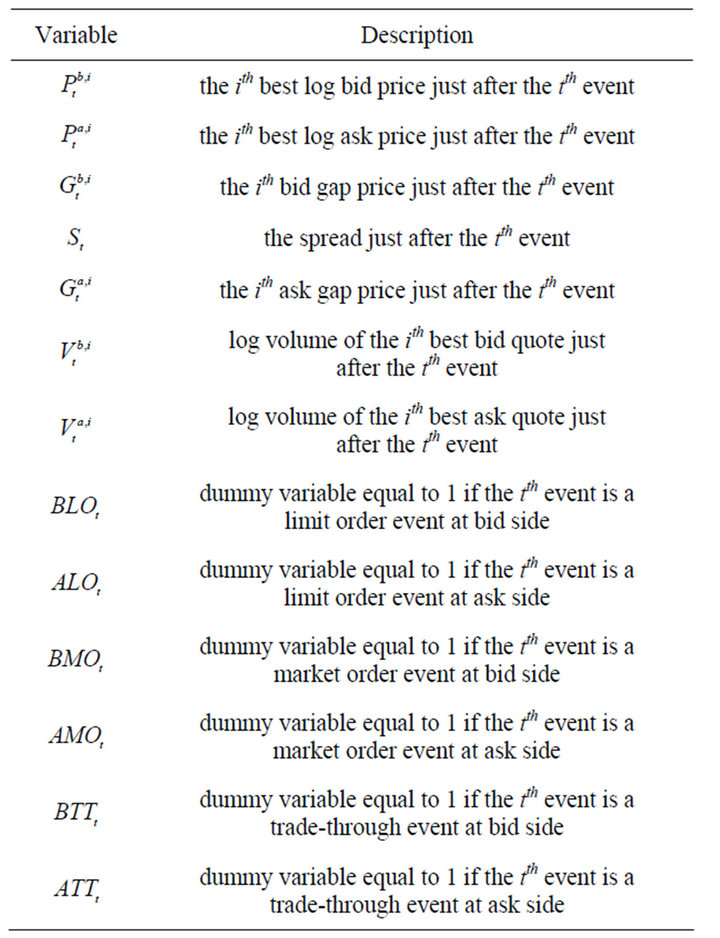
Table 1. Variable definitions.
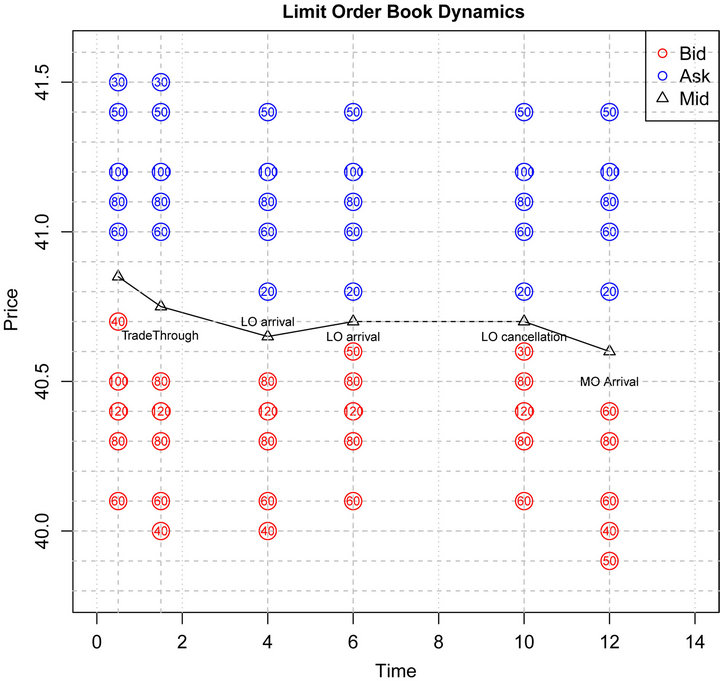
Figure 2. The dynamics of a limit order book. The first event is a trade-through event where a market order consumes 60 stocks at the bid side, then a new ask limit order of size 20 arrives in the spread following by another new bid limit order of size 50 arrives in the spread. Successively, soon after the arrival of a cancellation of size 20 at the best bid price, a large market order triggers a transaction of size 170 by moving several limits.
analysis is done on two separated datasets: morning dataset (between 09h05 and 13h15) and afternoon dataset (between 13h15 and 17h25). We observe that there are more market order events in the afternoon than in the morning. Similarly, inter-trade price jump events are slightly more frequent in the afternoon than in the morning. However, trade-through events are more frequent in the morning than in the afternoon.
3. Empirical Facts: Bid-Ask Liquidity Balance and Trade Sign
Before making an analysis on price jump prediction, we try to reveal whether the limit order volume information plays a role in determining the future market order’s direction (trade sign). In order to study the conditional probability given the knowledge about bid/ask limit order liquidity, we propose a bid-ask volume ratio corresponding to depth i just before the kth trade, which is defined as , more precisely,
where  is time index of the
  market order event.
For all , the conditional probability of a future buy market order (positive trade sign) that the next trade is triggered by a buy market order given
  is defined as,
where we denote the trade sign at time  by
by .
.
Similarly, for all , the conditional probability of a future sell market order (negative trade sign) that the next trade is triggered by a sell market order given
  is defined as,

The relationship between  and x for
  is shown in Figures 3 and 4. We observe that the conditional probability of the next trade sign is highly correlated with the bid-ask volume ratio corresponding to depth 1. Nevertheless, the dependence between the conditional probability of the next trade sign and the bid-ask volume ratio corresponding to depth larger than 1 is much more noisy. Figure 5 shows the relationship between
  and x for all stocks of CAC40. It is worth remarking that the trade sign’s conditional probability reaches 0.80 in average when the liquidity on the best limit prices is quite unbalanced.
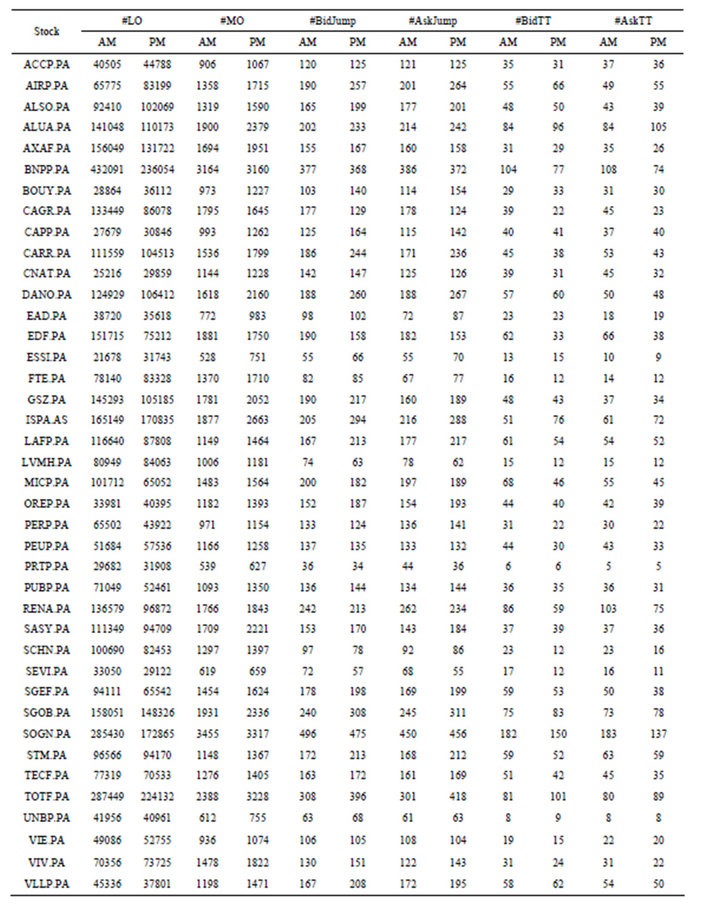
Table 2. Summary of limit order events, market order events and inter-trade price jump events, CAC40 stocks, April, 2011.
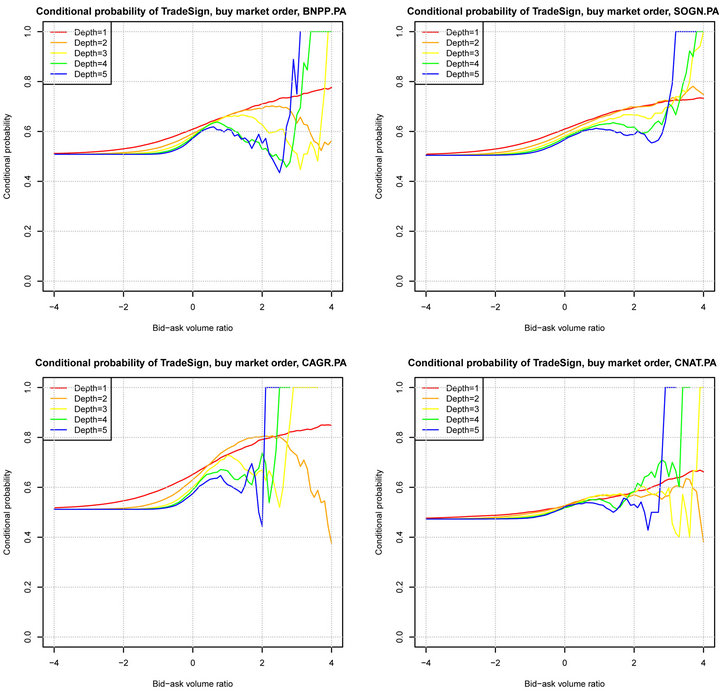
Figure 3. The conditional probability of a buy market order vs bid-ask volume ratio, April, 2011.
4. Logistic Regression Analysis and Variable Selection by LASSO
Logistic model is largely applied in many domains including quantitative finance. [21] uses logistic regression to classify trades and finds systematic temporal patterns in interday and intraday probabilities of trade sign on the US and Canadian exchanges. [22] analyzes the intraday probability of trade sign on the Australian Stock Exchange. Their results are encouraging and they have shown the robustness of logistic regression in prediction tasks in quantitative finance. Meanwhile, they have not studied the problem of variable selection in logistic regression. The objective of our work is not to show that logistic regression can beat all other machine learning algorithms, but to show that a well recognized model like logistic regression confirms the predictability of the limit order book and find out which variables are the most informative.
4.1. Logistic Regression Analysis
The result shown in the previous section reveals that bid-ask liquidity balance provides important information on the incoming market order. In this section, we introduce the standard logistic regression to predict the inter-trade price jump occurrence and use LASSO select regularization to evidence the importance of each vari-
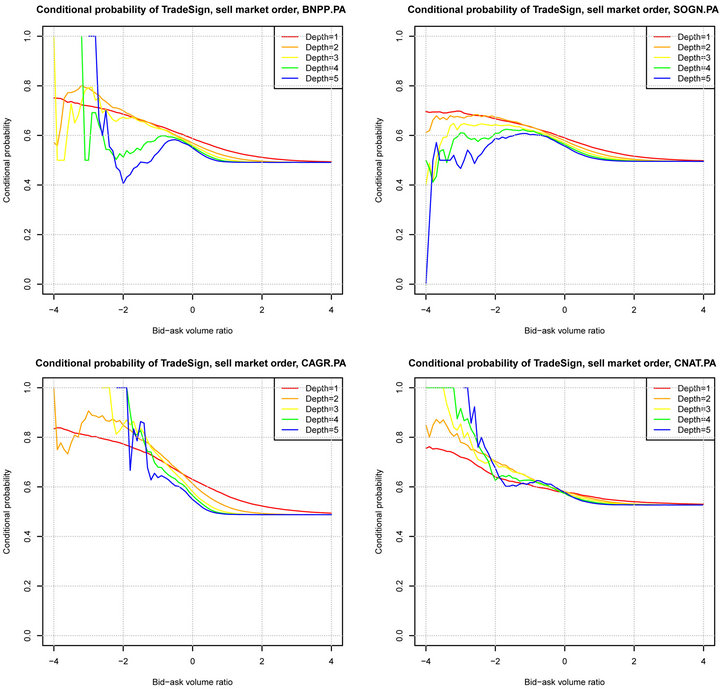
Figure 4. The conditional probability of a sell market order vs bid-ask volume ratio, April, 2011.
able in this prediction.
We denote the number of market order events by  and for each
 ,
,

( ,
, ) the explanatory variables summarizing the available order book information when the
  event is a market order event, yi is a binary variable indicating whether the event is an bid/ask inter-trade price jump, yi is defined as follows,

or

In the logistic model, the probability of the bid/ask inter-trade price jump occurrence is assumed to be given by:
 (1)
(1)
where .
.
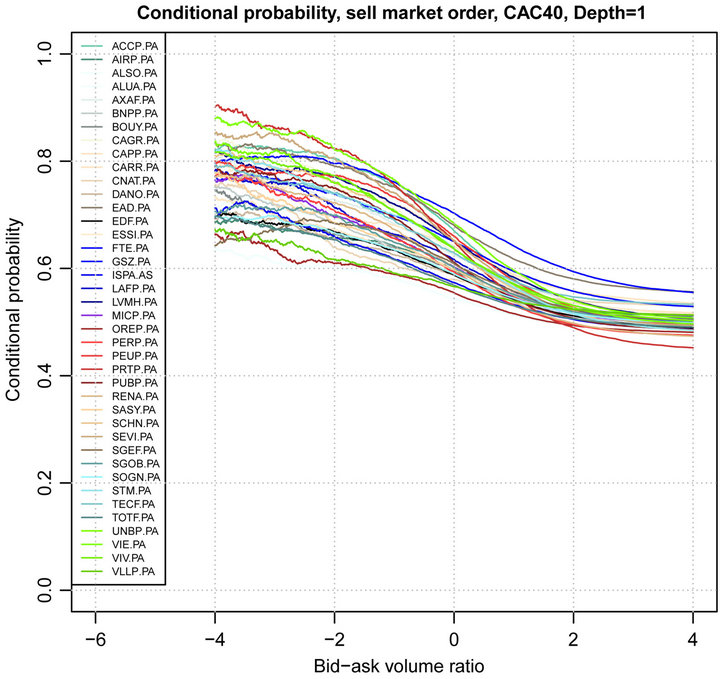
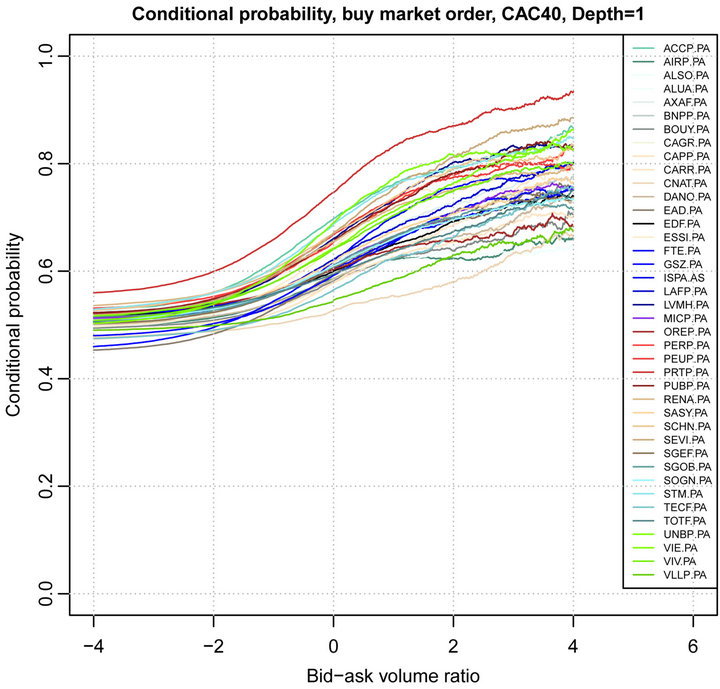
Figure 5. Trade sign’s conditional probability vs bid-ask volume ratio, Depth = 1, CAC40 stocks, April, 2011.
Observing that for 
we see that the linearity of the conditional probability  on variables
  and
and  in formula (1) allows us to capture the contribution of
  in the prediction.
The parameters  are unknown and should be estimated from the data. We use the maximum likelihood to estimate the parameters. It is well known that the log-likelihood function given by
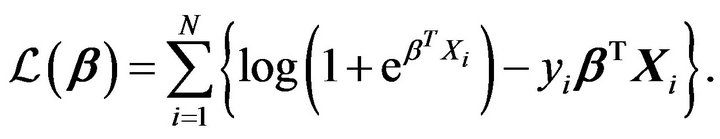
The likelihood function is convex and therefore can be optimized using a standard optimization method.
4.2. Variable Selection by LASSO
Since the number of explanatory variables p being quite large, it is of interest to perform a variable selection procedure to select the most important variables. A classical variable selection procedure when the number of regressors is large is the LASSO procedure. Instead of using a BIC penalization, the LASSO procedure adds to the likelihood the norm of the logistic coefficient, which is known to induce a sparse solution. This penalization induces an automatic variable selection effect, see [23] and [24]. The LASSO penalty is an effective device for continuous model selection, especially in problems where the number of predictors far exceeds the number of observations, see [23,25-28].
The LASSO estimate for logistic regression is defined by
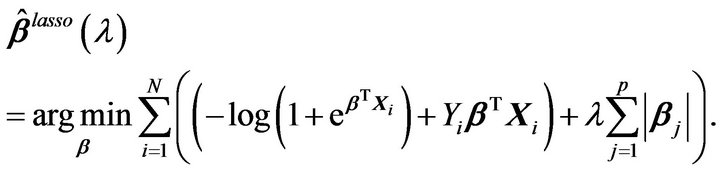
The constraint on  makes the solutions nonlinear in the
  and there is no closed form expression as in ridge regression. Because of the nature of constraint, making
  sufficiently large will cause some of the coefficients to be exactly zero. [29] gives the uniform consistency and a functional central limit theorem for the LASSO regularization path for the general linear model.
For the implementation, we use the package glmnet in R which implements the fast algorithm via coordinate descent. This algorithm select the smallest value  for which the entire parameter vector
  then constructs a sequences of K values of
  decreasing from
  to
to  on the log scale where K and
  are some constants, see more details in [30].
4.3. Results
We apply the LASSO logistic regression on three datasets: morning dataset (between 09h05 and 13h15), afternoon dataset (between 13h15 and 17h25) and allday dataset (between 09h05 and 17h25). For each dataset, one third is used to estimate the parameters and two thirds is applied to evaluate the prediction quality of the estimator. The size of datasets is given in Table 2.
In this work, we choose ,
,  and
and , then the dimension of the profile vector of a limit order book becomes
 . The choice of L, m, n can be arbitrary, nevertheless, following the result shown in [31] on the long memory of order flow, it makes sense to choose
  which represents an order flow correlation larger than 6%.
The parameter  in LASSO is estimated by crossvalidation, then we calculate AUC value (area under ROC curve) to measure the prediction quality. A ROC (receiver operating characteristic) curve is a graphical plot of the true positive rate vs. false positive rate. The area under the ROC curve is a good measure to measuring the model prediction quality. The AUC value is equal to the probability that a classifier will rank a randomly chosen positive instance higher than a randomly chosen negative one.
We show the out-of-sample AUC value in Figure 6. The stocks are sorted in alphabetic order. We see that for each prediction task, the median AUC values lie around 0.70 and they are consistently high over all datasets and all stocks of CAC40. Moreover, we remark that the mean of all mixed AUC values obtained from three datasets are not significantly different in Table 3. It confirms that the predictability of order book information is not timevariant.
In order to discover the contribution of each variable to the prediction, we add an analysis on the five firstly selected variables for each prediction task of all stocks of CAC40 (with allday dataset).
Figures 7 and 8 show how many times a variable is selected as the first (second, third, fourth, fifth) selected variable by LASSO. We denote the i events lagged log volume on the  bid (ask) limit price by
 . Similarly, i events lagged log market order volume is denoted by
  and i events lagged binary variables are denoted by
 ,
,  ,
,  ,
,  etc. For the sake of simplicity, for each selection order
 , we show the frequency distribution of the five most frequently selected variables among 746 backtests in each figure.
We observe that ,
,  and
and  are the most selected variables for predicting the future bidside inter-trade price jump and that
 ,
,  and
and
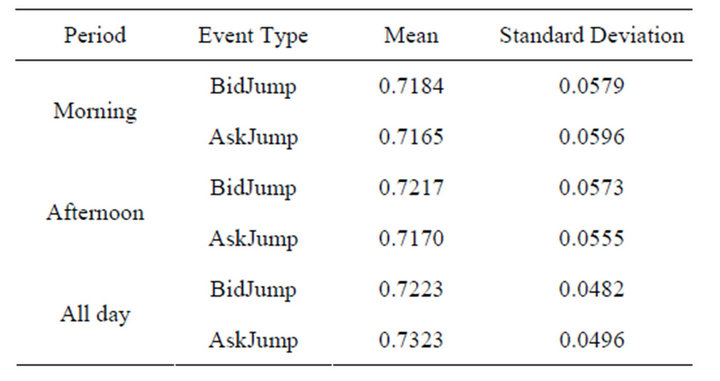
Table 3. AUC values obtained from all datasets.

Figure 6. AUC value, price jump prediction, CAC40, April, 2011.
 are the most selected variables for predicting the future askside inter-trade price jump. In contrast, tradethrough is less informative and contributes few to the price jump prediction. It implies that the market order is sensitive to the liquidity on the best limit price. As soon as the liquidity on the best limit price becomes significantly low, the next market order may touch it immediately. The information provided by
  and
and
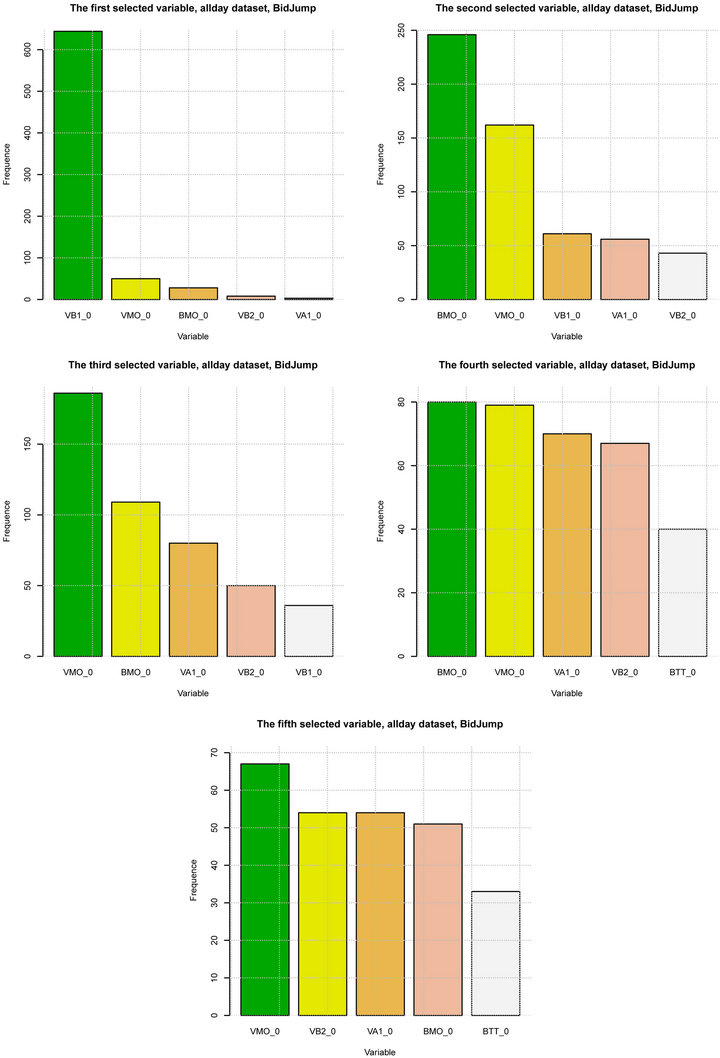
Figure 7. Variable selection for BidJump prediction, CAC40, April, 2011. From left to right, from top to bottom, each figure shows how many times a variable is selected as the kth selected variable by LASSO, k = {1, ···, 5}.

Figure 8. Variable selection for AskJump prediction, CAC40, April, 2011. From left to right, from top to bottom, each figure shows how many times a variable is selected as the kth selected variable by LASSO, k = {1, ···, 5}.
 recalls the phenomena of long memory of order flow, see [31]. When a trader tries to buy or sell a large quantity of assets, he may split it into small pieces and execute them by market order successively. Consequently, precedent market order direction contributes to predict the next market order event.
5. Conclusion
In this paper, we provide an empirical result on the relationship between bid-ask limit order liquidity balance and trade sign and an analysis on the prediction of the inter-trade price jump occurrence by logistic regression. We show that limit order liquidity balance on best bid/ best ask is informative to predict the next market order’s direction. We then use limit order volumes, limit order price gaps and market order size to construct the features of the limit order book for the prediction of inter-trade price jump occurrence. LASSO logistic regression is introduced to help us identify the most informative limit order book features for the prediction. Numerical analysis is done on two separated datasets: morning dataset and afternoon dataset. LASSO logistic regression gets very good prediction results in terms of AUC value. The AUC value is consistently high on both datasets and all stocks whatever the liquidity is. This good prediction quality implies that the limit order book profile is quite informative for predicting the incoming market order event. The variable selection by LASSO logistic regression shows that several variables are quite informative for inter-trade price jump prediction. The trade sign and market order size and the liquidity on the best limit prices are the most informative variables. Nevertheless, the aggressiveness of market order, measured by tradethrough, has less important impact than we had expected. These results confirm that the limit order book is quite sensitive to the liquidity on the best limit prices and there is a long memory of order flow like what is shown by other authors. This paper is merely a first attempt to discover the information hidden in the limit order book and further studies will be needed to understand better the full dynamics of the limit order book.
6. Acknowledgements
We are grateful to François Roueff, Michel Crouhy, Adil Reghai, Nicolas Huth, Julien Puvilland, Marc Souaille and Mohamed Lakhdar, Fabrizio Pomponio for helpful discussions. This research is supported by NATIXIS quantitative research department.
REFERENCES
- O. E. Barndor-Nielsen and N. Shephard, “Econometric of Testing for Jumps in Nancial Economics Using Bipower Variation,” Oxford Financial Research Centre, 2004.
- Y. At-Sahalia and J. Jacod, “Estimating the Degree of Activity of Jumps in High Frequency Data,” The Annals of Statistics, Vol. 37, No. 5A, 2009, pp. 2202-2244.
- A. Chakrabortia, I. Muni Toke, M. Patriarca and F. Abergel, “Econophysics: Empirical Facts and Agent-Based Models,” Elsevier, 2009.
- R. Cont, S. Stoikov and R. Talreja, “A Stochastic Model for Order Book Dynamics,” Operations Research, Vol. 58, 2010, pp. 549-563.
- F. Abergel, B. K. Chakrabarti, A. Chakraborti and M. Mitra, “Econophysics of Order Driven Markets,” In: Proceedings of the 5th Kolkata Econophysic Conference, New Economic Windows, Springer, 2011.
- R. Cont and A. De Larrard, “Price Dynamics in a Markovian Limit Order Book Market,” Social Science Research Network Working Paper Series, 2011.
- J. Hasbrouck, “Measuring the Information Content of Stock Trades,” Journal of Finance, Vol. 46, 1991, pp. 179-207.
- J. A. Hausman, A. W. Lo and A. C. MacKinlay, “An Ordered Probit Analysis of Transaction Stock Prices,” Journal of Financial Economics, Vol. 31, No. 3, 1992, pp. 319-379.
- D.B. Keim and A. Madhaven, “The Upstairs Market for Large-Block Transactions: Analysis and Measurement of Price Effects,” Review of Financial Studies, Vol. 9, No. 1, 1996, pp. 1-36.
- A. W. Lo, A. Craig MacKinlay and J. Zhang, “Econometric Models of Limit-Order Executions,” Journal of Financial Economics, Vol. 65, No. 1, 2002, pp. 31-71.
- F. Lillo, J. Doyne Farmer and R. N. Mantegna, “Master Curve for Price Impact Function,” Nature, Vol. 421, No. 6919, 2003, pp. 129-130.
- J. Hasbrouck, “Empirical Market Microstructure: The Institutions, Economics and Econometrics of Securities Trading,” 2006.
- C. Parlour and D. Seppi, “Limit Order Markets: A Survey”.
- E. Jondeau, A. Perilla and M. Rockinger, “Optimal Liquidation Strategies in Illiquid Markets,” Swiss Finance Institute Research Paper No. 09-24, 2008.
- J. Linnainmaa and I. Rosu, “Weather and Time Series Determinants of Liquidity in a Limit Order Market,” 2009.
- T. Foucault and A. J. Menkveld. Competition for Order Flow and Smart Order Routing Systems,” Journal of Finance, Vol. 63, No. 1, 2008, pp. 119-158. doi:10.1111/j.1540-6261.2008.01312.x
- F. Pomponio and F. Abergel, “Trade-Throughs: Empirical Facts. Application to Lead-Lag Measures,” Proceedings of the 5th Kolkata Econophysic Conference, Vol. 1, No. 1, 2011, pp. 3-6.
- A. Blazejewski and R. Coggins, “A Local Non-Parametric Model for Trade Sign Inference,” Physica A: Statistical Mechanics and Its Applications, Vol. 348, No. 1, 2005, pp. 481-495.
- T. Fletcher, Z. Hussain and J. Shawe-Taylor, “Multiple Kernel Learning on the Limit Order Book,” Quantitative Finance, 2010.
- M. Potters and J. P. Bouchaud, “More Statistical Properties of Order Books and Price Impact,” Physica A, Vol. 324, No. 1-2, 2003, pp. 133-140.
- D. C. Porter, “The Probability of a Trade at the Ask: An Examination of Interday and Intraday Behavior,” Journal of Financial and Quantitative Analysis, Vol. 27, No. 2, 1992, pp. 209-227.
- M. Aitken, A. Kua, P. Brown, T. Watter and H. Y. Izan, “An Intraday Analysis of the Probability of Trading on the Asx at the Asking Price,” Australian Journal of Management, Vol. 20, No. 2, 1995, pp. 115-154.
- R. Tibshirani, “Regression Shrinkage and Selection via the Lasso,” Journal of the Royal Statistical Society, Series B, Vol. 58, No. 1, 1994, pp. 267-288.
- T. Hastie, R. Tibshirani and J. H. Friedman, “The Elements of Statistical Learning,” Springer, 2003.
- J. Claerbout and F. Muir, “Robust Modeling with Erratic Data,” Geophysics, Vol. 38, No. 5, 1973, pp. 826-844.
- H. L. Taylor, S. C. Banks and J. F. McCoy, “Deconvolution with the l 1 Norm,” Geophysics, Vol. 44, No. 1, 1979, pp. 39-52.
- F. Santosa and W. W. Symes, “Linear Inversion of Band-Limited Reection Seismograms,” SIAM Journal on Scientific and Statistical Computing, Vol. 7, No. 4, 1986, pp. 1307-1330.
- S. S. Chen, D. L. Donoho and M. A. Saunders, “Atomic Decomposition by Basis Pursuit,” SIAM Journal on Scientific Computing, Vol. 20, No. 1, 1998, pp. 33-61.
- J. F. Germain and F. Roue, “Weak Convergence of the Regularization Path in Penalized M-Estimation,” Scandinavian Journal of Statistics, Vol. 37, No. 3, 2010, pp. 477-495.
- J. H. Friedman, T. Hastie and R. Tibshirani, “Regularization Paths for Generalized Linear Models via Coordinate Descent,” Journal of Statistical Software, Vol. 33, No. 1, 2010, pp. 1-22.
- J. P. Bouchaud, J. D. Farmer and F. Lillo, “How Markets Slowly Digest Changes in Supply and Demand,” 2008.
NOTES
*The authors would like to thank the members of Natixis quantitative research team for fruitful discussions.