Open Journal of Safety Science and Technology
Vol.3 No.2(2013), Article ID:33342,13 pages DOI:10.4236/ojsst.2013.32003
Developing a Composite Index of Child Road Safety in a Municipality
1Transportation Research Institute, Technion City, Israel
2Beterem-Safe Kids Israel, The National Center for Children’s Safety and Health, Hasivim, Israel
3The Technion Statistical Laboratory, Technion City, Israel
Email: *trivica@technion.ac.il
Copyright © 2013 Victoria Gitelman et al. This is an open access article distributed under the Creative Commons Attribution License, which permits unrestricted use, distribution, and reproduction in any medium, provided the original work is properly cited.
Received March 7, 2013; revised April 6, 2013; accepted April 20, 2013
Keywords: Child Safety; Safety Performance Indicators; Factor Analysis; Municipality
ABSTRACT
Road traffic injuries are a leading cause of injury-related death and disability in children in Israel. The use of safety performance indicators (SPIs) is common today for benchmarking road safety performance and monitoring of trends. This study aimed to develop a set of indicators which would assist in diagnosis and promotion of child road safety in urban communities. A wide set of basic indicators was defined with an interdisciplinary team of experts. A pilot study was undertaken in four municipalities, in which the data for five safety domains: injury, background characteristics, road user behaviors, attitudes, policy and management—were collected and basic SPIs were estimated. To combine the basic indicators into a composite index, for each domain, a statistical model based on common Factor Analysis was applied. The Factor Analysis demonstrated a reasonable way of aggregating the indicators’ meaning, for each domain considered, and produced the tools for municipalities’ comparison. It was concluded that the child road safety indicators and composite indices developed are applicable for measuring and monitoring of municipalities’ road safety level and practices. National authorities may use the tools developed to compare urban communities at a regional or country level.
1. Introduction
In Israel, similar to the European region and the US, road traffic injuries are the leading cause of injury-related death and disability in children aged 1 - 17 [1,2]. According to the police data, in 2010, road accidents were the cause of injuries among 3,066 children in Israel [3]. Children are more vulnerable to injury than other population groups: according to the National Trauma Registry data, children aged 0 - 17 comprised 68% of bicyclist, 43% of pedestrian, and 25% of motor vehicle injuries hospitalized due to motor vehicle trauma in Israel [4].
Children are vulnerable road users in the community travelling to school, parks and other neighborhood destinations. Limited cognitive, behavioral, and physical abilities make children more susceptible to injuries where infrastructure and environment are not designed to promote road safety [5-8]. Pedestrian safety is a particular issue in urban areas, and children are especially at risk [9]. A number of strategies with the potential to reduce pedestrian accidents and injuries have been identified including changes to infrastructure, improved programs to provide safer travel to school for children, and better use of enforcement [9-11]. Municipalities are important stakeholders in traffic safety promotion and reduction of child injuries in accidents [1]. Municipalities are responsible for services related to the quality of life and environment for residents, including infrastructure, education and communication. Municipalities in Israel are directly responsible for planning and maintaining safe urban roads and streets, in cooperation with the Ministry of Transport.
Internationally, the use of safety performance indicators is accepted as a method to assess, monitor, and compare traffic safety performance across countries [12-14]. These indicators are recognized as an important component in developing effective policies to increase safety, as accident and injury data are often missing and do not provide enough information on the processes that lead to accidents [12]. The safety performance indicators recommended for application in the European Union (EU) included measures of road user behaviors, infrastructure, vehicle fleet and trauma management. A series of such indicators were developed to analyze safety at the national level via the EU project SafetyNet [15]. Findings for the EU countries have been used to create a road safety composite index, allowing for comprehensive comparison across countries [16-18].
Safety performance indicators may also be used at the local level to promote traffic safety and develop policy. Currently the use of indicators to assess and compare road safety in urban and local authorities is scarce. Among the few local programs to use safety performance indicators is that in Victoria, Australia which used safety outcome data (injury and fatality rates) and intermediate outcome data (behavior rates) to promote safety strategies and reduce road injuries and fatalities [19]. In Sweden, the use of safety management tools across municipalities has been compared and evaluated [20].
A research study was initiated aiming to develop child road safety indicators for municipalities in Israel, including a set of indicators and a general assessment method to diagnose and promote child road safety issues in local communities. Previous research on community-based injury prevention pointed to the need for applicable tools and methodology for promotion of both intervention and evaluation processes [21-23]. The current study aimed to provide municipalities and policy makers with the tools needed to evaluate and promote child traffic safety at the local level.
The research study was comprised of three stages: 1) definition of indicators, 2) development of methods for estimating indicators, and 3) validating the indicators through a pilot study. The definition of an initial set of indicators for testing was a long-term iterative process that involved inputs of experts from a variety of fields. Following the initial identification, data sources and methodological tools were developed for each of the indicators. The pilot study was conducted in four municipalities, where the data required were collected and analyzed aiming to verify the feasibility of measurements and the indicators’ validity. Further analysis of the results of the pilot study enabled the creation of a composite index of child road safety in a municipality.
This paper presents the results of the pilot study, where the pre-defined sets of indicators were examined from the viewpoint of feasibility of data collection for their estimation, usability of findings and possibility of further aggregation of the results for the purpose of comparison between municipalities. The paper is structured as follows. Section 2 presents the indicators developed to capture the characteristics of the local authorities. The methods of data collection for measuring the indicators are described in Section 3. Section 4 details the method of analysis applied to the indicators compiled in the pilot study, including development of a composite index. The analysis results are summarized in Section 5 followed by a discussion in Section 6.
2. Definition of Basic Indicators
The indicators’ framework to be explored by the study was defined in the process of a series of workshop meetings with an interdisciplinary team of 28 experts, which included road safety researchers, policy makers, municipal engineers and child safety experts. To support the process, a literature review was conducted to identify potential road safety indicators for municipalities, and a review of data sources available at both the national and local levels was compiled. The literature revealed examples of multi-action safety intervention programs at the local level [e.g. 24] as well as various indicators of child injury applied for monitoring the progress [e.g. 25]. However, a ready set of indicators for assessing and monitoring the level of child road safety in a local community/municipality was not found. In the majority of cases the values measured related to the effects of certain safety interventions. Moreover, recent developments in the field of safety performance indicators drew the attention to the need in estimating not only the final outcomes of the system (un)safety, e.g. the numbers of fatalities and injuries, but also the intermediate indicators which characterize the current safety conditions, e.g. road user behaviors, road infrastructure characteristics [12,14,15].
The criteria for selection of potential indicators for estimating child road safety in a municipality included feasibility considerations such as: use of existing data sources; ability to measure changes over-time; measurement instrument exists or, at least, is known, together with a criterion of relevance to the topic examined (e.g. in terms of evidence-based relation to child safety). Moreover, it was obvious that to provide a comprehensive picture of the situation in the municipality, the indicators should cover traffic safety for children as pedestrians, bicyclists and vehicle passengers as well as traffic exposure and infrastructure characteristics. In addition, to reflect the authorities’ awareness and activities, their input measures should be considered, where the outcomes of the processes should be presented both in the forms of injury (as final outcomes) and traffic behaviors’ and attitudes’ measures (as intermediate outcomes). Finally, in order to make the comparisons more reasonable, background characteristics of the cities should be accounted for. In general, this approach resembles the “road safety pyramid” which was suggested for description of the road safety domain and country comparisons in the EU [12,14,18]. However, unlike the other studies, the current study focused on the development of the components considered for local or municipality level.
Due to the complexity of the topic and based on the considerations mentioned above, six traffic safety domains were defined for the indicators’ framework— Figure 1. These are: Injury, Behaviors and Attitudes—as final and intermediate outcomes characterizing the municipality safety level; Background characteristics—to reflect the scope of children population in the municipality, its socio-economic level and exposure to vehicle traffic; Policy and Management—to characterize the authorities’ activities towards better child safety in the municipality; and Environment and Walkability—to reflect the current state of road infrastructure, from the viewpoint of child activities.
Following discussions with the entire expert team, a series of working groups were established in the study, where each one focused on identifying potential indicators for a specific traffic safety domain. In total, over 100 quantitative and qualitative indicators were suggested, including the appropriate source and method for each of the measurements. Table 1 presents the detailed indicators selected for the five safety domains, which were further examined by the pilot study.
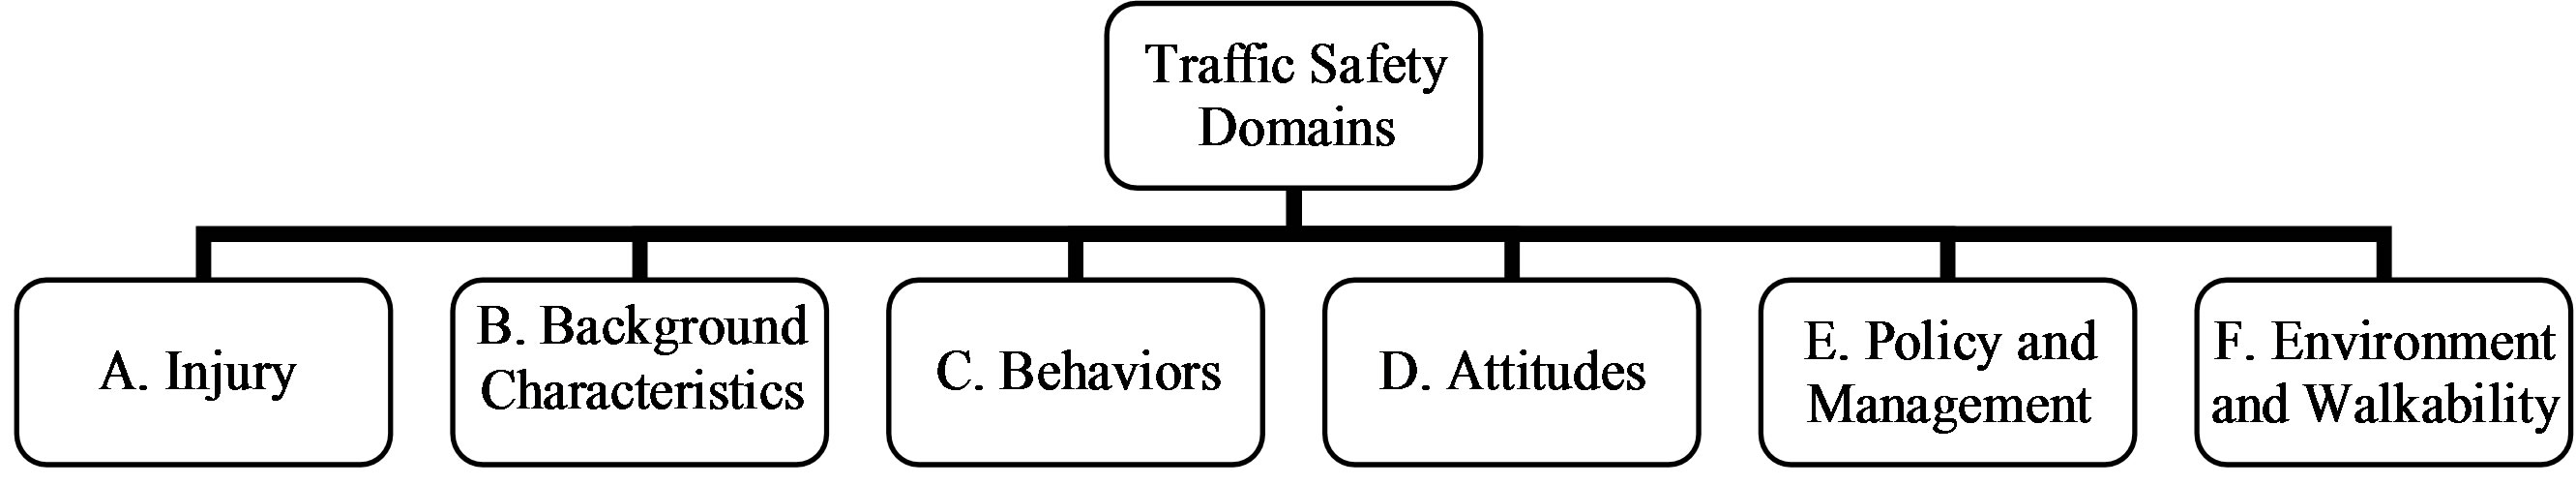
Figure 1. Traffic safety domains for characteristic of municipalities.


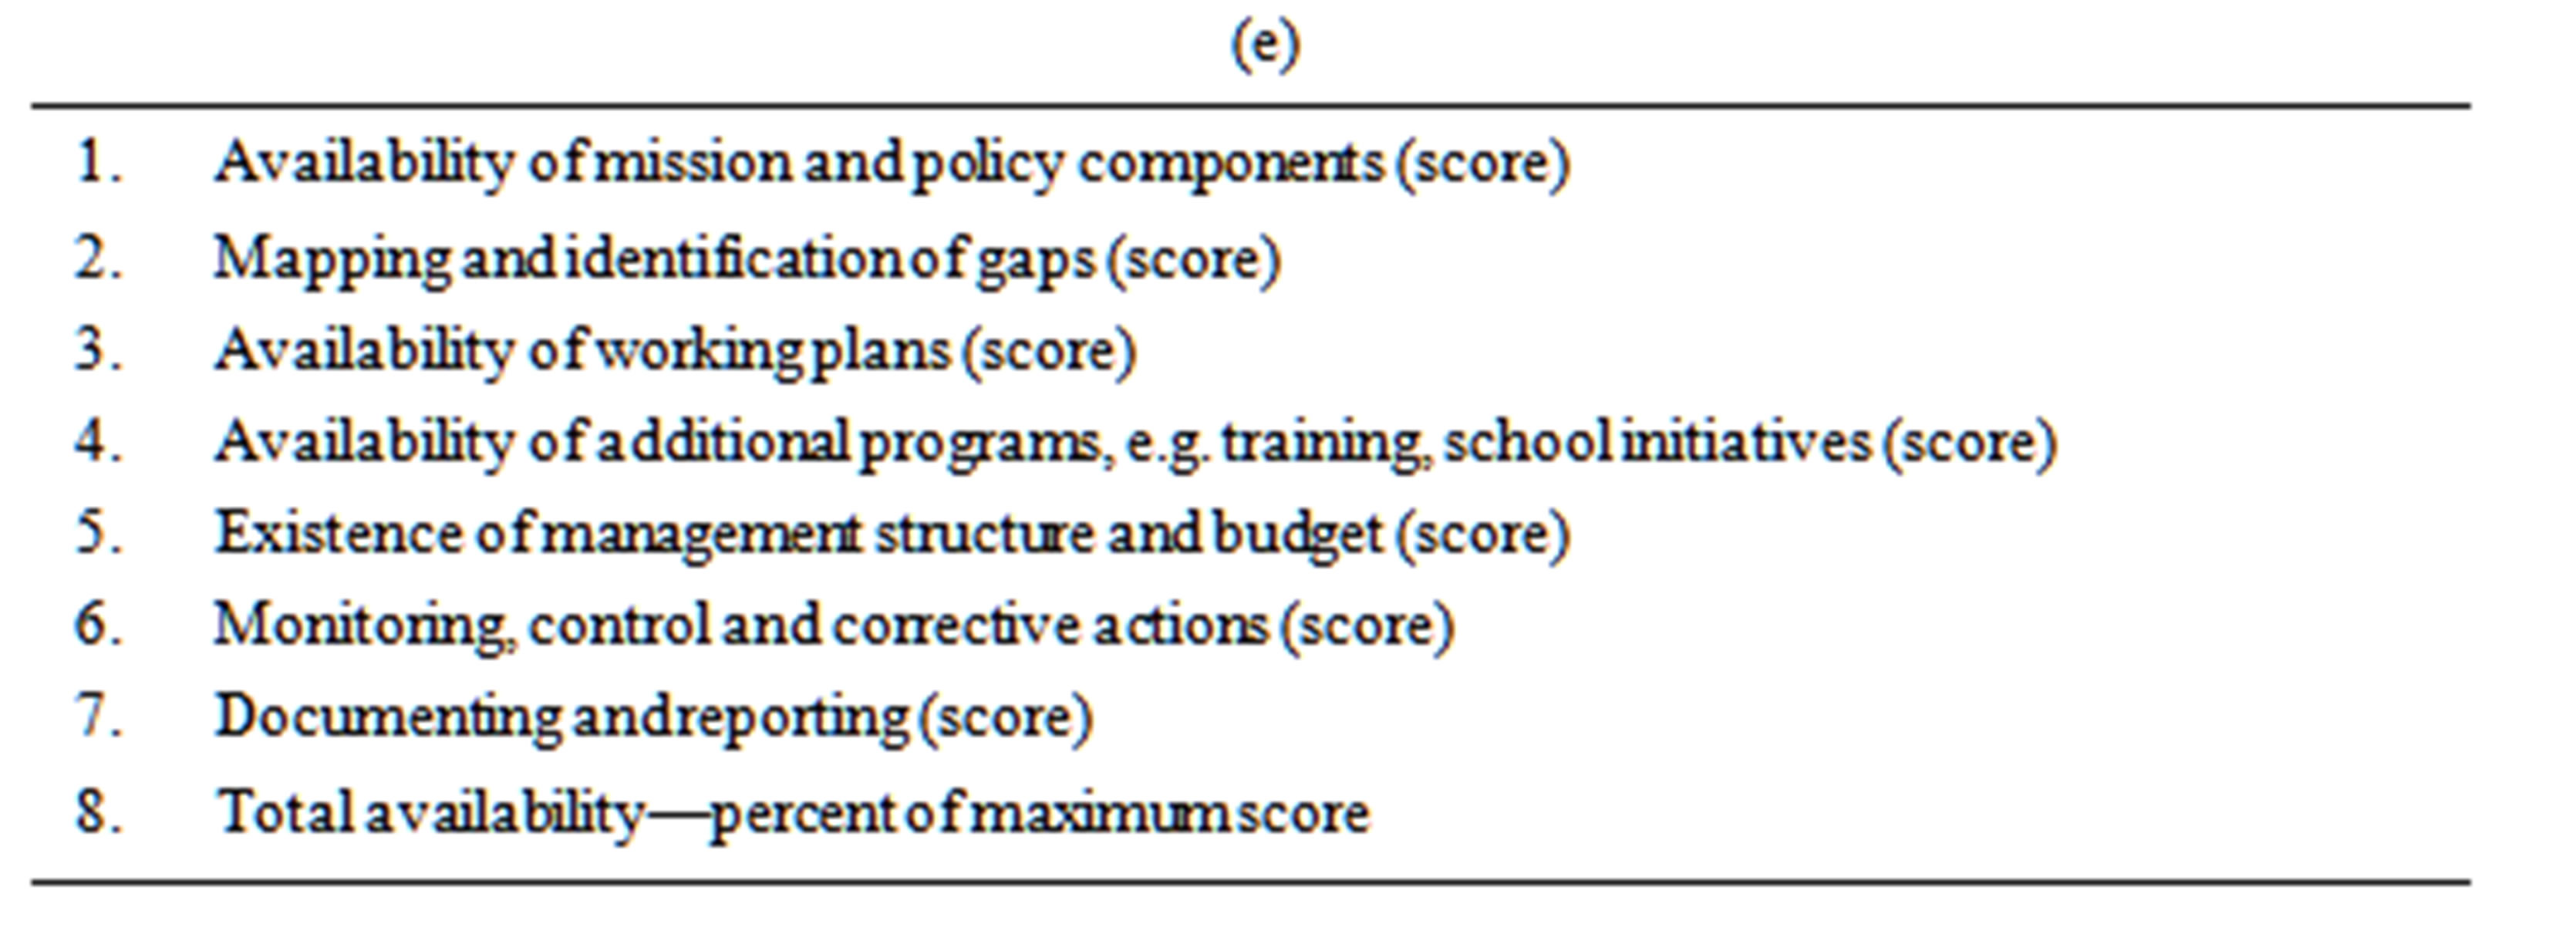
Table 1. Safety performance indicators defined for municipalities: (a) Injury indices; (b) Background characteristics of the municipality; (c) Behaviors of road users; (d) Attitudes of the municipality residents; (e) Policy and Management.
As to the Environment and Walkability domain, it was assumed that the most appropriate way for assessing the state of road infrastructure in a municipality, from the viewpoint of child safety, is by means of a new approach which measures a suitability of existing infrastructure for safe walking and cycling activities [26,27]. A method based on an environmental audit, exposure counts of children and surveys of children’s trips was suggested for measuring walkability of representative children walking routes in the municipality [28]. However, the assessment was conducted as a pretest in one town only and therefore the indicators of this domain were not included in the analysis presented here.
3. Data Collection
A pilot study on measuring the indicators suggested was conducted in four towns in central Israel. All the four were participants of a community-based child safety program [21] and agreed to cooperate with the research team. The municipality executives provided documentation and data requested, participated in working meetings and enabled the conduct of observational surveys in their areas. At the same time, the municipalities selected for the pilot were diverse in their characteristics, in order to examine the feasibility of measurements suggested in varying urban environments. The municipalities in the pilot were:
· Bat-Yam: a large1-sized Jewish town with mostly non-religious population;
· Hertzlia: a medium-sized Jewish town with mostly non-religious population;
· Bnei-Barak: a large-sized Jewish town with mostly religious population;
· K-Kasem: a small-sized Arab town, similar to the majority of Arab towns in Israel.
The entire set of indicators was measured for each municipality. Tools and methodology were further detailed for each of the indicators in preparation for fieldwork and analysis. The indicators measured for each municipality included:
A. Injury indices: the data on injuries and fatalities was compiled, for each town, using the Central Bureau of Statistics (CBS) road accident data [29]. The analysis included an examination of road accidents’ involvement among children who were the municipality residents in accidents throughout the country, as well as for accidents involving all children (residents and non-residents) in the municipality territory. Both considerations are required to provide a complete picture of child injury. Fatalities were analyzed for a five-year period, 2004-2008, whereas injury figures were estimated for a single year, 2008. The analysis included estimates of the scope of child injury in total and by mode of travel, i.e. for children as pedestrians, vehicle passengers and bicyclists.
B. Background Characteristics: included detailed analysis of three topics for each municipality, i.e. 1) population size according to age groups and population groups; 2) socio-economic level, and 3) the level of exposure to road traffic. The first two groups of indicators were estimated based on the CBS publication [30]. Travel exposure measures were compiled from two sources: vehicle ownership by municipality residents, based on [31], and the values of “active population” in each municipality, estimated by [32]. The term “active population” was introduced in Israel a decade ago as a substitute for the measure of urban traffic exposure, where it refers to the population living in the city, the commuters entering and exiting the city, and tourists. The ratio of active and registered population reflects the traffic remaining in the city; a ratio below one represents a largely static population while a ratio above one reflects a high level of incoming commuter traffic.
C. Behaviors: behavior of child road users was assessed in a series of field surveys conducted in spring 2009. In each municipality, the observational surveys included: use of child safety restraints in cars, characteristics of bicycle riding, and arrival to school conditions. For each survey, a sample of neighborhoods was randomly selected from the town. The sampling was conducted with the help of a geographic information system, and accounting for socio-demographic information (Census data), land-use, residential building density and road network attributes, in each municipality. For each of the surveys, a minimum sample of 200 children was required, as a feasible number, on the one hand, and allowing for sufficient statistical estimates, on the other hand. The actual number of observations ranged for each survey: in the safety restraint use’ surveys, the number of vehicles checked ranged from 211 to 278 and the number of children observed—from 284 to 449; in the bicycling’ surveys, the number of children observed per municipality ranged from 257 to 531. The arrival to school’ survey included a sample of 5 - 6 near-school areas, in each municipality, with a range of 631 - 973 total children observed.
The child restraint use survey included observations of gender, restraint use, restraint type, and vehicle type as well as a short interview with the driver regarding child age, height, weight and the use of air bags (in cases where the restraint was in the front seat). The survey was conducted during after-school hours at sites where cars with child passengers were likely to be observed, e.g. gas stations, shopping centers and parking lots near schools. The bicycling survey included observations of children riding alone, with peers, or with an adult, helmet and reflector use as well as gender and age group estimated. The bicycling survey was conducted during after-school hours on neighborhood streets, in local parks and on bicycle paths. The third survey was conducted in each of the towns at schools on arrival in the morning, including observations of children arriving as pedestrians, bicyclists or car passengers. The observations included rating of safe or unsafe behavior of each of the children on arrival to school as well as assessment of drivers’ behavior and scores of the infrastructure surrounding the schools.
D. Attitudes: a random digit dialing telephone survey was conducted in fall 2009, in each of the four municipalities, to measure attitudes of parents to children aged 0 - 17. The survey focused on two primary issues: safety knowledge, attitudes and behaviors of parents and children living in the town, and road safety level of the town as perceived by the parents. Parents reported behaviors concerning their child’s mode of travel to school, number of streets crossed on the way to school, use of child restraints in cars and bicycle helmet wearing. Parents reported attitudes regarding the need to improve arrival to school conditions, level of safety for children in the municipality when walking to school, riding in a vehicle or bicycling, recent improvement in child safety in the municipality and the level of importance ascribed by the municipality Mayor to the issue of child safety. The surveys were conducted with a representative sample of parents in each municipality; the sample size for the three larger towns was 500 parents and for the small-sized town—215 parents (where the survey tool was also translated and conducted in Arabic). Standard techniques were used to reduce non-response rates including multiple call backs and leaving messages. The response rates were 15% for each of the Jewish cities and 64% in the Arab town.
E. Policy and Management: An assessment tool was developed based on Occupational Health and Safety Standards [33], an internationally recognized assessment specification for occupational health and safety management systems. The tool examined the availability of components of key safety-related management activities including the child safety mission and policy statement, development of working plans, child safety-related projects, budget and personnel assigned. The assessment tool included a checklist of multiple items for each of the management activities. In each municipality, the data were collected based on interviews conducted with 3 - 4 senior staff members and a review of documented programs and policies. The indicators were estimated in terms of availability scores per each item examined and a final estimate reflecting the percentage availability related to maximum possible score, through all the items considered.
4. Method of Analysis
Following the pilot study, a wide range of basic indicators was estimated for each municipality involved, in accordance with the five groups (domains) as introduced in Table 1. The analysis was undertaken aiming to explore the possibility of developing a composite index for each group of the indicators, which would enable a meaningful measurement and comparison between the municipalities considered. Concurrently, the behavior of basic indicators in each domain was examined in order to clarify the possibility of reducing the original long list of basic indicators to a shorter one, which would be more feasible for application by a high number of municipalities throughout the country.
Prior to the analysis, the data collected were arranged in a form suitable for a quantitative analysis—see Appendix A. In addition, in each group, the basic indicators were examined aiming to recognize those having a more “summary” character compared to others, i.e. providing more focused message as to the municipality’s performance in the domain considered. For example, considering the Injury domain (Table A1), among 12 basic indicators, 5 were selected as summary ones: the rates of children killed and injured, per population, in the municipality’s territory; percentage of children out of total traffic injuries and the shares of children injured as pedestrians or vehicle passengers, in the town. This selection was based on the assumption that authorities’ responsibility is more relevant for cases observed in the municipality’s territory as opposed to those that happened to the town’s residents throughout the country. Similarly, in the group of behavior indicators concerning bicycle riders (Table A3(b)), the final share of children wearing bicycle helmets in the municipality was recognized as a summary indicator on the subject (compared to other indicators which mostly describe the riding conditions).
Both the whole set of basic indicators and a reduced set of summary ones served as a basis for the statistical analysis performed, aiming to compare the results stemming from various sets of the indicators considered. In addition, for some basic indicators two different options were possible. For example, as a substitute for motor vehicle exposure of the town both “the rate of total vehicles per 1000 residents” and “the rate of private vehicles per 1000 residents” are applicable. In such a case, the number of trials for development of a composite index was extended, where each trial included different indicator options.
To combine the basic indicators into a composite index, for each domain, a statistical model based on common Factor Analysis (FA) was applied [34]. This method groups correlated indices to form a composite indicator that captures as much common information among subindicators as possible, where the idea is to account for the highest possible variation in the set of indicators using the smallest possible number of factors. The first step in the FA is to check the correlation structure of the data, and the second step is to identify a certain number of latent factors, smaller than the number of indicators, representing the data. The number of factors fitted to the data is data-dependent and not dictated by an external reason.
To determine the number of factors required, the variance explained criterion was applied. At this point, two approaches are possible. Some researchers use the rule of keeping enough factors to account for a certain share (e.g. 90% or 80%) of the variation. Conversely, if the researcher’s goal emphasizes parsimony (explaining variance with as few factors as possible), the criterion could be as low as 50%. In our case, the variation was taken to be the sum of the Eigenvalues of the reduced correlation matrix. It was found that for each domain analyzed, two factors explained 80% or higher share of the variation.
Each of the analyses produced a rotated factor pattern showing which variables (basic indicators) were more heavily loaded by each one of the factors created. Considering the “safety-desirable” behavior of major variables which composed the factors and their coefficients, we could state whether higher or lower values of each factor were associated with better safety performance of the municipality. In addition, each trial produced the tools for the estimation of each municipality’s score, including: scoring coefficients, factors’ weights, means and variances of the variables to estimate the standardized values.
Once the factors are created, the following procedure is applied to calculate a composite indicator, for each municipality: a) Standardize the data, i.e. subtract mean and divide by standard deviation, for each variable; b) Multiply these standardized variables by their respective standardized scoring coefficients; c) Sum up these products over all the relevant variables. The sum is the value of the new variable Factor 1; d) Repeat steps a) - c) for Factor 2. This creates the dataset scores; e) The composite index is a weighted sum of the Factors (also called WF—weighted factor), where the weights are taken in accordance with the variance explained by each factor.
Using the WF values and a WARD clustering procedure, a classification tree was produced for each model, i.e. the municipalities were classified into similar groups, where inside the group the WF values are close, but there are distances between the groups. The values of Factors estimated for each municipality enabled to produce the maps reflecting their position related to other towns. These maps together with the composite indices (WF) and classification trees provided the tools enabling to compare the municipalities’ performance in the child safety context.
5. Results
5.1. Injury Characteristics
The Injury domain was characterized by 12 basic indicators, of which 5 were considered as summary ones (see Table A1 in App. A), with no optional definition. Thus, for this domain, two trials of the analysis were carried out: with a reduced set of basic indicators (only summary ones), and with the whole set of basic indicators. In both trials, two factors were fitted to the data, explaining 98% and 97% of the total variation, respectively. Comparing the results of two analyses, a similarity was noted both in factors’ loading by basic indicators and the municipalities’ position according to the factors’ and WF values. Thus, further interpretation of findings focused on the trial using summary indicators only. Based on the results of this analysis, Figure 2(a) demonstrates the municipalities’ map where those are plotted using the factors values, and Figure 2(b) presents the classification tree created. The horizontal axle of classification tree demonstrates a distance between the units compared in accordance with the factor values estimated in this domain.
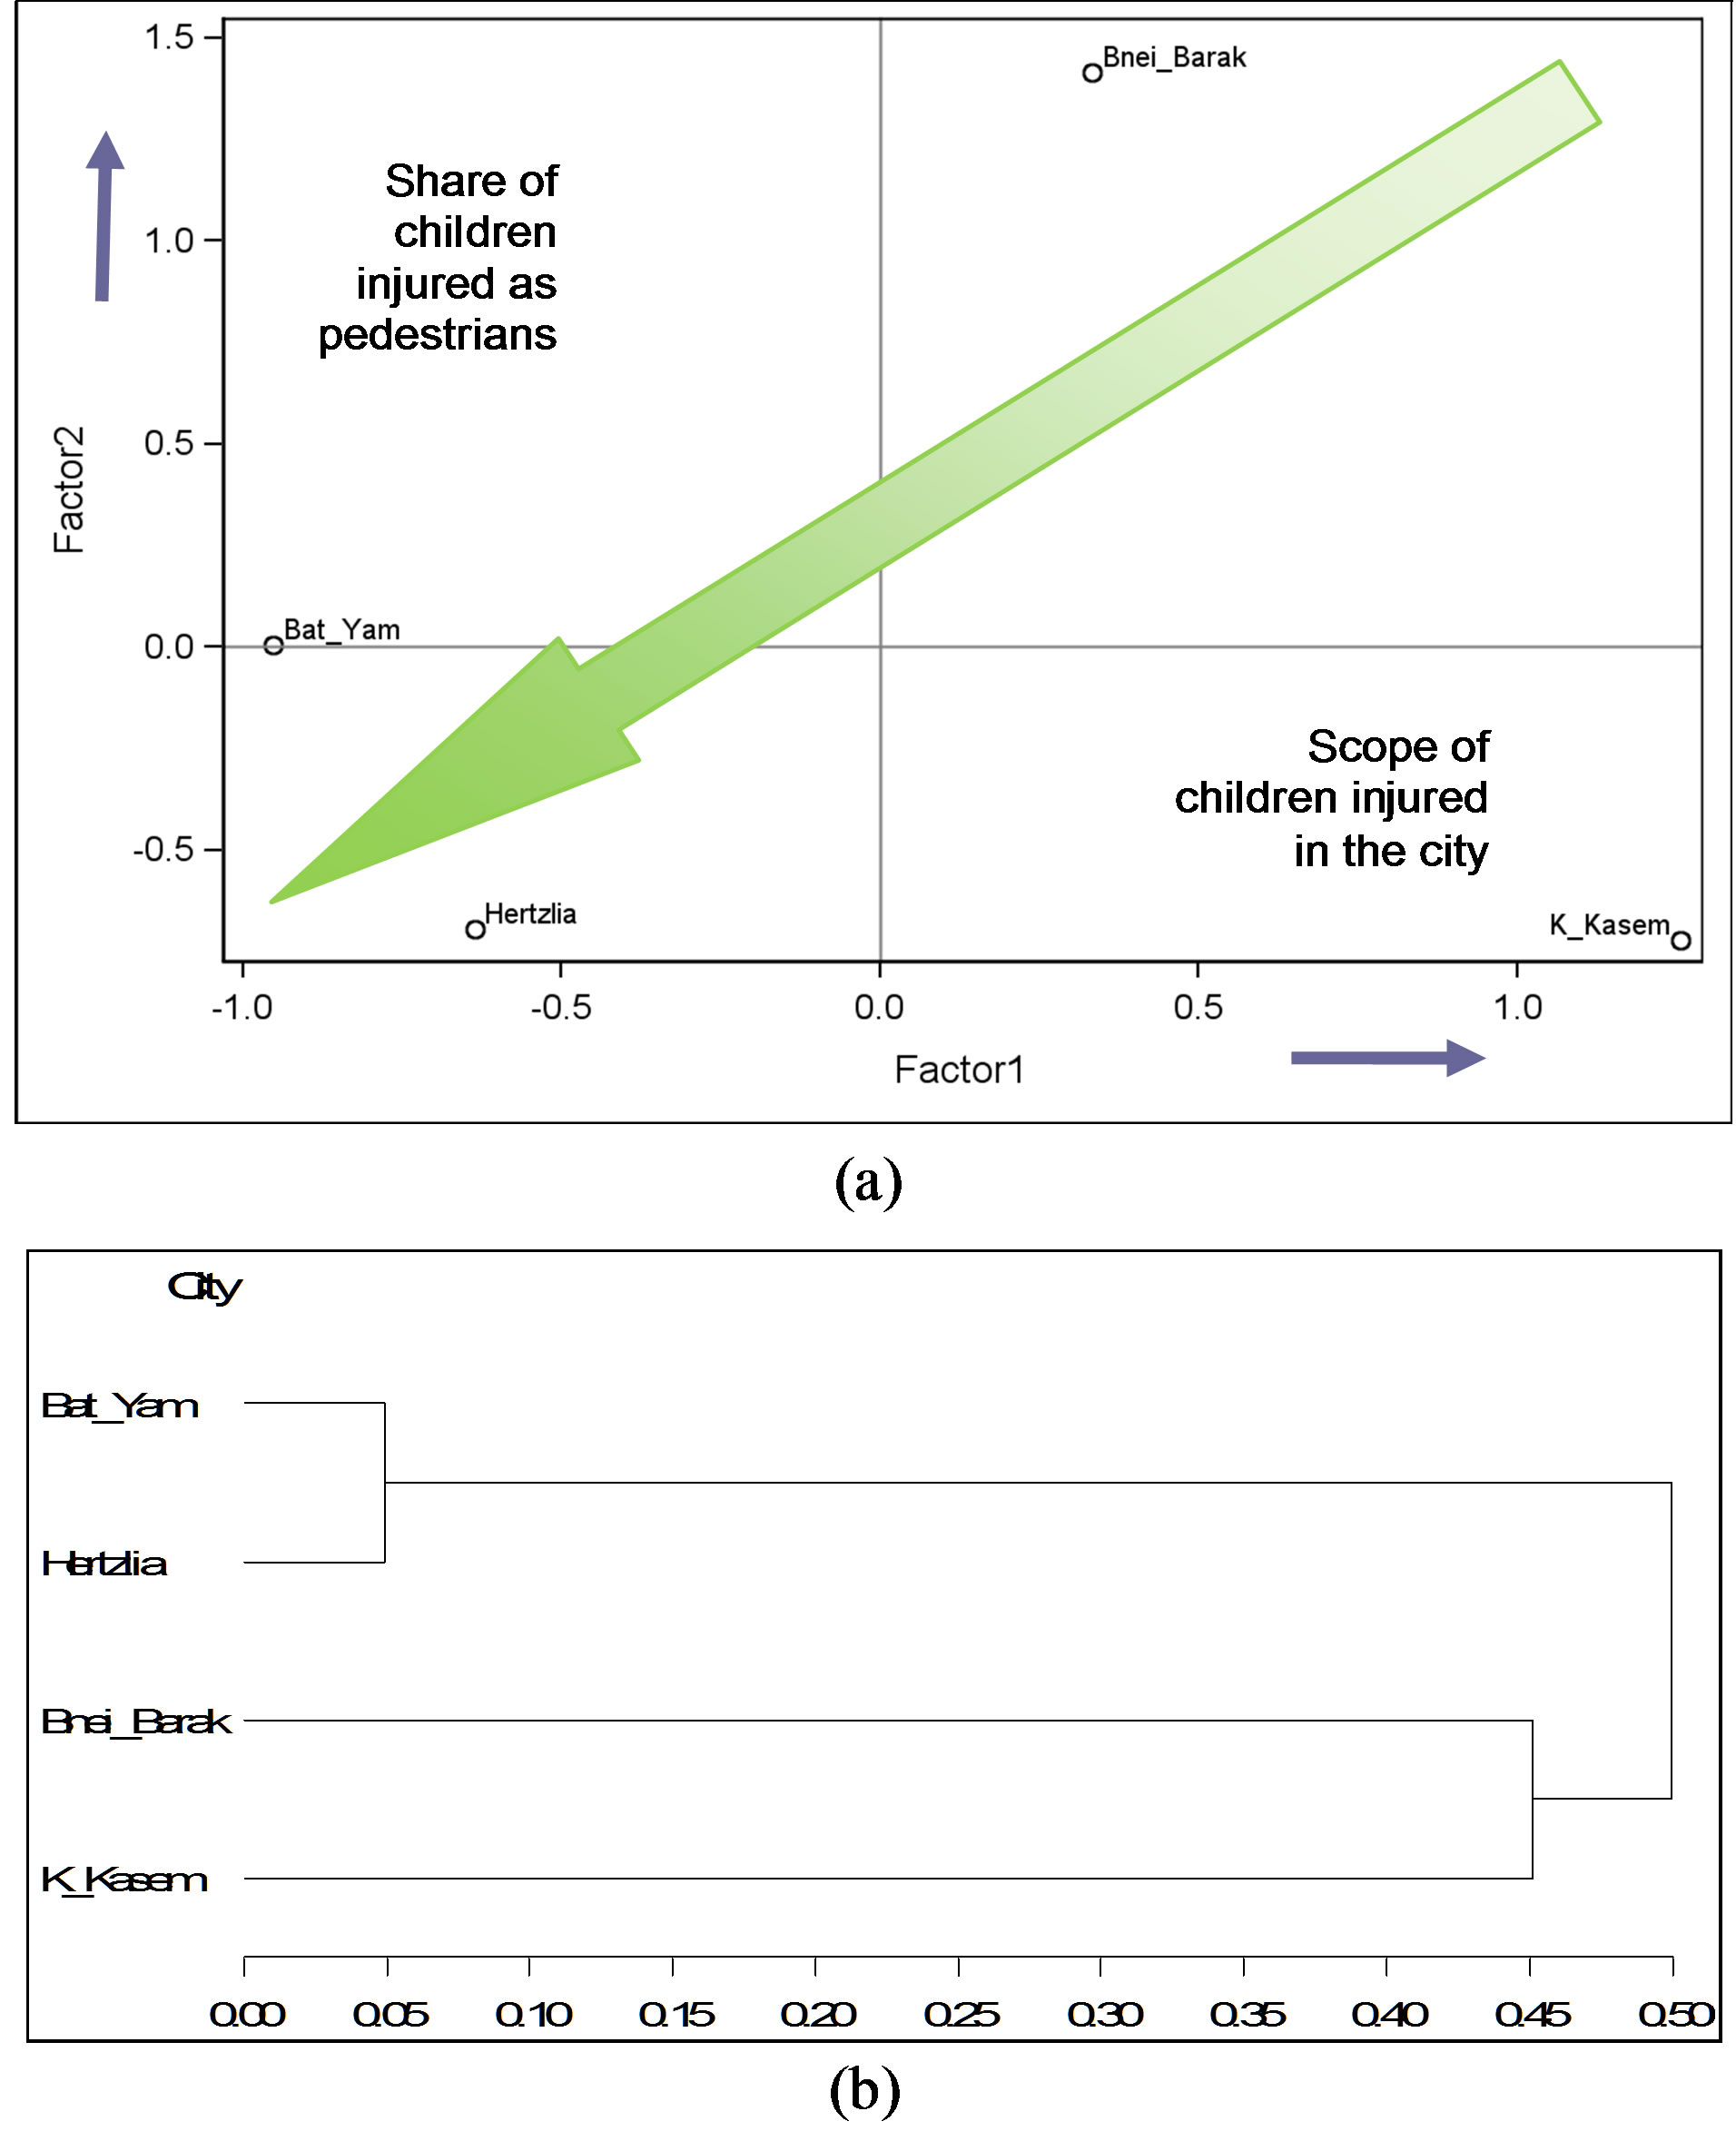
Figure 2. Results of FA of Injury domain: (a) The municipalities’ map—cities’ positions on the dimensions of factors fitted; and (b) The classification tree.
According to the results of this analysis, higher value of Factor 1 is associated with larger scope of child injury in the city, where higher value of Factor 2 reflects higher share of children injured as pedestrians. Thus, in this model, better safety position can be associated with lower values of both factors (as indicated by green arrow in Figure 2(a)). Looking at all the results together, it can be stated that in this domain municipalities Hertzlia and Bat-Yam share a similar safety position which is much better compared with two other cities, where the cities Bnei-Barak and K-Kasem belong to worse safety position but in a different way (cannot be classified into one group). In addition, concerning the basic indicators’ behavior, similarity was noted for summary variables such as: the rates of children killed or injured per population and the percentage of children among injuries in the city, as well as for shares of children injured as pedestrians and vehicle passengers. Moreover, the trial with the whole set of basic indicators demonstrated similarity in behavior of indicators gathering termed “children injured in the municipality’s territory” versus that termed “children residents of the municipality who were injured anywhere” (see Table 1), supporting a previous assumption that summary indicators were sufficient for the characteristic of Injury domain.
5.2. Background Characteristics
The Background characteristics domain comprised 14 basic indicators of which 6 were summary ones, including one optional (see Table A2). Thus, for this domain, four trials of the analysis were carried out: two with a set of summary indicators but various optional one, and another two with the whole set of basic indicators and various optional one. In all trials, two factors were fitted to the data, explaining 78% - 80% of the total variation. Comparing the results of analyses, a clear similarity was seen in Factors’ loading and other results of trials with different forms of optional indicator. Furthermore, certain similarity was found in the municipalities’ position according to the Factors, WF values and classification trees received in all the trials. Using the results of a trial based on five summary indicators, Figure 3(a) demonstrates the municipalities’ map and Figure 3(b)—the classification tree created. According to factors’ loading, higher value of Factor 1 is associated with higher socioeconomic level of the city, where Factor 2 reflects mostly the population size and traffic exposure of the city (in terms of vehicle rate per population and the ratio of active versus static population of the city); thus, its higher value indicated higher motorization level of the city. It can be seen on Figure 3 that all the municipalities received different positions according to the background factors fitted, where Hertzlia can be recognized as the most developed city.
Concerning the basic indicators behavior, it was observed that the behavior of indices reflecting the shares of various children age groups was similar to that of total share of children aged 0 - 17, where the percent of Jewish population, index of inequality and the share of receiving income support behaved similarly to summary indicators composing Factor 2. Those similarities supported the conclusion that summary indicators were sufficient for understanding the Background characteristics domain.
5.3. Behaviors
The Behaviors domain included three components: use of child safety restraints in cars; characteristics of bicycle riding and arrival to school conditions. This domain consists of 39 basic indicators of which 8 are summary ones (see Table A3). For this domain, two trials of the analysis were carried out: with a reduced set of summary indicators only and with the whole set of basic indicators. In each trial, two factors were fitted to the data, explaining 91% and 88% of the total variation, respectively. Comparing the results of two analyses, clear similarity was seen in the municipalities’ position according to the factors’ maps, WF values and classification trees received. Figure 4 demonstrates the municipalities’ map and the classification tree created based on the results of summary indicators’ analysis. In this model, Factor 1 associated
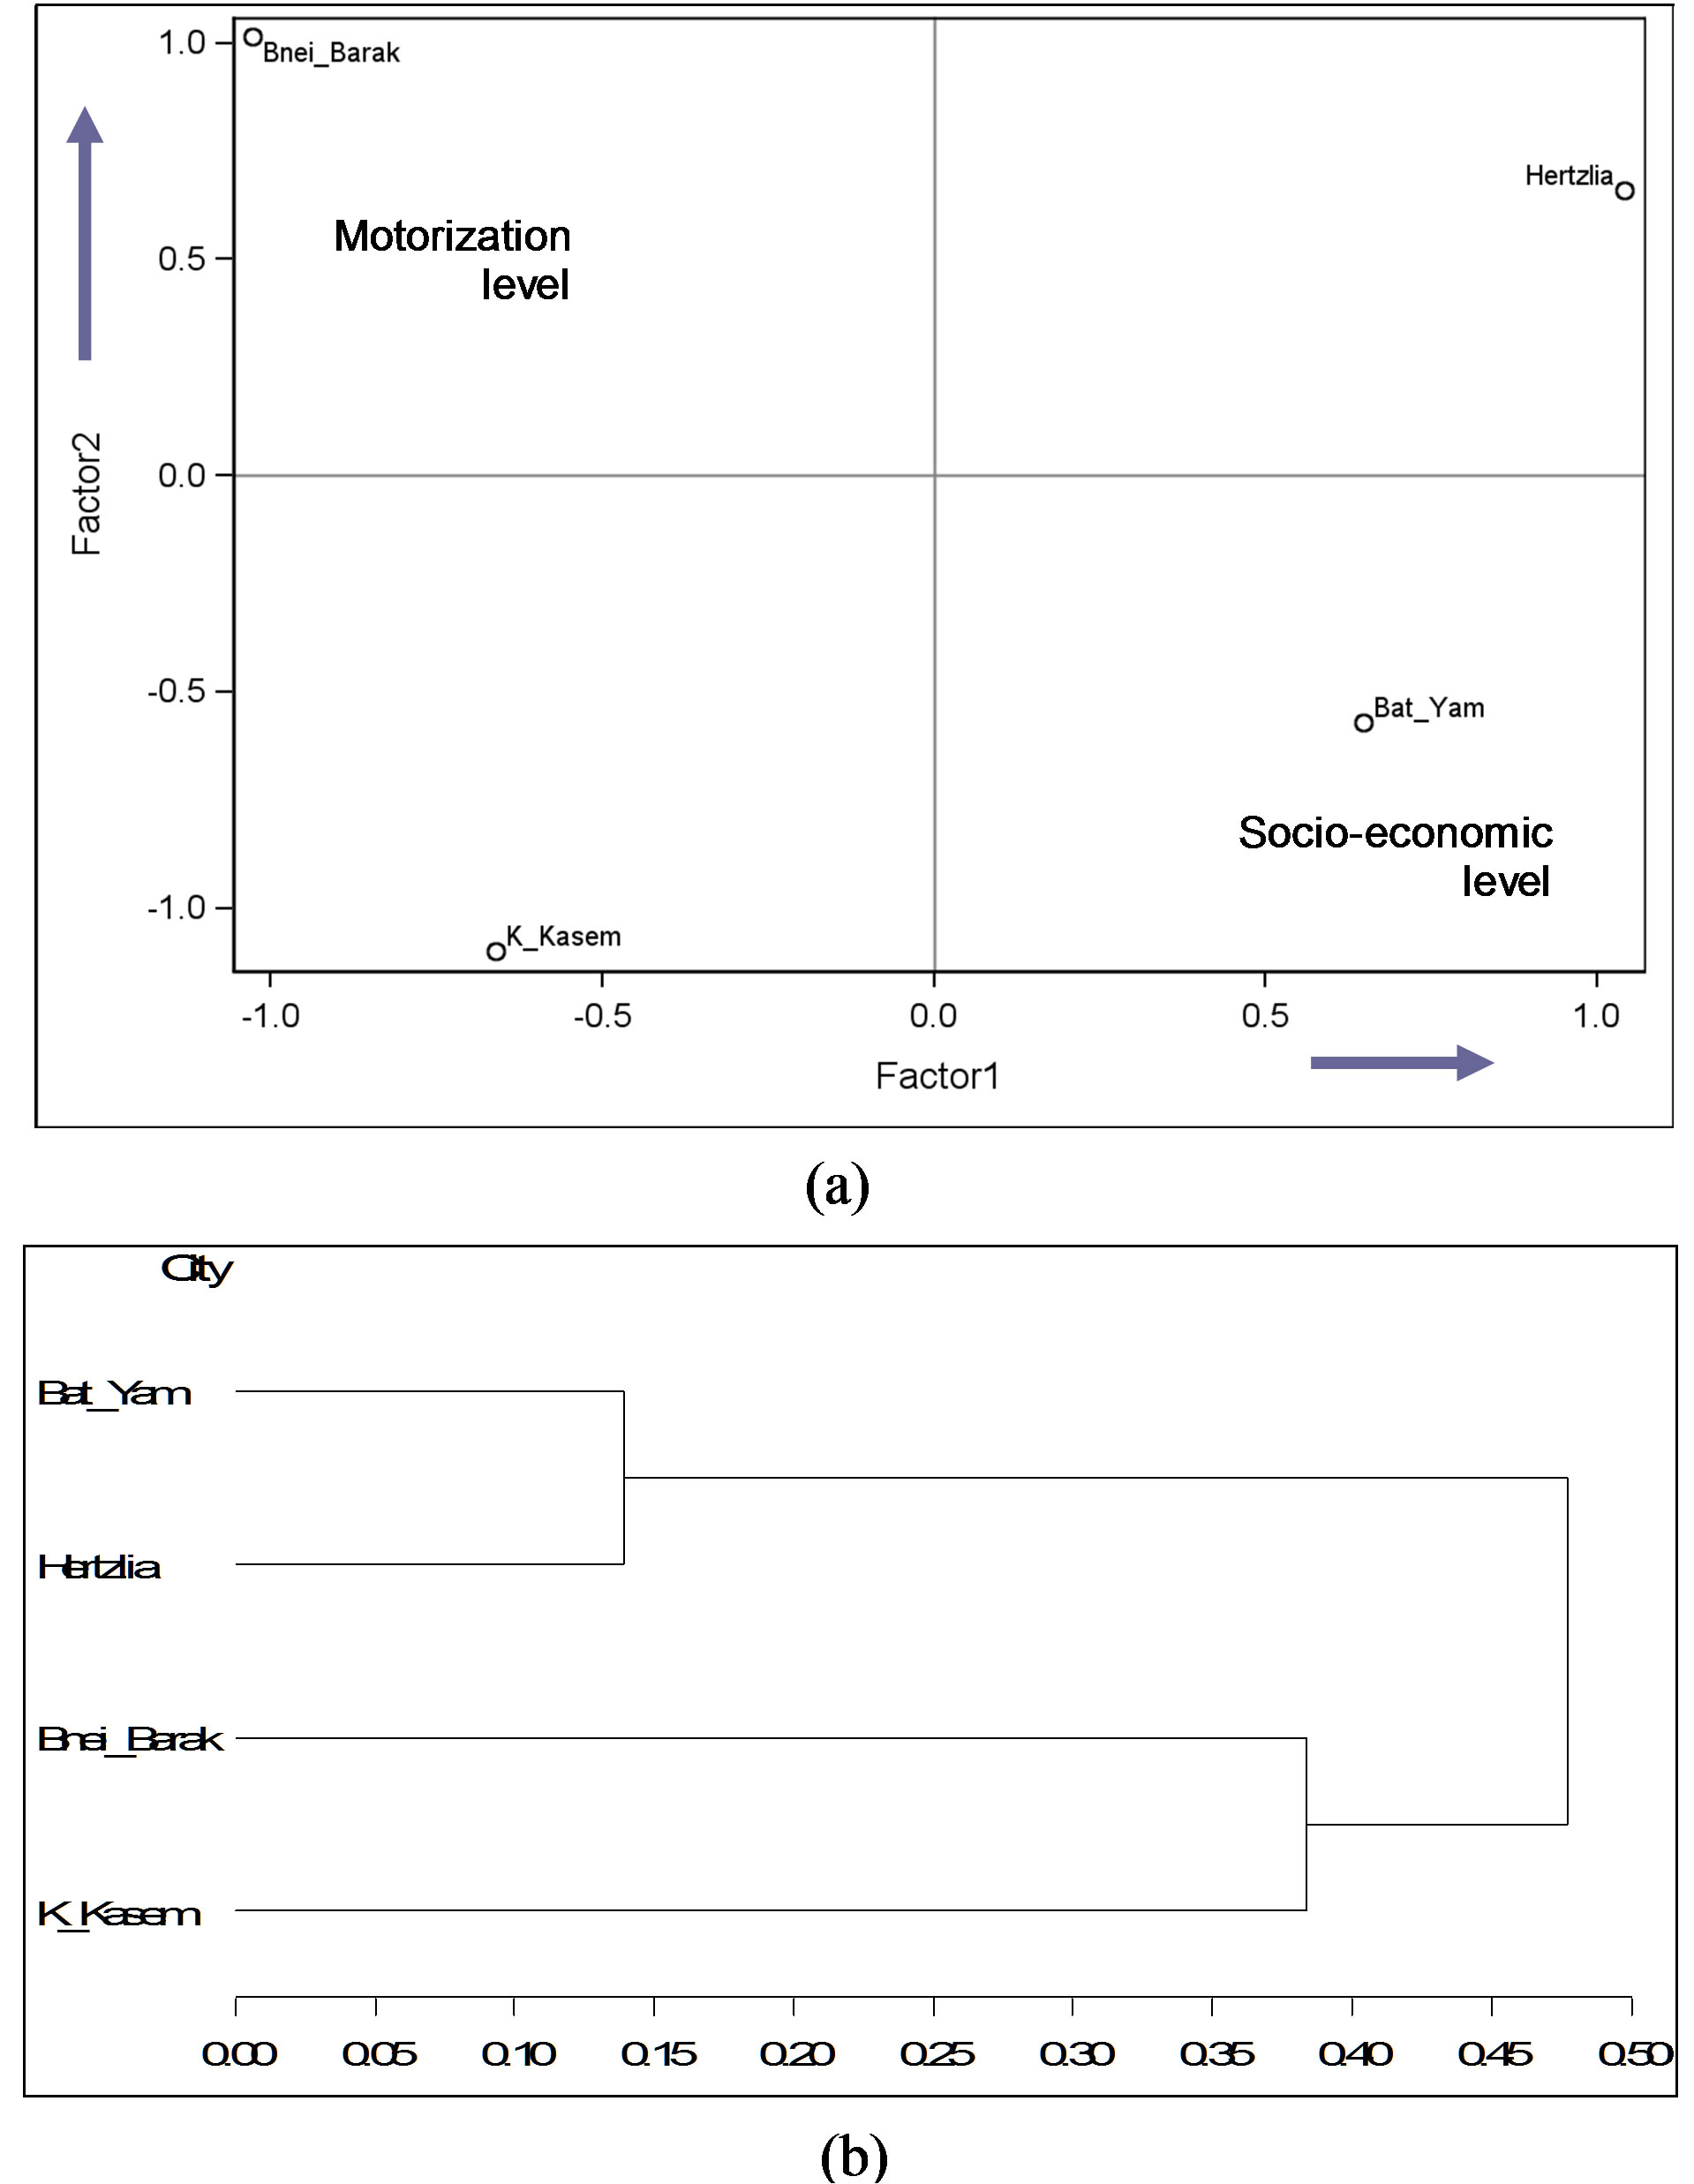
Figure 3. Results of FA of Background characteristics domain: (a) The municipalities’ map; and (b) The classification tree.
mostly with indicators of using child safety restraints in cars, infrastructure promoting walking to school and safe driving near the school, where Factor 2 reflected mostly unsafe crossing near the school, non-wearing bicycle helmets and unsafe infrastructure near the school. Better safety position can be associated with higher value of Factor 1 and lower value of Factor 2 as indicated by green arrow in Figure 4(a). According to the results in this domain, Hertzlia maintains the best safety position and K-Kasem the worst, where Bat-Yam and Bnei-Barak share a similar intermediate position.
In the second analysis of the whole set of indicators, similarly to the previous results, Factor 1 was associated with positive safety behaviors like proper use of child safety restraints (in total and according to age groups), infrastructure promoting walking to school, use of bicycle helmets as well as the opposite to non-use of child safety restraints in cars, unsafe driving near the school and unsafe crossing near the school (e.g. these last variables loaded the factor with negative coefficients), where Factor 2 was associated with unsafe leaving a car near the school, unsafe driving near the school as well as the opposite to safer infrastructure near the school, riding on sidewalks, safe crossing and coming to school in a vehicle. The final meanings of the factors were similar to those received based on the reduced list of indicators, thus, supporting a conclusion that summary indicators would be sufficient for the characteristic of Behaviors domain.
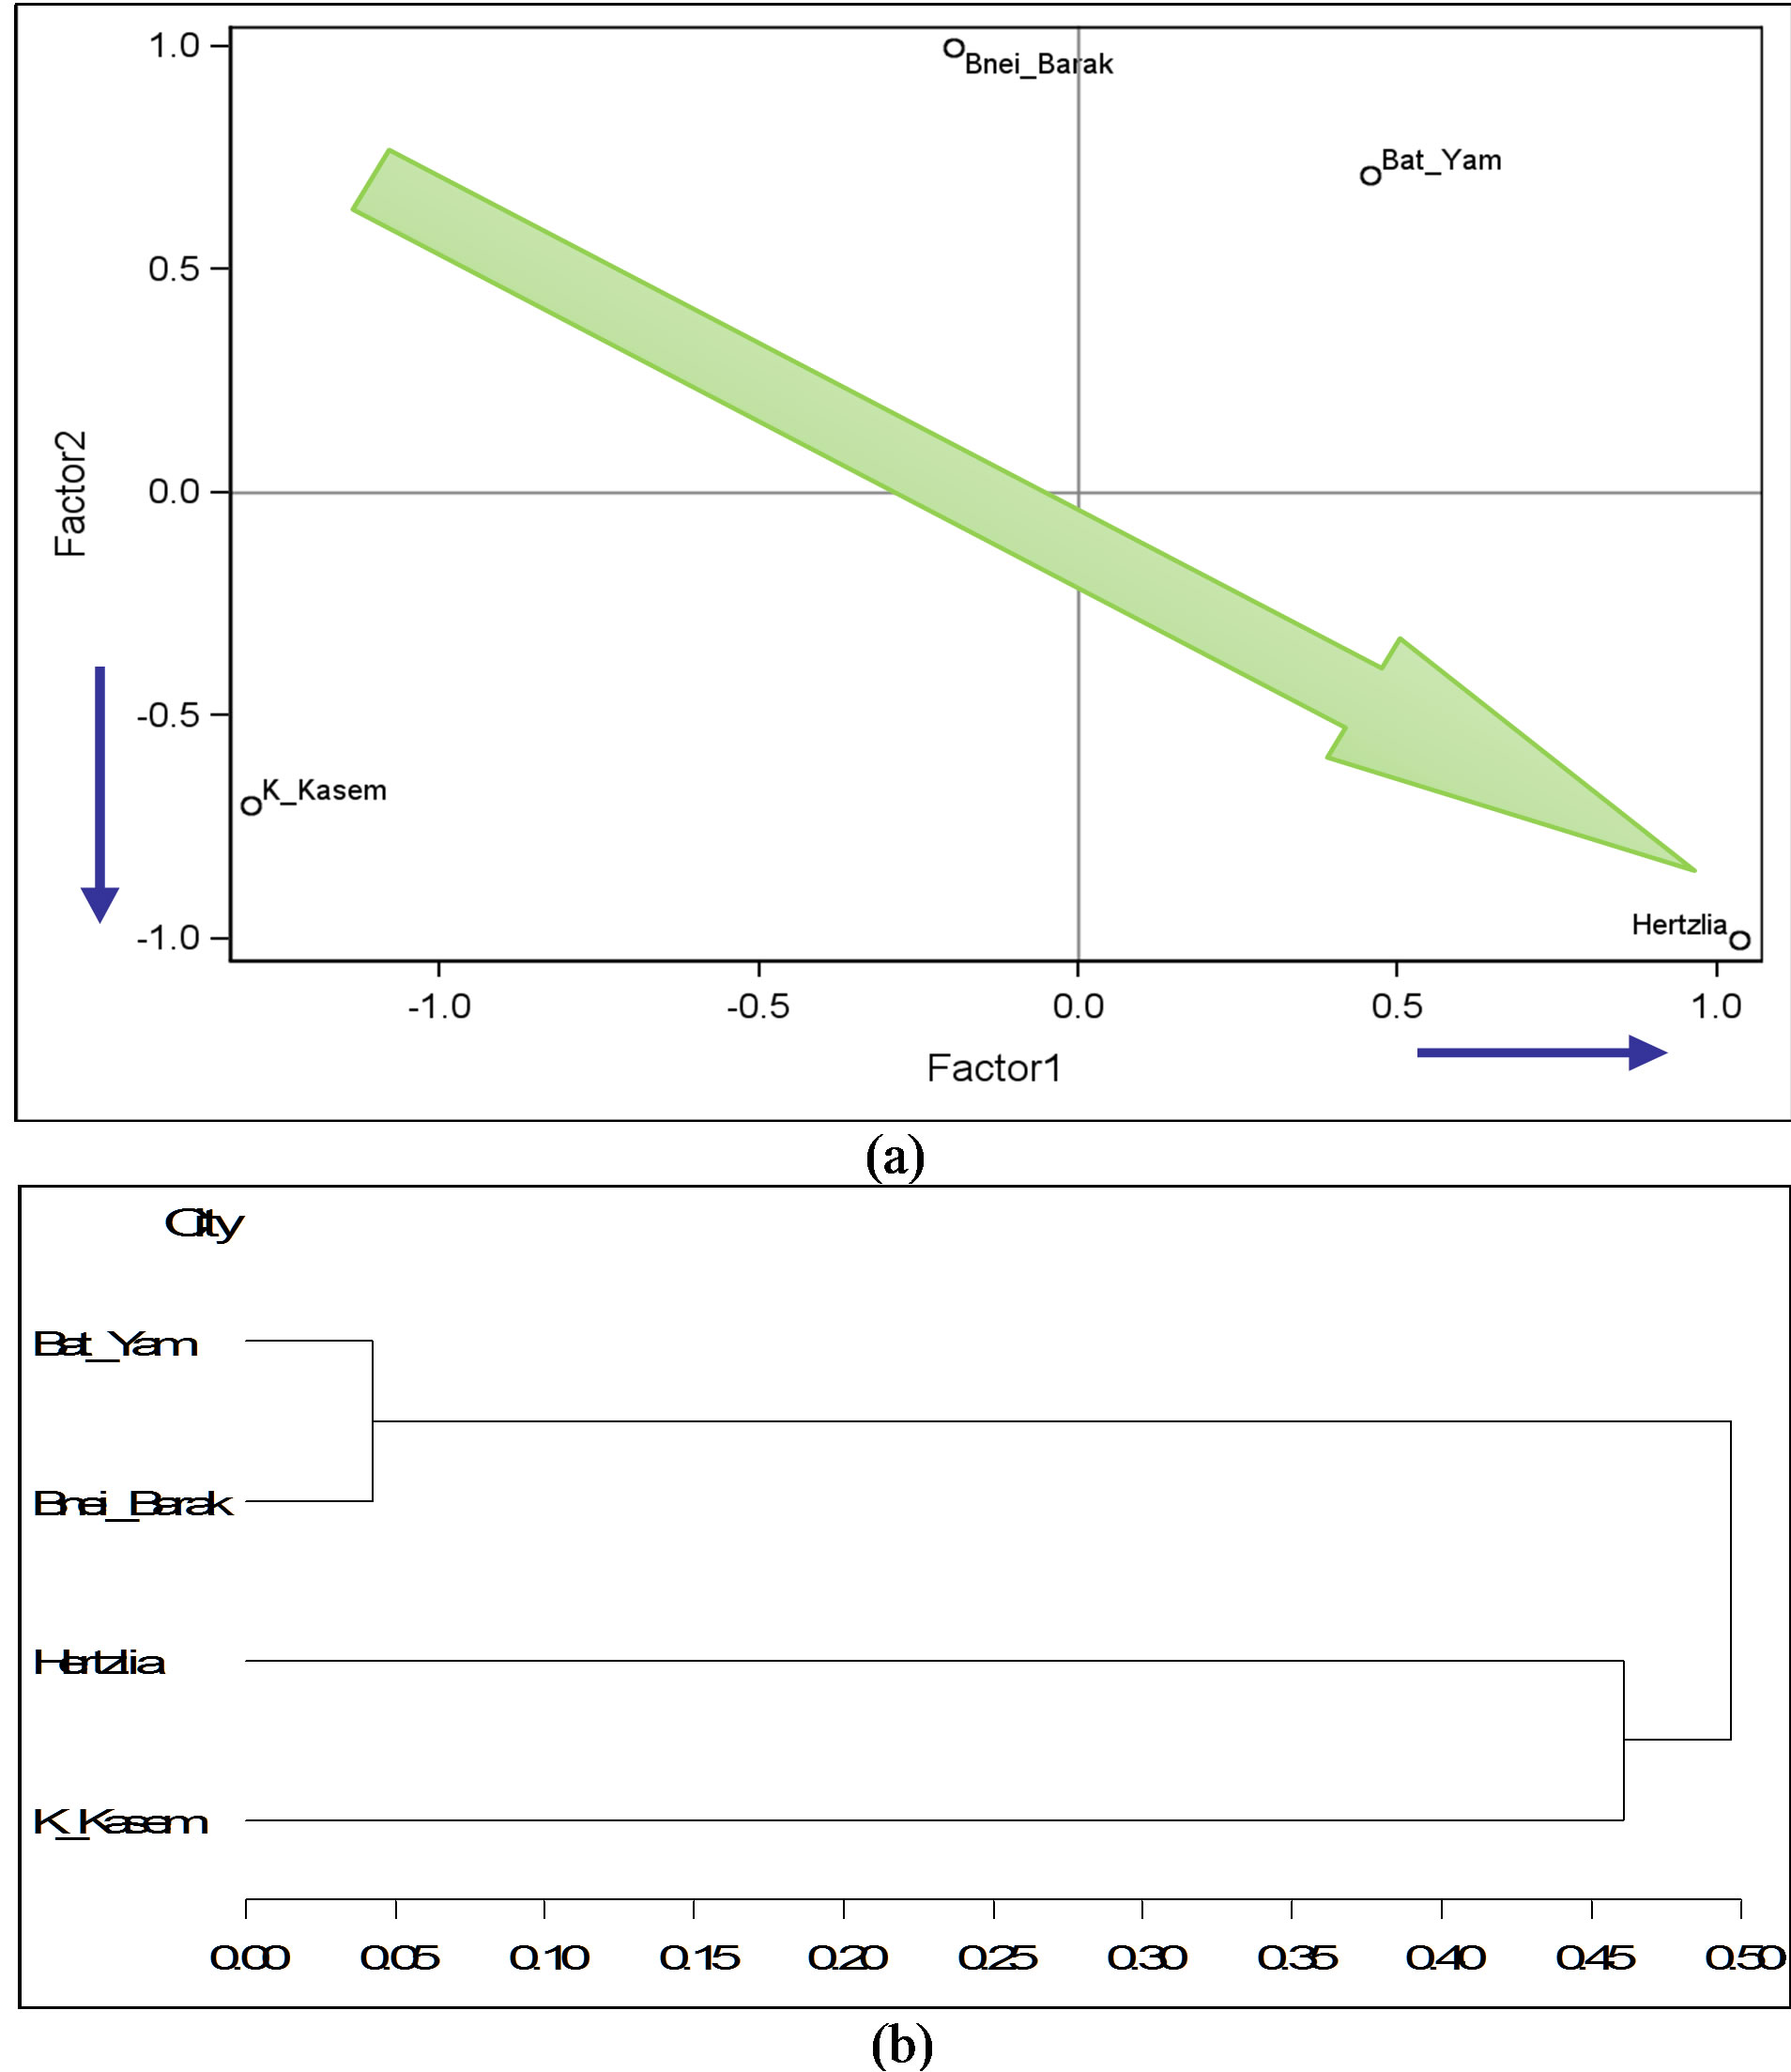
Figure 4. Results of FA of Behaviours domain: (a) The municipalities’ map; and (b) The classification tree.
5.4. Attitudes
The Attitudes domain comprised 20 basic indicators of which 10 were summary ones, including two optional (see Table A4). Thus, for this domain, four trials of the analysis were carried out. In all trials, two factors were fitted to the data, explaining 84% - 91% of the total variation. In this domain, higher value of any basic indicator was safety-desirable and thus, in all the trials, higher values of both factors were associated with better safety position of the city. However, the results of four analyses were inconsistent as to the final grouping of municipalities and their position on factors’ maps. In general, the results of trials based on the summary indicators set agreed that Hertzlia kept the best position, KKasem—the worst one, and Bat-Yam and Bnei-Barak shared a similar intermediate position; the trials with the whole set of basic indicators found a similarity between Hertzlia and Bat-Yam where Bnei-Barak and K-Kasem were very different. However, a remarkable finding was that according to all four trials the values of composite index (WF) produced the same ranking among the municipalities compared, i.e. the best position for Hertzlia, followed by Bat-Yam, Bnei-Barak and then K-Kasem.
Another interesting finding was that using the optional definitions of basic indicators which are less categorical in their meaning, e.g. “a child uses safety restraints in all or in most trips” instead of “a child uses child safety restraints in all trips”; “a child wears bicycle helmets in all or in most rides” instead of “a child wears bicycle helmets in all rides”—highlighted the best municipality position compared to others and strengthened the level of fitting between the summary indicators. The trial with summary indicators and optional values was characterized by the highest value of total variation explained (91%), had a more clear structure of factors received, and thus, its results were preferred for understanding the Attitudes’ domain. In this model, all the basic indicators except for one loaded Factor 1 where the variable reflecting residents’ belief that the Mayor ascribes high importance to the topic of child safety in the town loaded Factor 2. Figure 5 presents the municipalities’ map and classification tree received in this trial, where better safety position is associated with higher values of both factors that is indicated by green arrow in Figure 5(a).
Moreover, among the summary indicators analyzed, a similar contribution to creating a composite index was seen in behavior of some indicators, e.g. those reflecting residents’ agreement that walking to school is not dangerous, riding a bicycle in the town is not dangerous and that, over the last years, the level of child safety in the neighborhood has improved. This implies that any of these indicators is suitable for the characteristic of residents’ attitudes as to the level of child safety in the town.
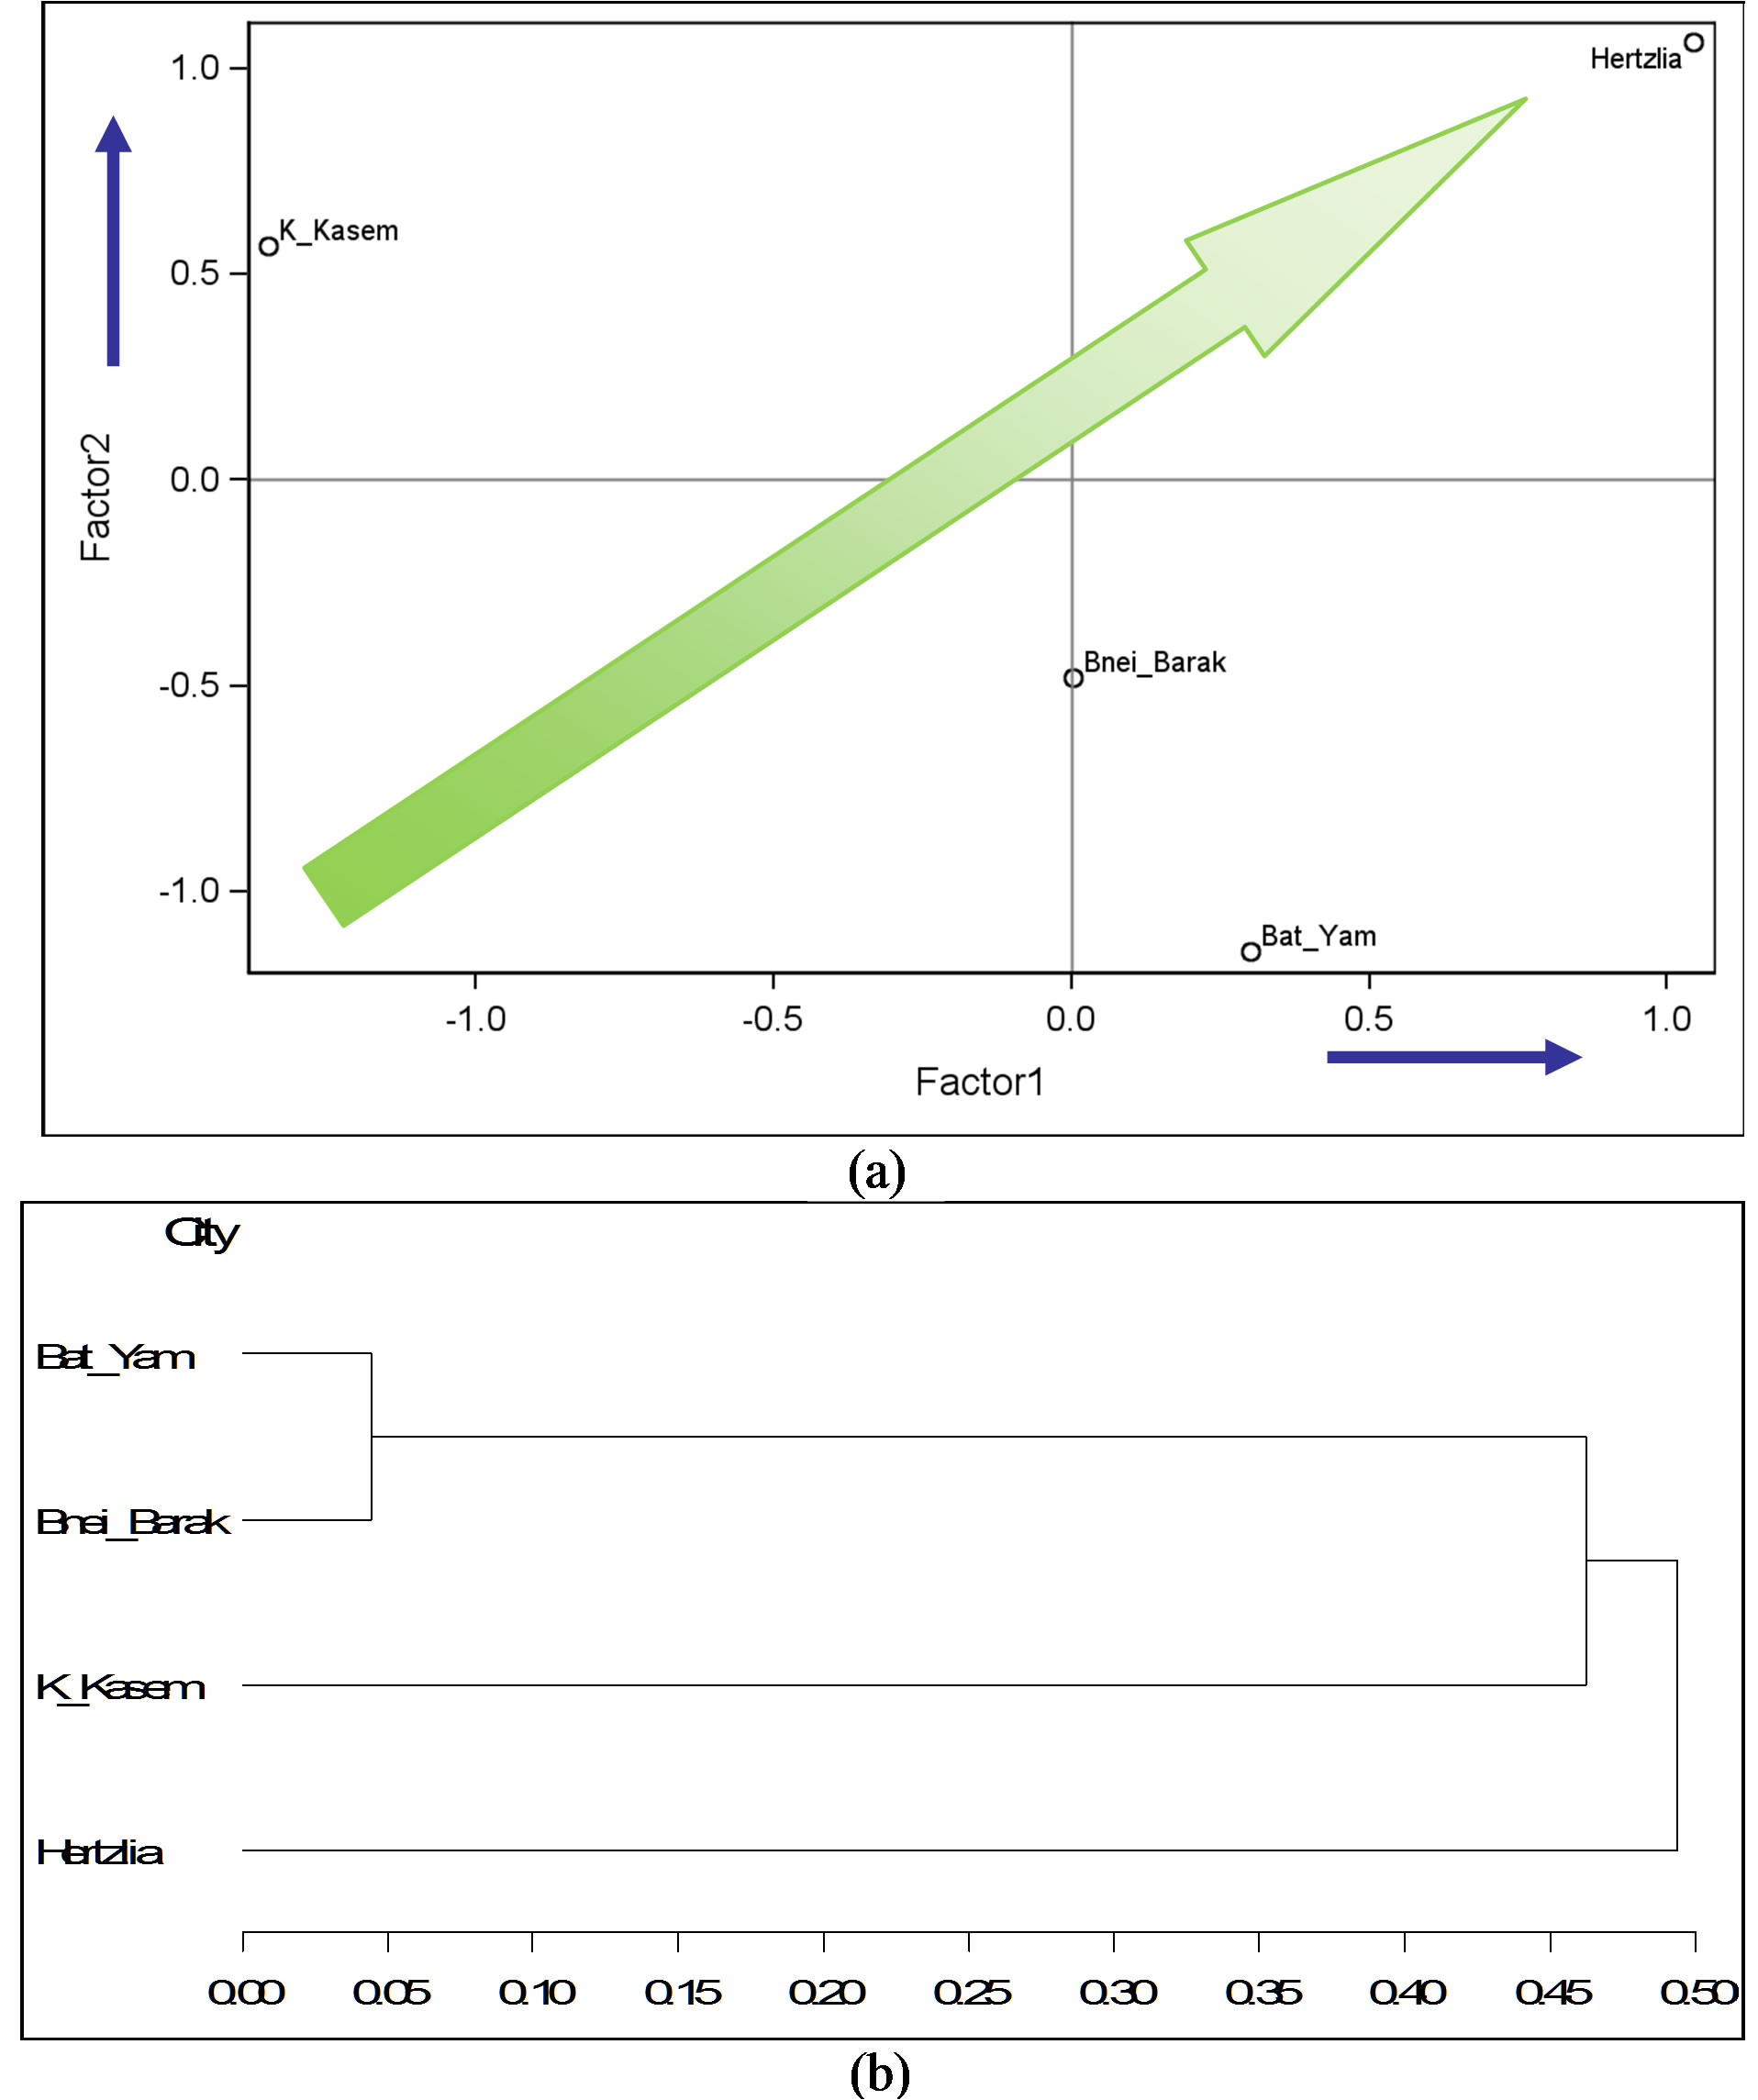
Figure 5. Results of FA of Attitudes domain: (a) The municipalities’ map; and (b) The classification tree.
5.5. Policy and Management
For this domain 8 basic indicators were defined, with one summary indicator. Prior to the analysis, the values were transformed into percentage of maximum possible score. One analysis was carried out, with all basic indicators. Two factors were fitted to the data, explaining 96% of the total variation. Figure 6 demonstrates the municipalities' map and the classification tree created for this domain. According to factors’ loading, Factor 1 was associated mostly with the availability of mission and policy, additional programs, existence of management structure and budget, monitoring and the availability of all components in total (the summary indicator), where Factor 2 reflected mostly the availability of working plans and documenting/reporting. Higher values of both factors are associated with better safety management in the municipality—see green arrow in Figure 6(a). According to the results, in this domain, Hertzlia and Bat-Yam share the best safety position, followed by Bnei-Barak and then K-Kasem, where the last two municipalities are very different.
6. Discussion and Conclusions
The study aimed at developing indicators of child road safety in a municipality, which would enable meaningful measurement and comparison between the towns, together with over-time monitoring of trends and progress in the future. Due to the complexity of the topic, a simple
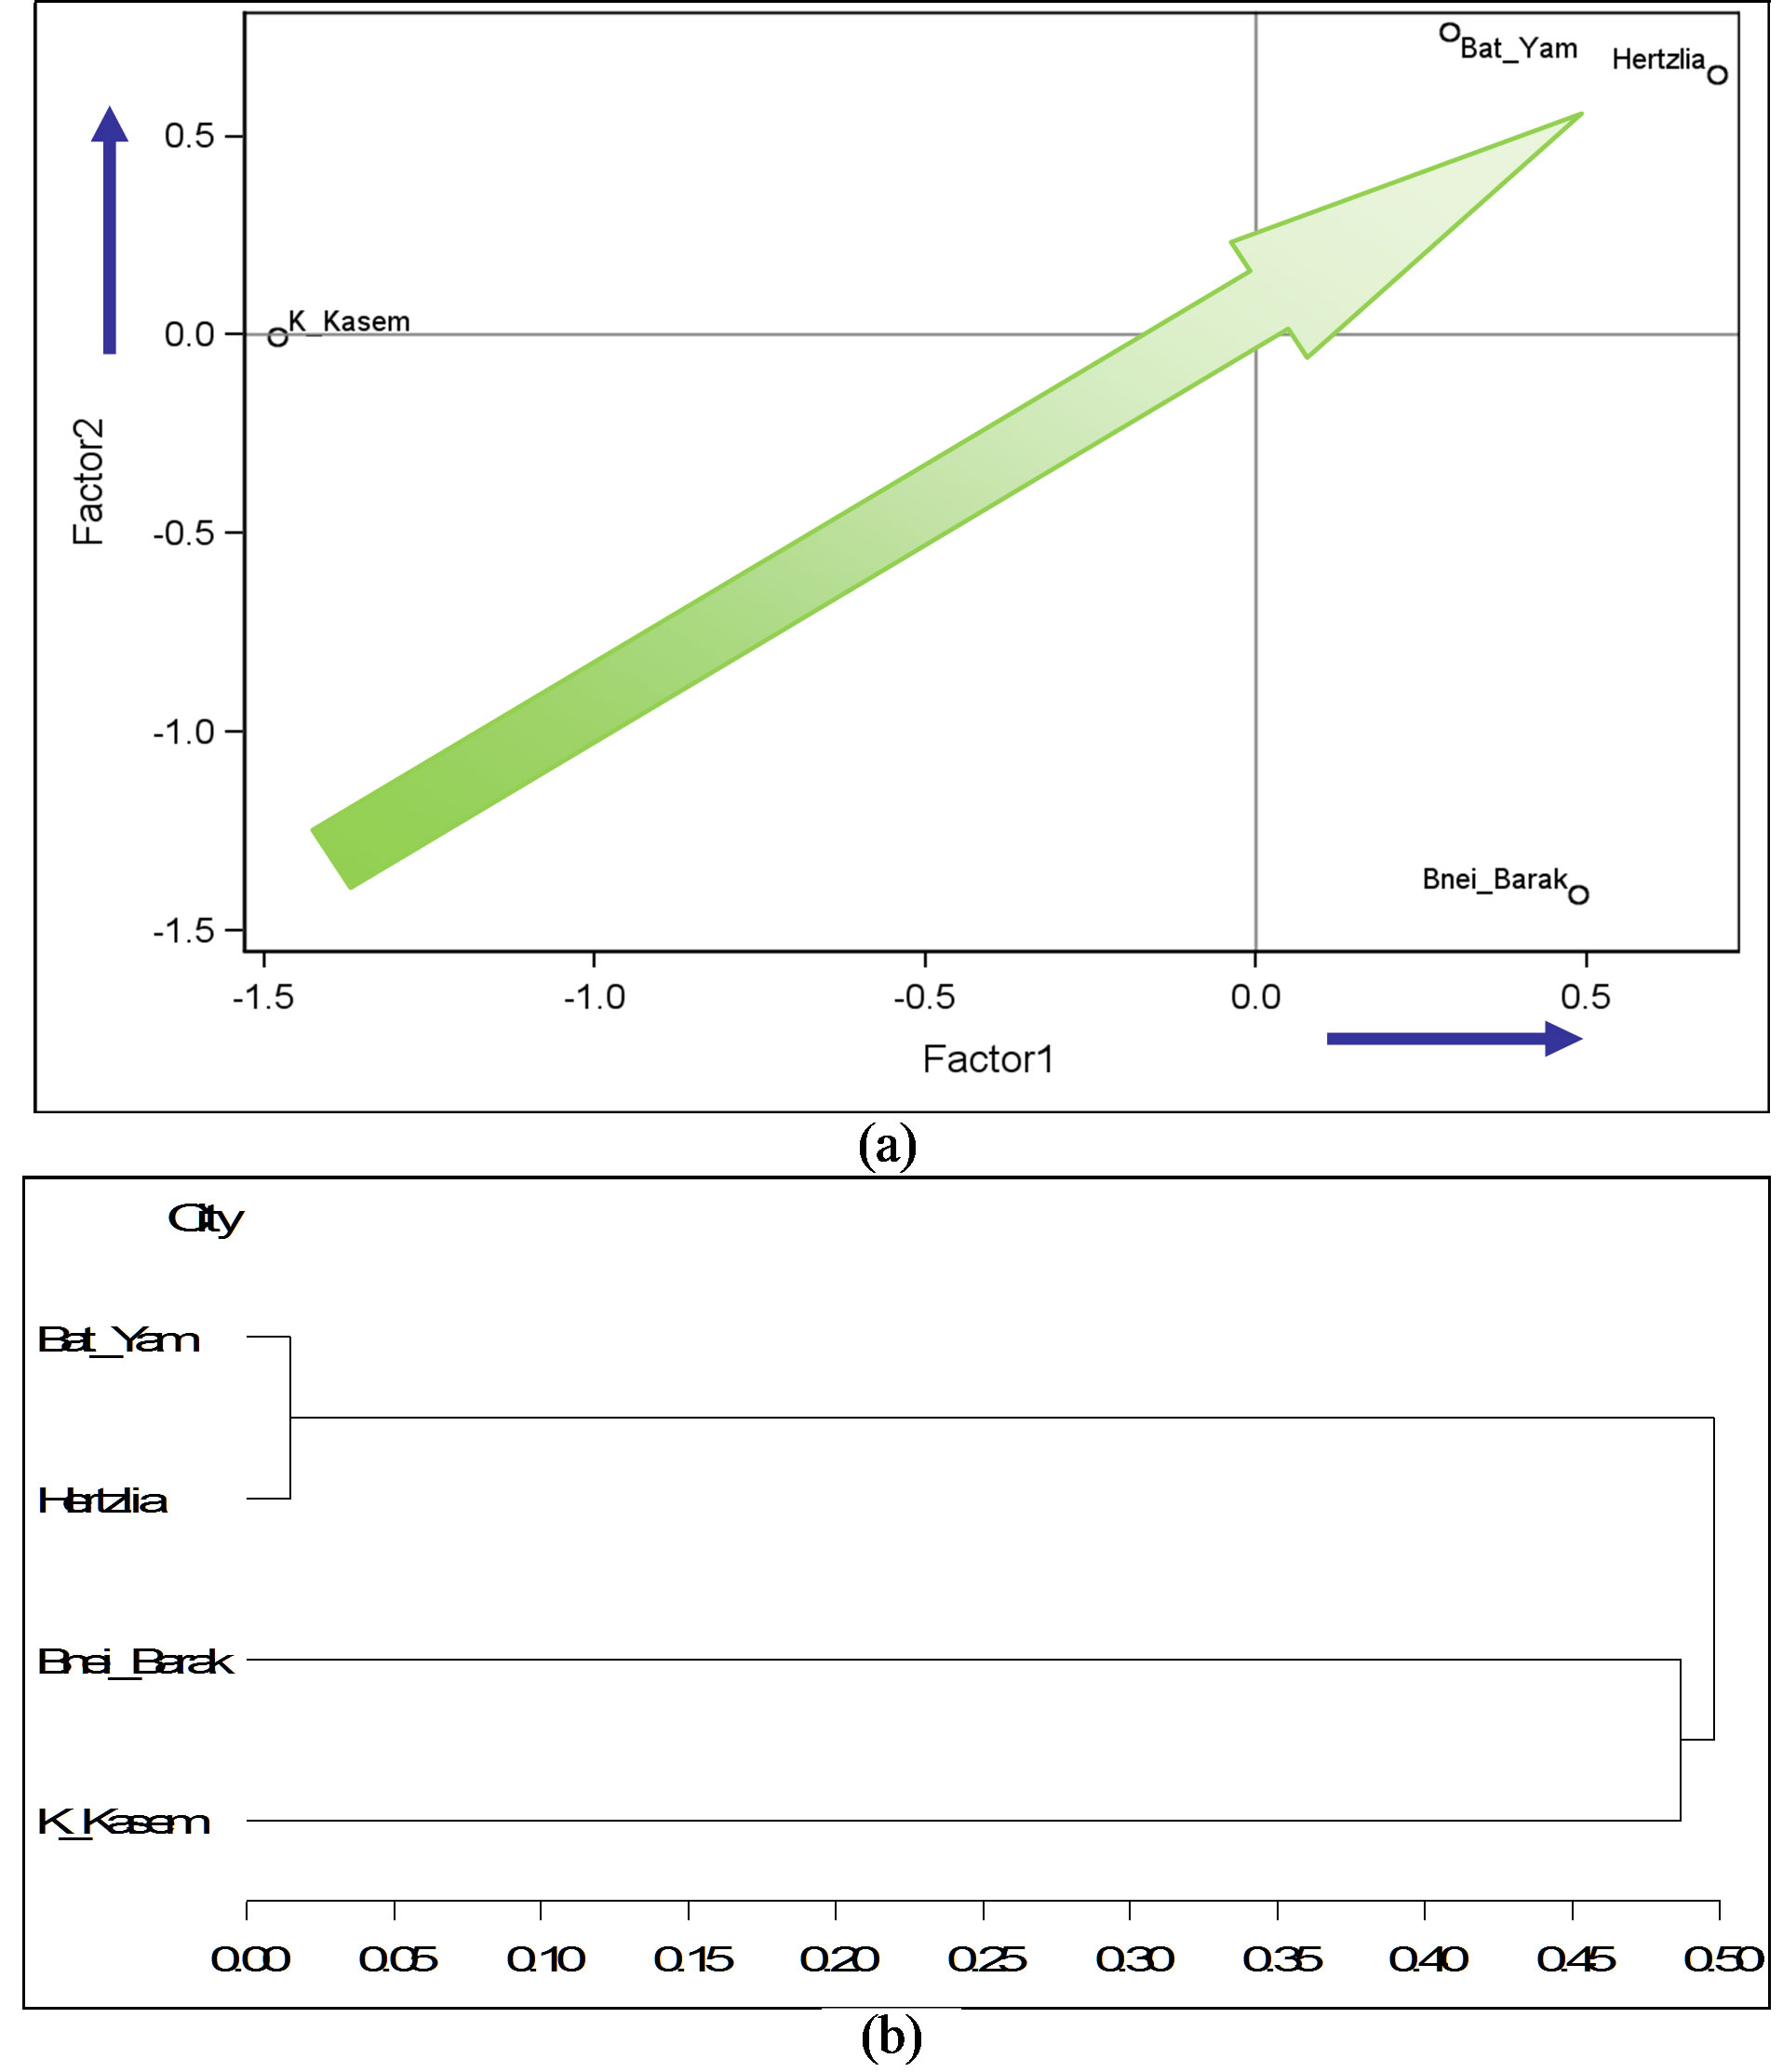
Figure 6. Results of FA of Policy and management domain: (a) The municipalities’ map; and (b) The classification tree.
description by means of a limited number of indicators was not feasible. Moreover, the indicators were supposed to be measurable for most municipalities and acceptable to the different stakeholders involved, e.g. municipal managers, higher level decision-makers, safety experts. Therefore, major efforts were undertaken at the beginning to define the need for each of the indicators and to conduct further detailed translation of the selected indicators into measurable ones.
The structure of the indicator set developed included the domains of town background characteristics, road traffic injury, road user behaviours, attitudes of the municipality residents and management system in the town, where all those were related to the topic of child road safety. It can be noted that the domains defined by the study are in line with the common approaches in road safety field, such as analysis of the actors involved— human, infrastructure, vehicles, or consideration of various levels of the road safety pyramid [12-14], but applied on a local level.
To examine the sets of indicators suggested, a pilot study was undertaken in four municipalities, in which the entire set of indicators was estimated. The pilot demonstrated that all the indicators are measurable. However, some of the measurements were more time-consuming than others, e.g., behavior characteristics which require observational surveys or policy and management characteristics which are based on multiple contacts with representatives of authorities.
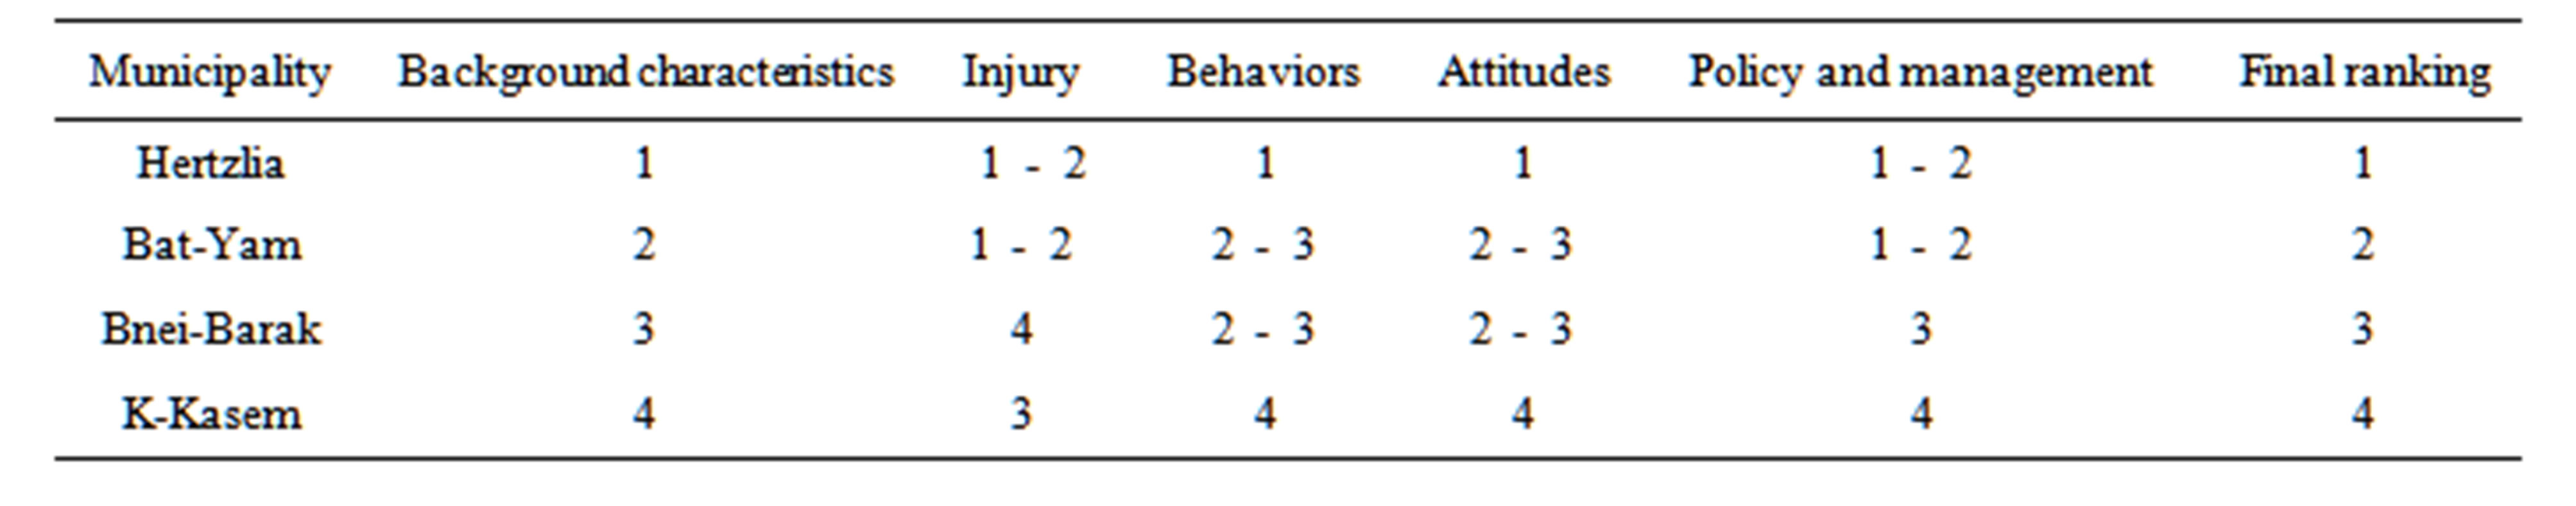
Table 2. Ranking of pilot’s municipalities in accordance with the FA results.
Following the data collection, a series of reports with various city characteristics were produced raising a question how to perform a significant comparison between the cities which would highlight the main findings. Thus, the statistical models of Factor Analysis were applied aiming to group the lists of basic indicators into a composite index having more general meanings. In spite of a small number of units involved in the pilot—only four municipalities, the FA demonstrated an applicable and reasonable way of aggregating the indicators’ meaning, for each domain considered. Moreover, due to similarities observed in indicators’ behaviors, in the majority of cases, a reduced set of basic indicators, including summary indicators only, was recommended for further application.
The analysis produced a number of tools enabling a meaningful and aggregated comparison of the units, which are: the municipalities’ maps, classification trees and composite indices, for each of the five domains considered. The FA also supplied the tools—scoring coefficients, factors’ weights, means and variances of the variables, enabling to estimate the position of any additional municipality for which the data are collected. Using the classification trees and composite indices, a summary ranking of the municipalities compared, across all the domains considered, can be performed. For example, Table 2 presents the pilot towns, which are ranked according to the results in each domain, where the final ranking was estimated as an average of the municipality’s position across the domains of Injury, Behaviors, Attitudes and Policy and management.
The child road safety indicators developed as well as the composite indices and comparison tools provided by the study may be utilized by municipalities for measuring current road safety level and practices and monitoring progress over-time. National authorities may use the indicator set and the approach suggested to compare urban communities at a regional or a country level. A re-running of factor analysis based on the data collected for higher number of towns would be appropriate in the future, enabling a fine-tuning of the estimation tools.
7. Acknowledgements
Appreciation is extended to the Research Fund on Insurance Matters, affiliated with the Israel Insurance Association for support of this research. We would like to thank the members of the expert panel whose fruitful discussions contributed to the definition of the indicators’ framework.
REFERENCES
- M. Peden, K. Oyegbite, J. Ozanne-Smith, A. A. Hyder, C. Branche, F. Rahman, F. Rivara and K. Bartolomeos, “World Report on Child Injury Prevention,” World Health Organization, Geneva, 2008.
- M. Ivancovsky and S. Kislev, “Child Injuries in Israel: Beterem National Report 2010,” Beterem-Safe Kids Israel, Publication No. 1072, Petach Tikva, 2011.
- National Road Safety Authority, “Trends in Traffic Safety in Israel 2000-2010,” Jerusalem, 2011.
- K. Peleg, “Injuries in Road Accidents 2001-2007: Data from the Trauma Registry at Eight Medical Centers in Israel,” Israel National Center for Trauma and Emergency Medicine, Gertner Institute for Epidemiology and Health Policy Research, 2009.
- F. P. Rivara, D. C. Thompson and R. S. Thompson, “Epidemiology of Bicycle Injuries and Risk Factors for Serious Injury,” Injury Prevention, Vol. 3, No. 2, 1997, pp. 110-114. doi:10.1136/ip.3.2.110
- C. MacGregor, A. Smiley and W. Dunk, “Identifying Gaps in Child Pedestrian Safety Comparing What Children Do with What Parents Teach,” Transportation Research Record, Vol. 1674, No. 1, 1999, pp. 32-40.
- J. M. Plumert, J. K. Kearney and J. F. Cremer, “Children’s Road Crossing: A Window into Perceptual-Motor Development,” Current Directions Psychology Science, Vol. 16, No. 5, 2007, pp. 255-258. doi:10.1111/j.1467-8721.2007.00515.x
- Safe Kids USA, “Raising Kids One Stage at a Time: A Study of Child Development and Unintentional Injury,” Washington DC, 2009.
- C. V. Zegeer and M. Bushnell, “Pedestrian Crash Trends and Potential Countermeasures from around the World,” Accident Analysis & Prevention, Vol. 44, No. 1, 2012, pp. 3-11. doi:10.1016/j.aap.2010.12.007
- C. Staunton, D. Hubsmith and W. Kallins, “Promoting Safe Walking and Biking to School: The Marin County Success Story,” American Journal of Public Health, Vol. 93, No. 9, 2003, pp. 1431-1344. doi:10.2105/AJPH.93.9.1431
- V. Gitelman, D. Balasha, R. Carmel, L. Hendel and F. Pesahov, “Characterization of Pedestrian Accidents and an Examination of Infrastructure Measures to Improve Pedestrian Safety in Israel,” Accident Analysis & Prevention, Vol. 44, No. 1, 2012, pp. 63-73. doi:10.1016/j.aap.2010.11.017
- European Transport Safety Council, “Transport Safety Performance Indicators,” Brussels, 2001.
- Organisation for Economic Co-Operation and Development, “Towards Zero: Ambitious Road Safety Targets and the Safe System Approach,” Paris, 2008.
- F. Wegman, J. Commandeur, E. Doveh, V. Eksler, V. Gitelman, S. Hakkert, D. Lynam and S. Oppe, “SUNflowerNext: Towards a Composite Road Safety Performance Index,” SWOV Institute for Road Safety Research, Leidschendam, 2008.
- A. S. Hakkert, V. Gitelman and M. A. Vis, “Road Safety Performance Indicators: Theory,” Deliverable D3.6 of the EU FP6 Project Safety Net, 2007.
- E. Hermans, T. Brijs, G. Wets and K. Vanhoof, “Benchmarking Road Safety: Lessons to Learn from a Data Envelopment Analysis,” Accident Analysis and Prevention, Vol. 41, No. 1, 2009, pp. 174-182. doi:10.1016/j.aap.2008.10.010
- V. Gitelman, E. Doveh and S. Hakkert, “Designing a Composite Indicator for Road Safety,” Safety Science, Vol. 48, No. 9, 2010, pp. 1212-1224. doi:10.1016/j.ssci.2010.01.011
- B. Wilmots, E. Hermans, T. Brijs and G. Wets, “Setting up an Indicator System for Monitoring Road Safety Using the Road Safety Target Hierarchy,” Proceedings of the 15th International Conference Road Safety on Four Continents, Abu Dhabi, 28-30 March 2010, pp. 1154- 1165.
- I. Johnston, “Halving Roadway Fatalities: A Case Study from Victoria, Australia, 1989-2004,” Monash University, Melbourne, 2006.
- M. Stromgren and R. Andersson, “The Usage of Safety Management Tools in Swedish Municipalities,” Safety Science, Vol. 48, No. 3, 2010, pp. 288-295. doi:10.1016/j.ssci.2009.11.009
- M. Hemmo-Lotem, S. Shuman, L. Endy-Findling, O. Silvinger and C. Jinich-Aronowitz, “Beterem in the City: Safe Communities for Children,” Beterem-Safe Kids Israel, Petach Tikva, 2008.
- A. Spinks, C. Turner, J. Nixon, R.J. McClure, “The ‘WHO Safe Communities’ Model for the Prevention of Injury in Whole Populations,” Cochrane Database of Systematic Reviews, Vol. 3, No. 1, 2009, pp. 1-30.
- B. D. Johnston, “Injury Prevention in Safe Communities,” Injury Prevention, Vol. 17, No. 1, 2011, pp. 1-2. doi:10.1136/ip.2011.031591
- A. Mackie and P. Wells, “Gloucester Safer City: Final Report,” Report TRL589, Transport Research Laboratory, Crowthorne, 2003.
- Organisation for Economic Co-Operation and Development, “Keeping Children Safe in Traffic,” Paris, 2004.
- K. J. Clifton, A. D. L. Smith and D. Rodriguez, “The Development and Testing of an Audit for the Pedestrian Environment,” Landscape and Urban Planning, Vol. 80, No. 1-2, 2007, pp. 95-110. doi:10.1016/j.landurbplan.2006.06.008
- “Pedestrian Quality Needs”, Cost Action 358, Final Report, COST Foundation, Brussels, 2010.
- D. Zaidel, S. Levi and L. Endy-Findling, “Assessment of Safety and Walkability of Urban Space for Child Pedestrians,” Beterem-Safe Kids Israel, Publication No. 1068, Petach Tikva, 2010.
- Central Bureau of Statistics, “Road Accident Table Generator,” 2013. http://www.cbs.gov.il/reader/transport/accidents.html
- Central Bureau of Statistics, “Profile of Local Authorities in Israel 2007,” 2009. http://www.cbs.gov.il
- Central Bureau of Statistics, “Topics in Transport Statistics, Local Authorities,” 2009. http://www.cbs.gov.il/reader/transport/transport_new.html
- J. Cohen, “Safety Profile of Local Authorities in Israel 2006-2007,” Matat Transportation Planning Center, Jerusalem, 2008.
- Occupational Health and Safety Standards (OHSAS) 18001, “Occupational Health and Safety Management Systems Requirements Standard,” OHSAS Project Group, International Body hosted by British Standards Institution, London, 1999.
- B. G. Tabachnick and L. S. Fidell, “Using Multivariate Statistics,” Pearson/Allyn & Bacon, Boston, 2006.
Appendix A. Data Collected in the Pilot
See definition of basic indicators in Table 1. Summary indicators are marked by “*”, optional indicators by “#”.
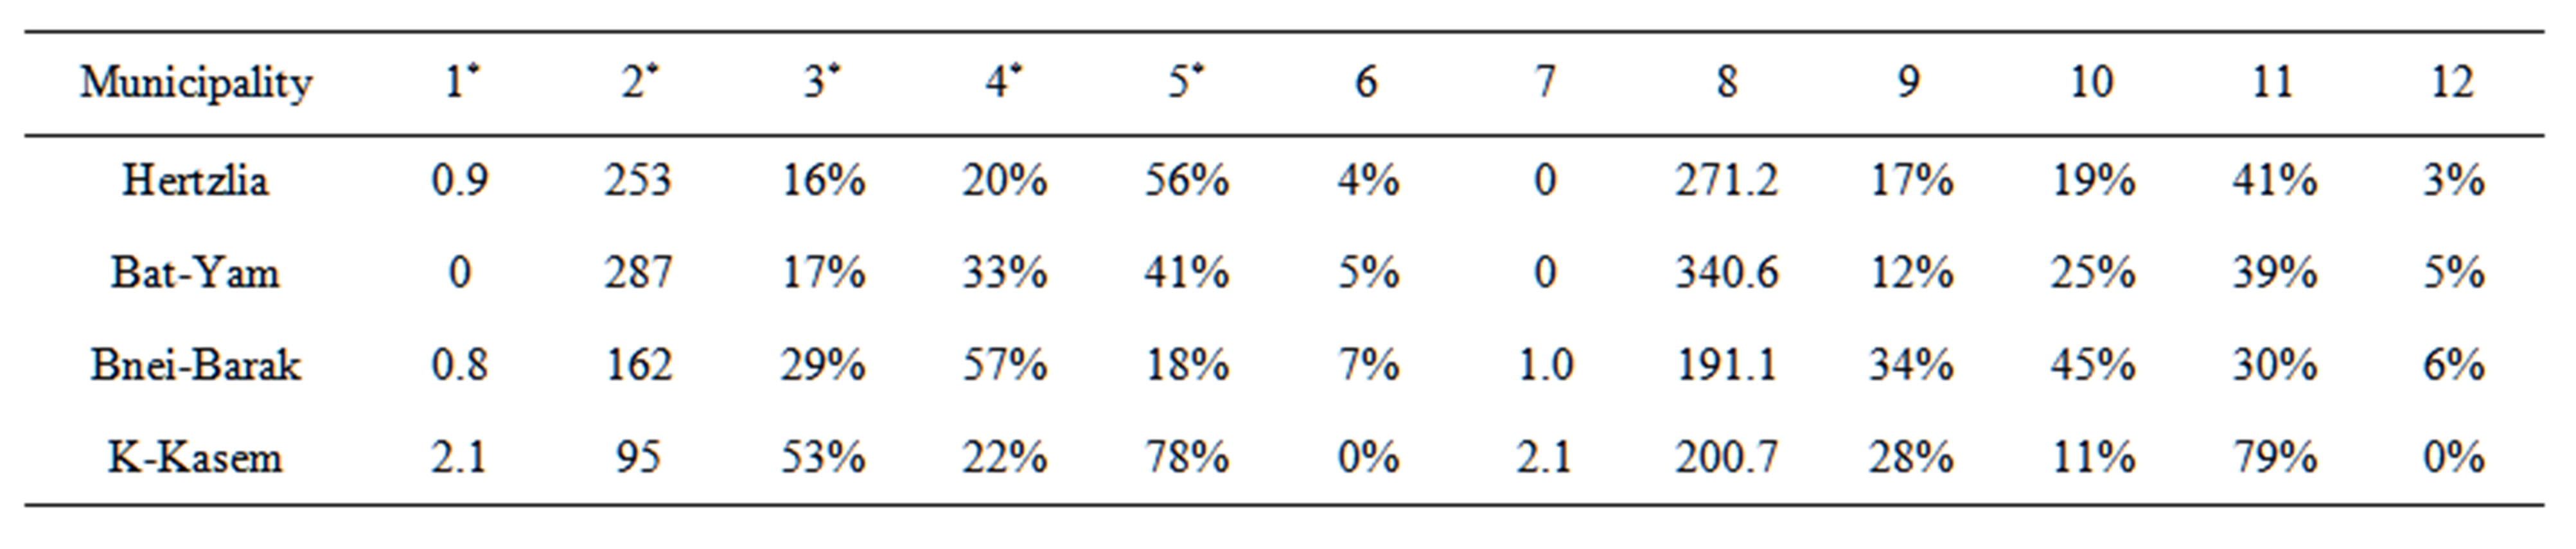
Table A1..Basic indicators estimated for Injury domain.
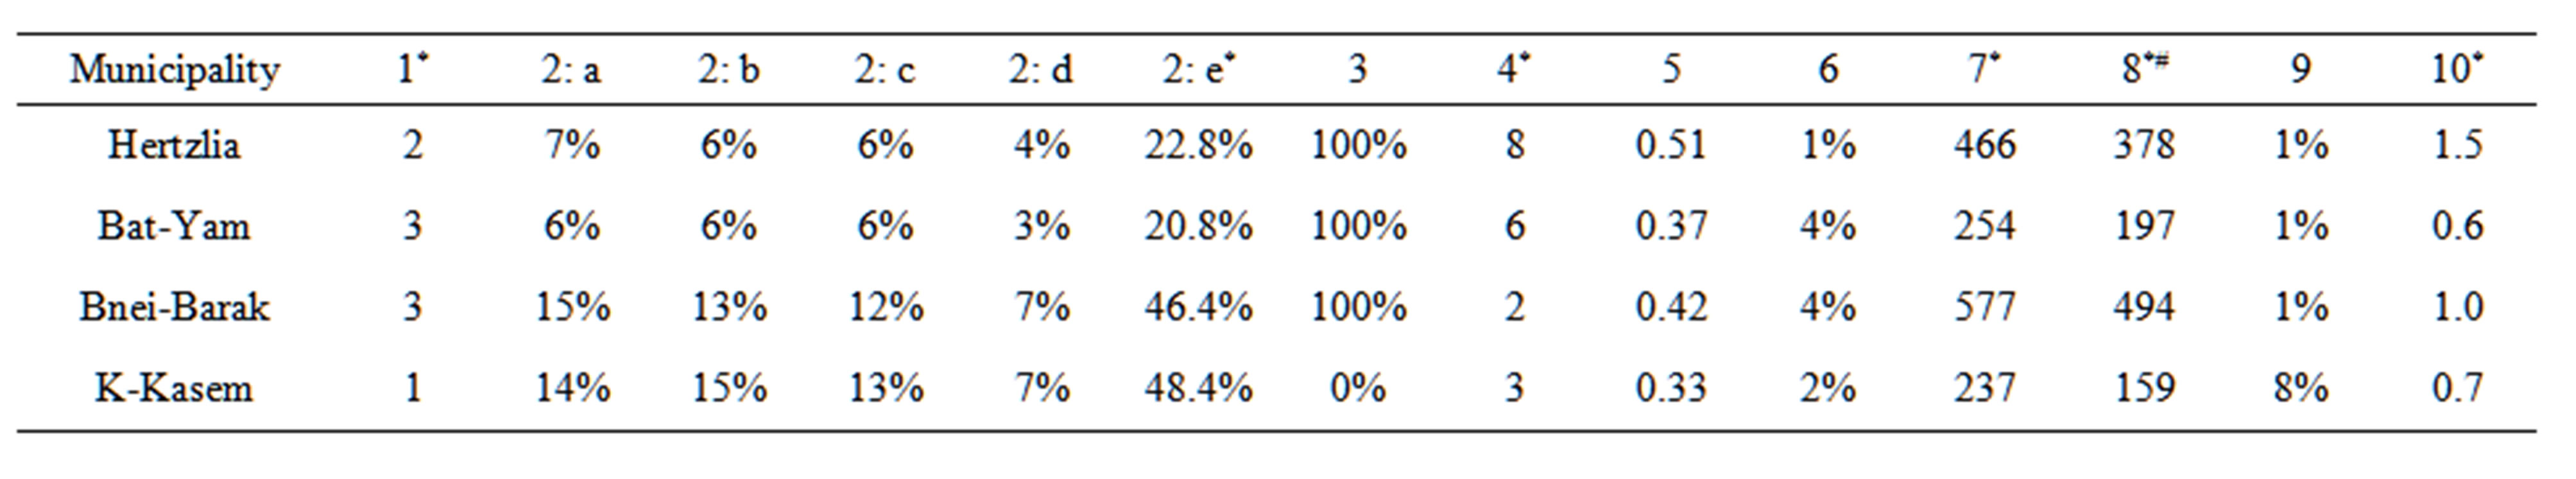
Table A2. . Basic indicators estimated for Background characteristics domain.
Table A3. . Basic indicators estimated for Behaviors domain. (a) Use of safety restraints in cars; (b) Characteristics of bicycle riding; (c) Arrival to school conditions.
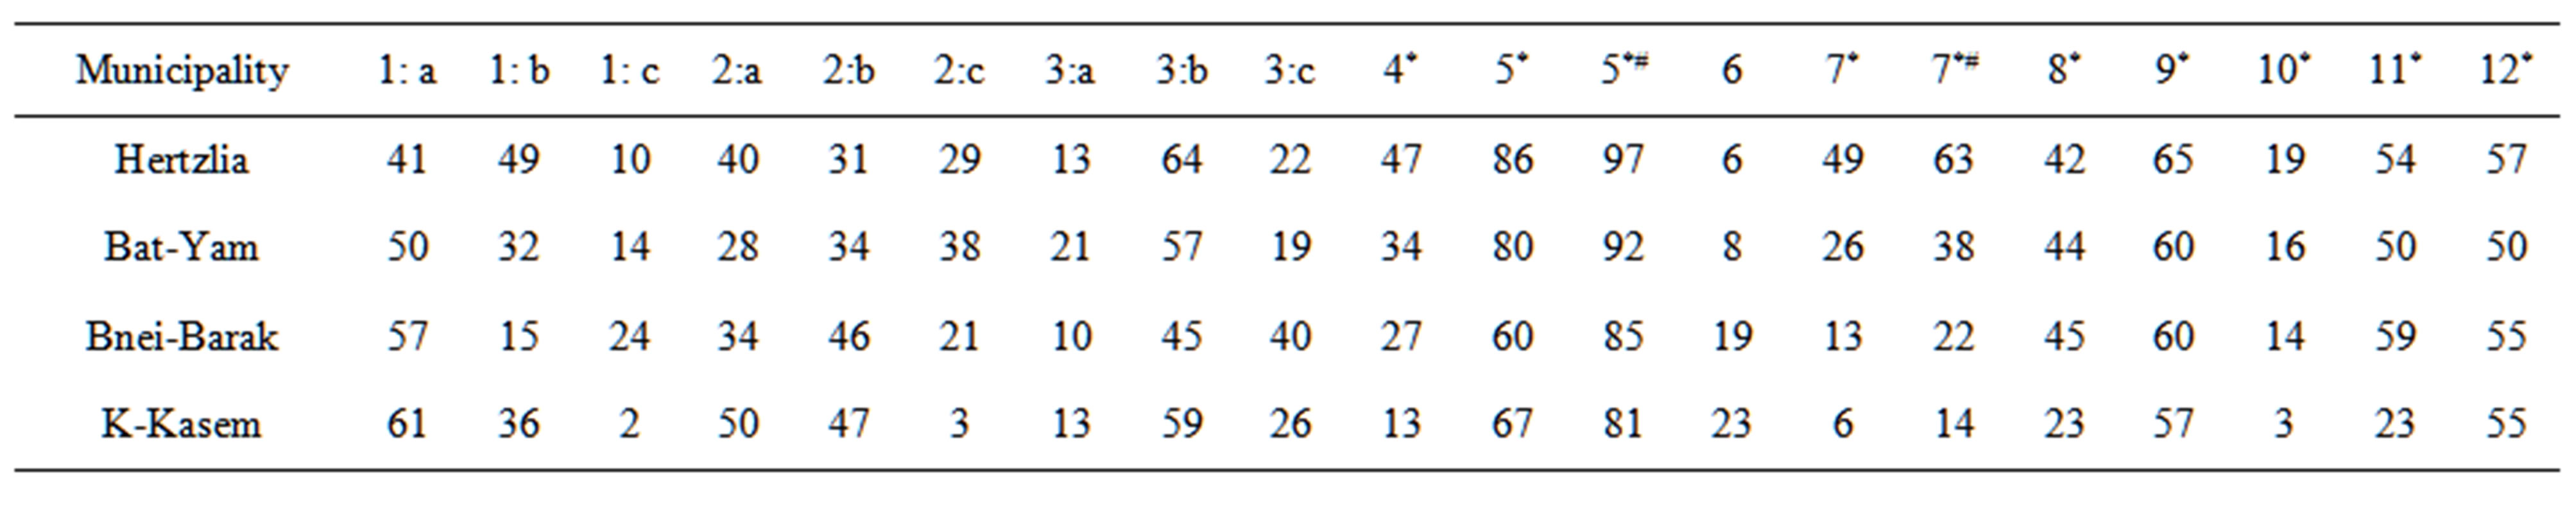
Table A4.. Basic indicators estimated for Attitudes domain (all values in percent).
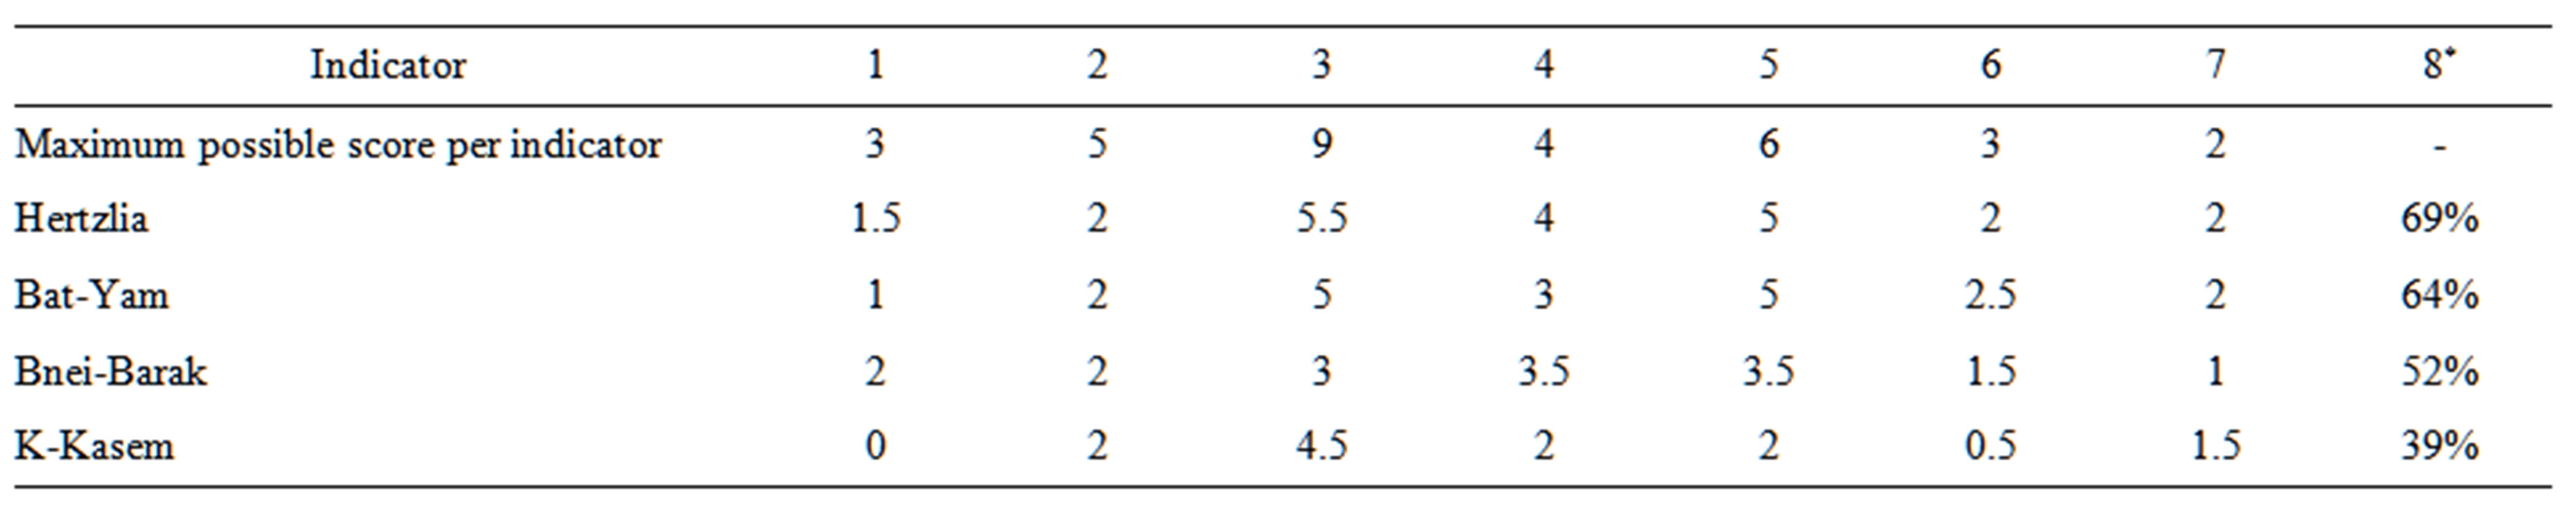
Table A5. . Basic indicators estimated for Policy and management domain.
NOTES
*Corresponding author.
1Population size of a town: small—below 50,000; medium—50,000 - 120,000; large—120,000 - 200,000 inhabitants. The names of the towns are noted throughout the article solely for presentation purposes.