Open Journal of Safety Science and Technology
Vol.2 No.2(2012), Article ID:20269,9 pages DOI:10.4236/ojsst.2012.22007
Evaluating Equivalence of the Safe Performance Index (SPI) to a Traditional Risk Analysis
Department of Energy and Mineral Engineering, The Pennsylvania State University, University Park, USA
Email: *hzk128@psu.edu
Received January 11, 2012; revised February 10, 2012; accepted February 17, 2012
Keywords: Risk Analysis; Risk Index; Mine Safety; Performance Index; Safety Violation; Safety-Related Risk
ABSTRACT
Following up on a recommendation by the Mine Safety Technology and Training Commission relative to the modification of the Australian risk assessment approach for application to U.S. mines, the authors had previously developed the Safe Performance Index (SPI) as a risk-based methodology. It was designed to assess the relative safety-related risk of underground coal mines regarding injuries and citations for violations of regulations. To determine whether it is equivalent to a traditional risk analysis, a Risk Index is developed in this paper using a traditional risk analysis that embraces the frequency and severity of accidents and violations of mine regulations in a final equation. This methodology is used to analyze the relative risk for all underground coal mines for the years 2007-2010, and the results are compared to the results obtained using the SPI. The comparison revealed that the SPI does emulate a traditional approach to risk analysis. A correlation coefficient of –0.89 or more was observed between the results of these two methodologies, and either can be used to assist companies, the Mine Safety and Health Administration (MSHA), or state agencies in targeting mines with high risk for serious injuries and elevated citations for remediation of their injury and/or violation experience. The SPI, however, provides a more understandable approach for mine operators to apply using measures compatible with MSHA’s enforcement tools. The SPI is also a transparent and reproducible approach for mine operators and federal and state enforcement agencies to apply.
1. Introduction
The U.S. underground coal mining industry has made significant progress in safety over the years, but the recent major disasters have set back the progress. Historically, major disasters have led to a major legislative and regulatory reform that is stricter and highly specified regarding compliance. Last decade was no different following the 2006 underground coal mine multiple-fatality events, the U.S. Congress passed the Mine Improvement and New Emergency Response Act [1], and the disaster of 2010 (the worst mining disaster in 40 years) initiated a bill, the Robert C. Byrd Miner Safety and Health Act, which was voted down by the Congress; however, another version is pending further action. These events indicate that the industry has likely been following a reactive approach to managing safety, rather than a proactive approach in managing major-hazard risks.
In 2006, the National Mining Association established an independent, tripartite commission [2] to study the status of safety in underground coal mines and to determine what may be done to elevate the industry to a global leadership position in mine safety. As described in their report [3], the commission “specified 75 recommendations that, if implemented, would set safe performance standards for achieving a culture of prevention at mines, including risk assessment, and noted that mines which could not meet the level of safety requirements specified in the report should not be allowed to mine coal.” The report was “aimed at preventing underground coal mine disasters in the future and targeting the goal of zero fatalities and lost-time accidents.” The commission also recommended that some form of risk assessment needs to be adopted in every mine to mitigate the major-hazard risk and improve the safety performance; however, the Australian risk assessment approach should be modified for application in U.S. mines.
In 2007, the Mine Safety and Health Administration (MSHA) implemented an enforcement risk-targeting tool called Pattern of Violations (POV) to target mines with a poor safety performance, specifically to force improvement of their safety. By 2010, the POV process was called broken because of its failure to place any mine on POV status [4,5], its legal complexities, and its ineffectiveness in targeting the poor-performing mines [6]. On the commissions’ recommendation, the National Institute for Occupational Safety and Health (NIOSH) pursued a project on Major Hazard Risk Assessment (MHRA), a pilot study [7], to demonstrate risk assessment methodologies in the U.S. mining industry. However, it has not largely been adopted by the industry. Some of the possible reasons for industry’s reluctance to adopt a formal risk assessment methodology include: 1) too busy with compliance, 2) complicated or sophisticated methodologies, 3) lack of on-site expertise (particularly at small mines), 4) lack of safety infrastructure to support its use, and 5) learning curve associated with the implementation of formal risk assessment.
Previously, the Safe Performance Index (SPI) was developed as a transparent and reproducible risk-based methodology to assess the relative overall safety performance of a mine [3]. Until late 2010, the POV screening criteria were not transparent and reproducible by the mine operators. The Safe Performance Index (SPI) was offered as an alternative to the POV process in assessing a mine’s overall safety performance, and it could help in overcoming the industry’s reluctance in adopting formal risk-based methodologies [8]. In this paper, a traditional risk-analysis method is developed using MSHA data on accidents and citations for violations of regulations during 2007-2010. The results will be compared to the SPI results to assess how well the SPI emulates a more traditional risk analysis.
2. Literature Review
According to Joy and Griffiths [9], there are many different ways of doing risk analysis, both qualitatively and quantitatively. Generally, experienced people are necessary to make good judgments in a qualitative risk analysis. Unfortunately, in the U.S., 60% of the underground coal mines are small-size mines (less than 50 employees) [8], and they are generally not equipped with on-site safety expertise capable of performing a complex or sophisticated risk analysis. Quantitative risk analysis has the advantage of using historical safety performance data to evaluate the frequency and severity in a more objective way. Historically, small underground coal mines have experienced higher fatality rates than larger mines [10,11], and a similar trend was found in a recent study which “indicates a heavy occurrence of very severe injuries in a number of very small (<20 employees) and small mines” [8]. Mine size is highly correlated with coal seam height in the U.S., and smaller mines tend to operate in significantly thinner coal seams than large mines. Miners are at higher risk of having a nonfatal injury as mining height decreases [12].
Often, fatality and injury rates are used to evaluate the safety performance of mines and their ability to manage risk. However, in the U.S. mining industry, elevated citations for certain violations of regulations (such as those designated as Significant and Substantial (S&S) and withdrawal or imminent danger orders) may reflect failures of mine personnel to manage risks and may result in “poor” mine safety performance. Risk analysis is not mandatory in the U.S. as it is in Australia, where risk analysis is considered as a part of the daily work routine. The South African mining industry “has established a Hazard Identification and Risk Assessment Program (HIRA-2003) to identify and record significant risks” [13].
Quantitative performance measurement has been proven valuable in the fields such as economics, health care management, and education, where policies are driven by indicators such as the unemployment rate, infant mortality, and standardized test scores [14]. The policymakers in the U.S. mining industry have recognized the importance of data and analytically accurate details for decisionmaking. During congressional hearings on mine safety reform (H.R. 5663), the current paper’s co-author presented the SPI as an alternative methodology to the POV process [15].
3. Methodology
In this paper, a risk analysis method is developed and compared with the SPI methodology which was previously developed by the authors [3]. The description of the data, detailed description of the risk analysis method, and a brief description about the SPI methodology is given next. Comparison is made to evaluate the equivalence of the SPI in assessing the risk of accident and citation data of differing severity in a combined measure (the SPI) to a risk analysis approach.
3.1. Data Description
The accident/injury data and citation data for the years 2007 to 2010 were downloaded from the MSHA Open Government Data Sets website [16]. Mines with no production and zero inspection hours were excluded from the analysis. There were 563 underground coal mines in 2007, 583 in 2008, 539 in 2009, and 496 in 2010. The non-finalized or under-contest citations, significant and substantial (S&S)-designated citations, and unwarrantable failure, withdrawal and imminent danger orders [104(b), 104(d), 104(g), and 107(a)] were included in the citation data. Higher risk is associated with more severe accident measures and with more elevated citation measures.
3.2. Risk Analysis
Generally, risk is defined as the product of the probability of occurrence (frequency) of an event and its severity of impact. In this study, the probability of occurrence is the normalized safety measure and severity is determined from the relative level of associated loss. For example, a general citation has low severity, an S&S citation has medium severity, and an order has high severity; a similar scheme is applied to the accident/injury measures. Accordingly, a risk analysis approach is developed by assigning five risk levels (very low, low, medium, high, and very high) to the six normalized safety measures, which are calculated using downloaded calendar-year data on injuries, employee-hours worked, citations, and inspection hours.
The six safety measures are the no days-lost incidence rate (NDL IR, number of no lost-time accident/injuries per 200,000 employee hours), the non-fatal days-lost incidence rate (NFDL IR, number of lost-time injuries per 200,000 employee hours), the severity measure (SM/ 100, number of statutory, restricted, and lost work days per 200,000 employee hours, divided by 100), the number of citations per 100 inspector hours (C/100 IH), the number of significant and substantial citations per 100 inspector hours (SS/100 IH), and the number of withdrawal orders and unwarrantable failures per 100 inspector hours (O/100 IH).
Each measure’s range of values is divided into five equal intervals in ascending order, and risk values of 1 (very low), 2 (low), 3 (medium), 4 (high), and 5 (very high) are assigned accordingly. In the majority of the cases, there will be few extreme values that influence the determination of the ranges of values for a normalized safety measure, and in this case, it was no different. In order to negate the influence of extreme values, the boxplot method, available in the Minitab statistical software
[17], is used to determine the lower quartile, upper quartile, and interquartile range values. In examining the data, the boxplot, a non-parametric statistical method, is used to identify outliers and extreme outliers without making any assumptions about the population distribution. For each normalized safety measure, the interquartile range (IQR: the absolute difference between the upper and lower quartile) is calculated using the values from the boxplot as shown in Figures 1-4. The outliers and extreme outliers are calculated as follows [18]:
IQR = upper quartile (Q3) – lower quartile (Q1) (1)
Outlier > upper quartile (Q3) + 1.5 (IQR) (2)
Extreme Outlier > upper quartile (Q3) + 3.0 (IQR) (3)
In this paper, extreme outliers are identified and excluded from the process of determining the five equal intervals of values for each safety measure. However, the extreme values are included when assigning the risk value, and they were assigned a very high risk value (5). For each mine’s safety measures, based on the interval values for each safety measure, a corresponding risk value is assigned to convert it to a risk measure. The new risk measure has values ranging from 1 (very low risk) to 5 (very high risk). To form the risk index for a mine, the weights 0.05, 0.15, 0.30, 0.05, 0.15, and 0.30 are used as pre-multipliers for RNDL, RNFDL, RSM, RC, RSS, and RO, respectively, which are symbols for the no days lost risk, the non-fatal days-lost risk, the severity measure risk, the citation risk, the S&S-designated citation risk, and the types of orders risk, respectively, and the products are summed. The weighting factors vary according to the severity of the various measures; for example, orders are the most severe citations that can be issued by inspectors, thus they get the highest weighting factor. Note that the
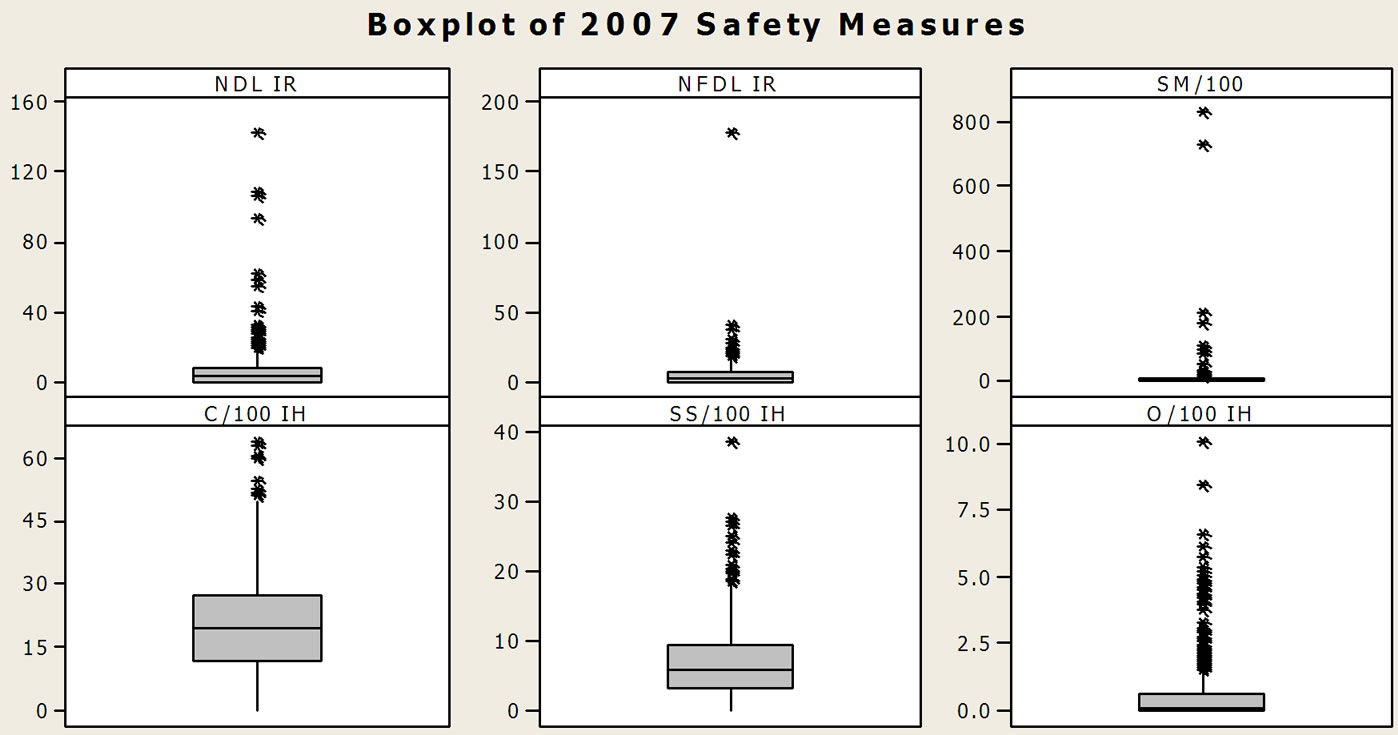
Figure 1. Boxplot of 2007 safety measures.
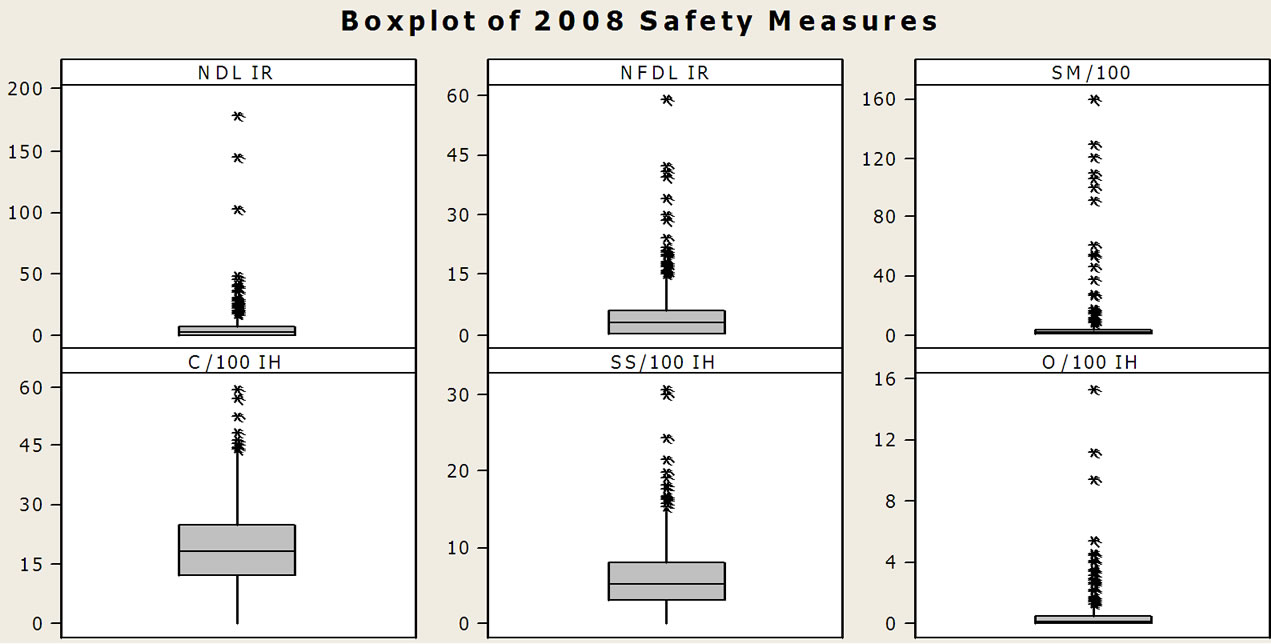
Figure 2. Boxplot of 2008 safety measures.
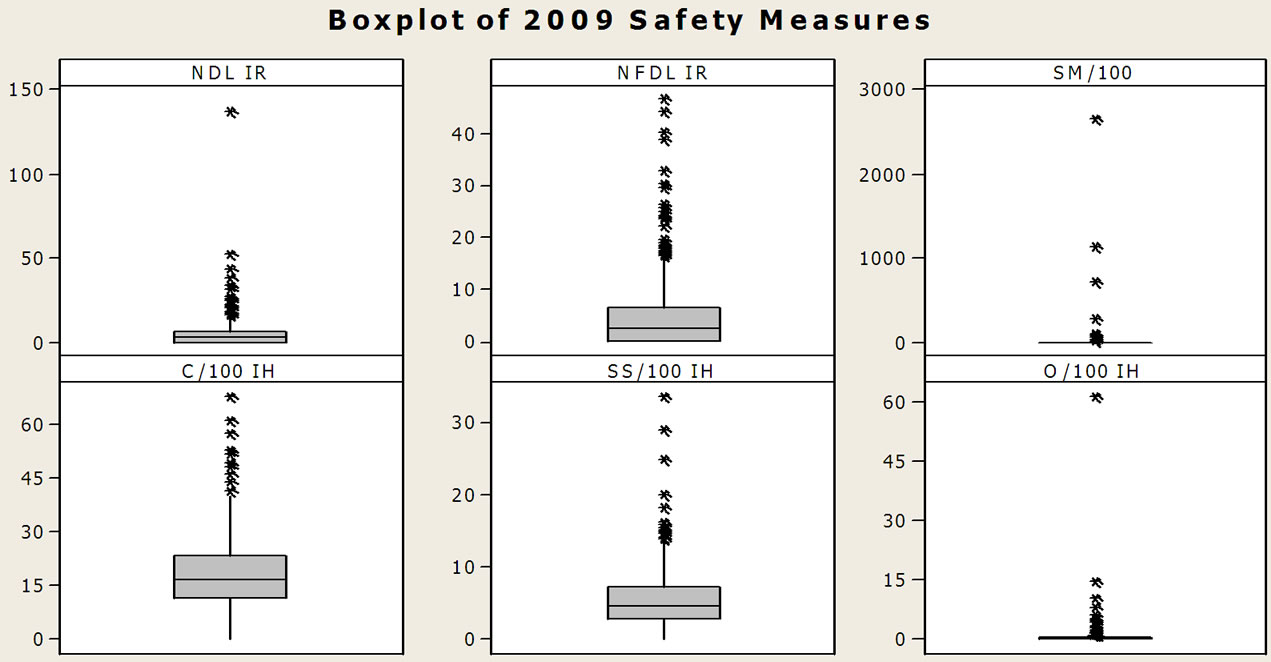
Figure 3. Boxplot of 2009 safety measures.

Figure 4. Boxplot of 2010 safety measures.
sum of the weighting factors equals 1, appropriately, and the sum of weights for the injury experience (three measures) and the citation experience (three measures) are each 0.5. The authors believe that the injury experience and the citation experience should have equal weights for a mine safety performance index to be well-balanced. This method represents a traditional risk-analysis approach using a new risk measure that embraces frequency and severity in the final equation.
3.3. Safe Performance Index (SPI)
The SPI methodology was previously developed by the authors [3] to monitor mine safety performances using the appropriate accident/injury and citation safety measures. An in-depth explanation on criteria for choosing the six safety measures and the corresponding weighting factors to form the SPI is given in [3]. In this paper, the same methodology is used to calculate the SPI of each mine for the years 2007 to 2010 which are then compared to the results of the risk-index analysis. It is noted that the West Virginia Coal Association (WVCA) and Arch Coal Company have given statements at regulatory hearings on the POV process in support of using the SPI. Arch Coal’s Tony Bumbico “noted that MSHA should consider SPI, a holistic measure that more equitably blends injury and enforcement data” [19]. The SPI methodology was also explicitly proposed in the U.S. House of Representatives’ bill H.R. 5788 to target “poor” mine safety performances.
4. Equivalence of the Safe Performance Index Results to the Risk Analysis Results
The SPI results were evaluated to determine how well the SPI methodology emulates a traditional risk analysis approach, as represented by the risk-index methodology. The values of the upper quartile, interquartile range, and extreme outliers for all the six safety measures for the years 2007-2010 are shown in Table 1. The C/100 IH measure did not have any extreme outliers, except in 2009. In 2007, there were 12 extreme outliers in NDL IR, 4 in NFDL IR, 22 in SM/100, 2 in SS/100 IH, and 35 in O/100 IH. The extreme outliers of each risk measure for the years 2008, 2009, and 2010 are shown in Table 1. The constructed risk ranges for each normalized safety measure for the years 2007-2010 are given in Tables 2-5, respectively.
4.1. Risk Index Results
The final risk index values for mines range from one to five. A risk index value of one implies a very low-risk mine, >1 but ≤2 is a low-risk mine, >2 but ≤3 is a medium-risk mine, >3 but ≤4 is a high-risk mine, and >4 is a very high-risk mine. The numbers of very high-risk and high-risk mines for the years 2007-2010, as per the risk-index are shown in Table 6. In 2007, there were 8 mines with very high risk (>4) and 27 mines with high risk (>3), whereas in 2008, there were 4 mines with very high risk (>4) and 28 mines with high risk (>3). In 2009, there were 7 mines with very high risk (>4) and 29 mines with high risk (>3), and in 2010, there were 3 mines with very high risk (>4) and 25 mines with high risk (>3). The average risk index for all the mines was 1.65, 1.67, 1.69, and 1.66 in 2007, 2008, 2009, and 2010, respectively. The average risk index for all mines for the four years was at the low-risk level and 6% of the mines were at the high/very high risk levels.
4.2. Safe Performance Index Results
The final SPIs of the mines range from 100 to 0 (zero). An SPI of 100 implies a very good safety performance mine, an SPI less than 40 implies “below average” or “poor” safety performance, and an SPI of zero indicates the worst safety-performance mines. The average SPI for all mines was 66.66 each year due to the intrinsic design of the methodology, which is a valuable and consistent marker for average performance. As shown in Table 6,
Table 1. Safety measures’ interquartile range, upper quartile, and extreme measures: 2007-2010.
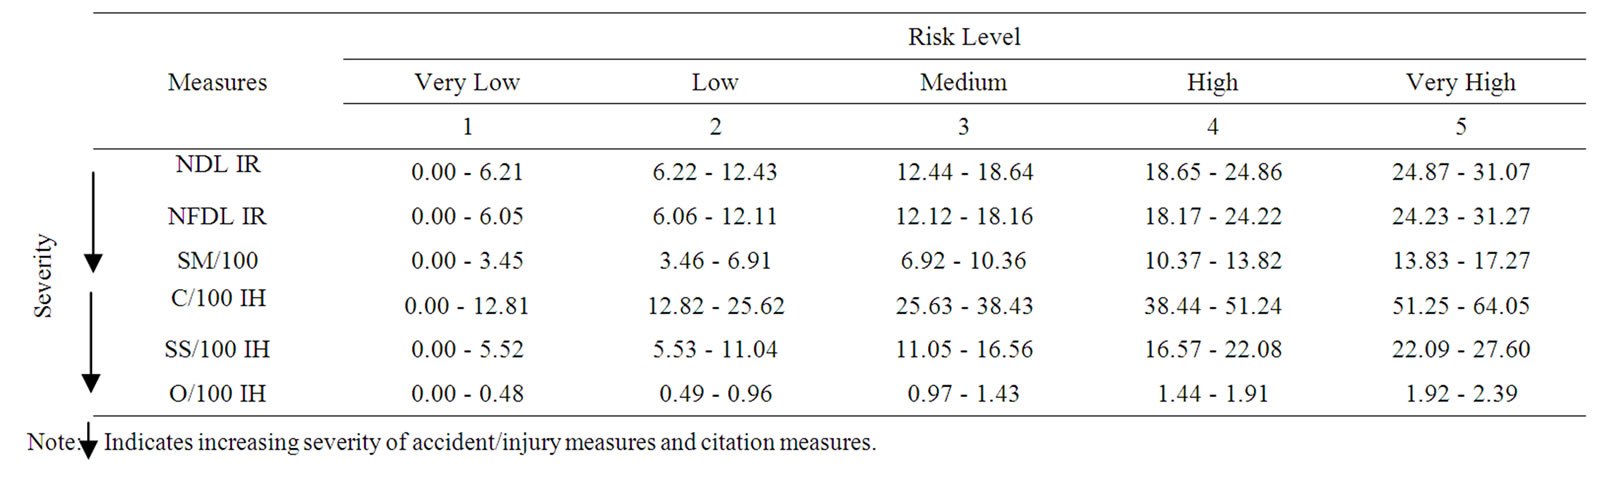
Table 2. Safety measures’ risk level scheme: 2007.
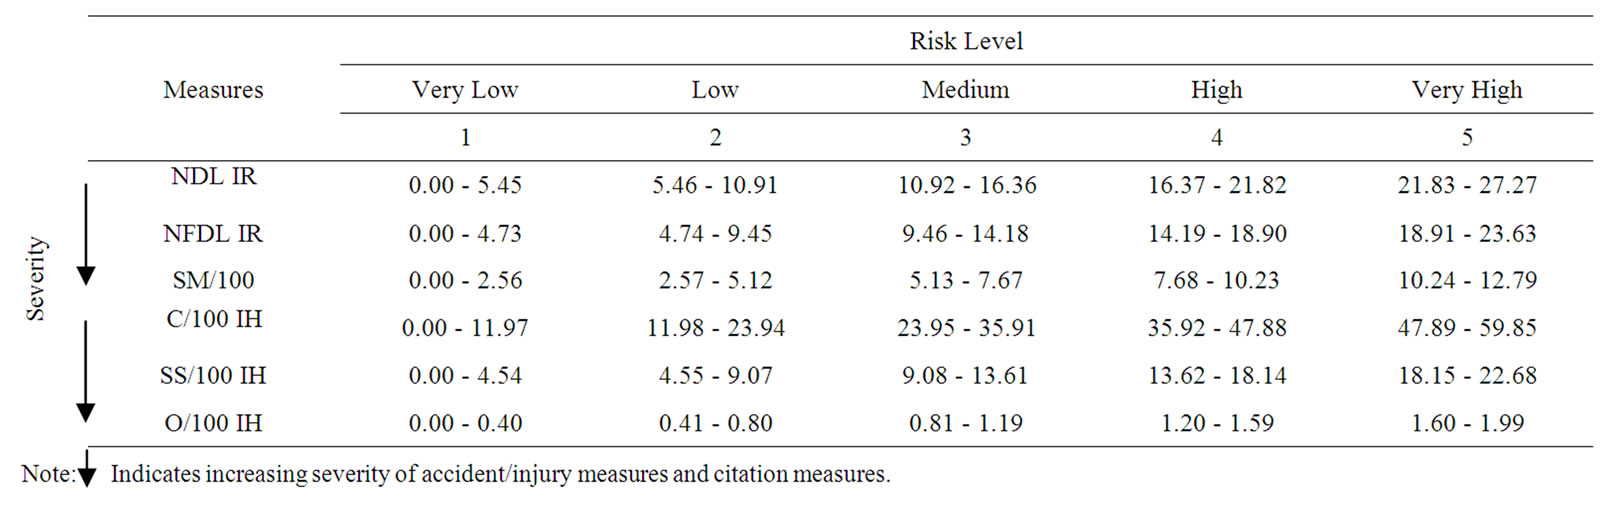
Table 3. Safety measures’ risk level scheme: 2008.

Table 4. Safety measures’ risk level scheme: 2009.
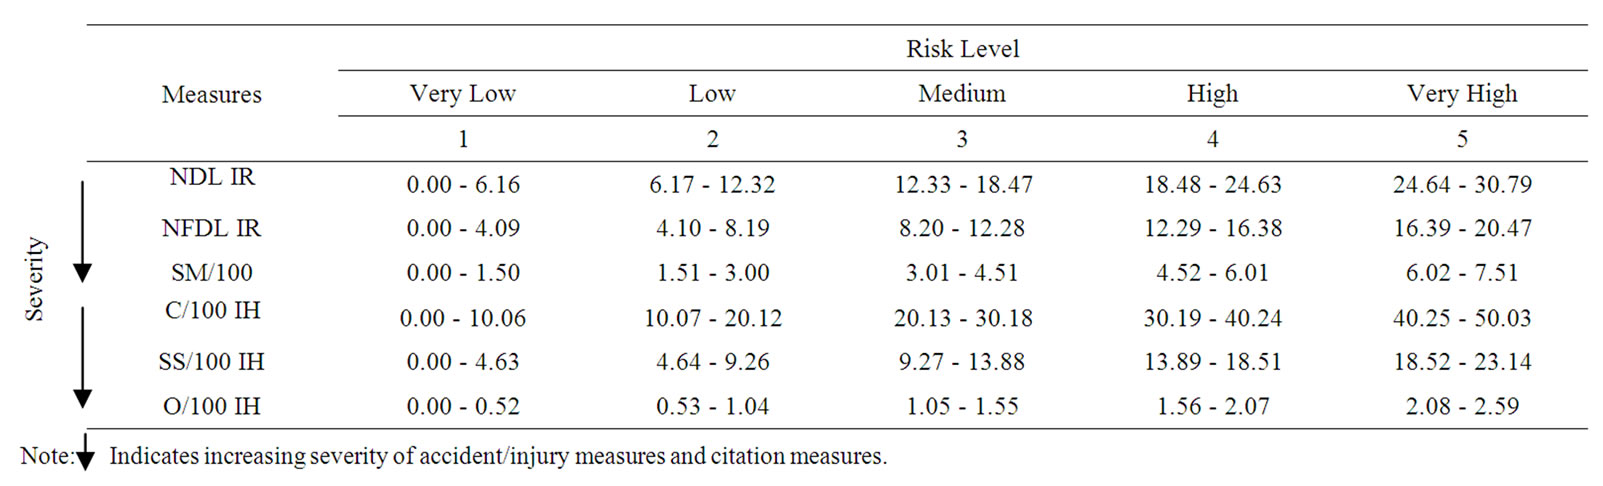
Table 5. Safety measures’ risk level scheme: 2010.

Table 6. Very highand high-risk mines as per risk analysis and SPI: 2007-2010.
there were 30 mines with zero SPI and 59 mines with an SPI less than 40 in 2007. Similarly in 2008, there were 27 mines with zero SPI and 64 mines with an SPI less than 40, whereas in 2009, there were 15 mines with zero SPI and 40 mines with an SPI less than 40. In 2010, there were 24 mines with zero SPI and 52 mines with an SPI less than 40.
4.3. Correlation of the SPI to the Risk Index Results
Based on the analysis of results, in the authors’ opinion the mines with a very high risk level should be targeted for improvement and immediate action should be taken to reduce the risk. Likewise, the mines with zero SPI should be targeted and immediate interventions should be taken to improve the safety performance. Mines with high risk or with an SPI less than 40 should take action to remediate their poor safety performance.
The risk index results and the SPI results were tested for correlation using the Minitab statistical software with a level of significance (α) of 0.05. The risk index and SPI correlations are shown in the Table 7 for the years 2007-2010. The negative correlations of the risk index with the SPI were expected, as a high risk index indicates a high-risk mine, whereas, the SPI was constructed as a positive safe performance indicator. The correlations of the risk index with the SPI were –0.913, –0.922, –0.905, and –0.898 for the years 2007, 2008, 2009, and 2010, respectively. The correlations between the risk index and the SPI for each year were excellent as well as significant (based on the p-value). This indicates that the SPI methodology effectively emulates the risk index developed using the traditional risk approach.
Using the SPI approach does have the advantage over the use of the risk index, because in the risk index approach, the range of values for each risk measure is generally unknown in deciding what intervals to create. Analysis of the data is required to construct an appropriate risk interval for each measure. Also, because of the normalized measures incorporated, the SPI is an understandable approach (no learning curve) for mine operators as well as federal and state enforcement agencies, and it would likely be more compatible with MSHA’s
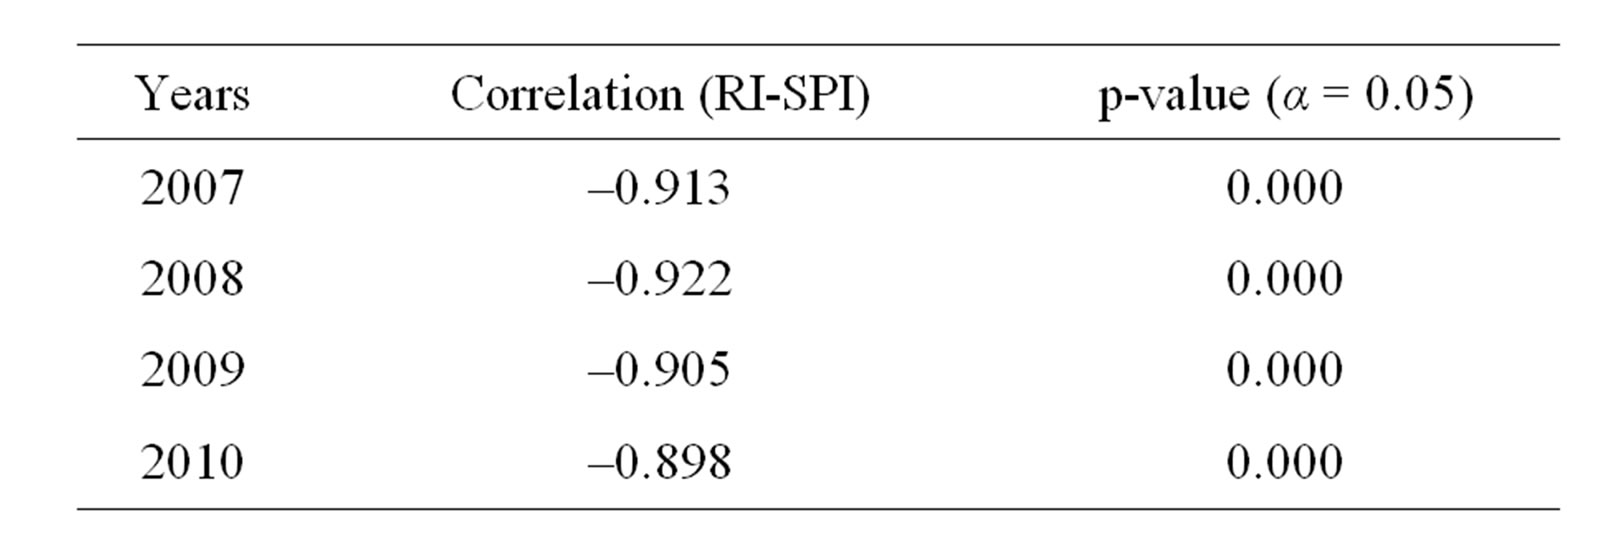
Table 7. Correlation of risk index and SPI results: 2007- 2010.
enforcement tools.
5. Conclusion
In this paper, a traditional risk approach was used to develop a risk index that embraces frequency and severity in the final equation for assessing the safety performances of U.S. underground coal mines based on six prominent normalized safety measures. The risk index ranks the mines’ relative safety performances on a risk scale that ranges from very low risk to very high risk. In order to explore the equivalence of a traditional risk analysis approach with the SPI, the mines’ safety performances were also calculated using the previously developed Safe Performance Index methodology. The risk index and SPI results for each mine for the years 2007- 2010 showed a correlation coefficient of –0.89 or more between the results of these two methodologies. Thus the application of the SPI methodology effectively emulates a traditional risk analysis. Either can be used to assist companies, the U.S. Mine Safety and Health Administration, or state enforcement agencies in targeting mines with high risk for serious injuries and elevated citations for remediation of their injury and/or violation experience. The SPI is, however, a transparent, understandable, and reproducible approach for mine operators and federal and state agencies, with a quick learning curve, and it is likely more compatible with MSHA’s enforcement tools than a formal risk analysis.
REFERENCES
- “Mine Improvement and New Emergency Response Act,” U.S. Congress, 16 May 2006, pp. 109-123.
- Mine Safety Technology and Training Commission, “Improving Mine Safety Technology and Training: Establishing U.S. Global Leadership,” 2006.
- H. Kinilakodi and R. L. Grayson, “A Methodology for Assessing Underground Coal Mines for High Safety-Related Risk,” Journal of Safety Science, Vol. 49, No. 6, 2011, pp. 906-911. doi:10.1016/j.ssci.2011.02.007
- MSHA, “MSHA Takes Steps to Overhaul ‘Broken’ Pattern of Violations Program New Criteria Developed for Screening Mines,” 2010.
- MSHA, “MSHA Announces Tougher POV Provisions, Responds to OIG audit,” 2010.
- M. P. Smith, “Statement of Solicitor of Labor before the U.S. Senate Appropriations Committee, Subcommittee on Labor, Health and Human Services, Education and Related Agencies,” 2010.
- A. Iannacchione, F. Varley and T. Brady, “The Application of Major Hazard Risk Assessment (MHRA) to Eliminate Multiple Fatality Occurrences in the U.S. Minerals Industry,” 2008. http://www.cdc.gov/niosh/mining/pubs/pdfs/2009-104.pdf
- H. Kinilakodi and R. L. Grayson, “Assessing Small Underground Coal Mines for High Safety-Related Risk,” Mining Engineering, Vol. 63, No. 10, 2011, pp. 73-77.
- J. Joy and D. Griffiths, “National Industry Safety and Health Risk Assessment Guideline,” University of Queensland, Brisbane, 2007.
- National Academy of Sciences, “Fatalities in Small Underground Coal Mines” Bureau of Mines Open File Report, 1983.
- R. Peters and B. Fotta, “A Review of Recent Data Concerning Accidents Caused by Falls of Unsupported Roof,” Holmes Safety Bulletin, 1994.
- R. H. Peters, B. Fotta and L. G. Mallett, “The Influence of Seam Height on Lost-Time Injury and Fatality Rates at Small Underground Bituminous Coal Mines,” Applied Occupational and Environmental Hygiene, Vol. 16, No. 11, 2001, pp. 1028-1034.
- Z. A. Md-Nor, V. Kecojevic, D. Komljenovic and W. Groves, “Risk Assessment for Loaderand Dozer-Related Fatal Incidents in the U.S. Mining,” International Journal of Injury Control and Safety Promotion, Vol. 15, No. 2, 2008, pp. 65-75. doi:10.1080/17457300801977261
- J. Emerson, D. C. Esty, M. Jaiteh, C. Kim, M. A. Levy, V. Mara, A. de Sherbinin and T. Srebotnjak, “2010 Environmental Performance Index,” 2010. http://epi.yale.edu/file_columns/0000/0157/epi2010_report.pdf
- R. L. Grayson, “Invited testimony on Mine Safety and Health Reform Legislation (H.R. 5663) before the U.S. House of Representatives,” Committee on Education and Labor, Washington DC, 2010.
- MSHA, “MSHA’s Open Government Initiative,” 2010. http://www.msha.gov/OpenGovernmentData/OGIMSHA.asp
- www.minitab.com
- R. L. Ott and M. Longnecker, “An Introduction to Statistical Methods and Data Analysis,” 5th edition, Thomas Learning Inc., Duxbury, 2001.
- J. Sharpe, “POV Proposal Has It All: Insult, Injury and Injustice,” the E-Newsletter on Safety and Health in Mining, Vol. 7, No. 4, 2011, pp. 9-10.
NOTES
*Corresponding author.