Open Journal of Stomatology
Vol.3 No.1(2013), Article ID:28727,7 pages DOI:10.4236/ojst.2013.31002
The change of HERS cell number and gene expression profile by occlusion during root development in rat molars
![]()
Division of Periodontology, Department of Oral Biological Science, Niigata University Graduate School of Medical and Dental Sciences, Niigata, Japan
Email: nakasone@dent.niigata-u.ac.jp
Received 26 January 2013; revised 18 February 2013; accepted 27 February 2013
Keywords: Occlusion; Root Development; Hertwig’s Epithelial Root Sheath (HERS); Microarray; Rats
ABSTRACT
Occlusion is commenced by contact of a tooth with an opposing tooth and is the mechanical force working against the periodontal ligament (PDL). Our recent study indicated that occlusion regulated tooth-root elongation occurs during root development in rat molars. Using a non-occlusal model established to directly examine the effects of the absence of occlusion in developing first molars of upper jaw, histological analysis was performed to count the number of HERS cells, with Microarray used to analyse gene expression profiles. HERS cell numbers in normal molars decreased significantly more than those in experimental molars. In microarray data, a total of 59 genes showed significant differences (fold change > 2.0). Expressions of 55 genes in the experimental molars, which included PLAP-1/asporin and periostin, were significantly decreased than those in normal molars. These data indicate that occlusion during root development leads to a decrease in the number of HERS cells, and that the aforementioned genes may play an essential role in normal root formation.
1. INTRODUCTION
Occlusion is commenced through contact between a tooth and its counterpart tooth and works as the mechanical force against the periodontal ligament (PDL). Our recent study, which employed a non-occlusal model during root development, demonstrated that occlusion is directly related to tooth-root elongation by regulating cell proliferation of the apical region [1]. This means that as an environmental factor, occlusion is important to root formation. Studies focused on root length are very few, but Nakatomi et al. has reported that mesenchymal dysplasia mice carrying an abnormal C-terminus of Patched 1 protein have shorter roots [2]. Furthermore, the molar roots of sulf1/sulf2 double knockout mice were short [3]. Thus, factors regulating root length have remained unknown.
Hertwig’s epithelial root sheath (HERS) is a bi-layered cell sheath formed by the inner enamel epithelium (IEE) and outer enamel epithelium (OEE) following crown formation [4]. During root development, HERS continues to migrate in the apical area outlining the shape of root and plays a main role in root formation. The expression of several genes, sonic hedgehog (SHH), Nuclear factor I (NFI)-C, periostin, Msx1, and Msx2 play a pivotal role during the root formation [2,5,6]. Recent studies have laid to rest unknown HERS facts, including the number of HERS cells, their length and subsequent fates [7-9]. Thus, factors regulating root size such as length and width are yet to be studied in great detail.
Microarray analysis has recently been applied to analyse comprehensive gene expression profiles on various human diseases, such as cancer [10], rheumatologic disorders [11], Alzheimer’s disease [12], oral squamous cell carcinoma [13], periodontitis [14] and gingival overgrowth [15]. Furthermore, microarray technology has been utilised in tooth development in mice [16-18]. Through this method, we can compare gene expression profiles at different stages of tooth development, which has resulted in an array of genes being identified as regulators for tooth development. However, no reports examine the change of gene expression by occlusal loading during root development.
In this study, we hypothesise that root elongation, where occlusion is excluded during root development, is related to HERS cell numbers and gene expression around the tooth-root. Our objectives were to analyse the change in the number of HERS cell and the gene expression profiles in developing roots of a non-occlusal model.
2. MATERIALS AND METHODS
All experiments were performed following the guidelines of the Niigata University Intramural Animal Use and Care Committee.
2.1. Tissue Preparation and Subjects for Histochemistry
Three Wistar rats (postnatal 15, 18, 21, 25 and 30 days old) were used for histological procedures. Experimental procedure involving the extraction of counterpart teeth has been explained previously [1]. In brief, the right lower first and second molars at P15 were extracted under anaesthesia by an intraperitoneal injection of chloral hydrate (400 mg/kg), with the extracted socket left untreated. The control contained normal molars that had not undergone an extraction. Materials were collected from the two groups at intervals of 10 (postnatal 25 days old: P25) and 15 (postnatal 30 days old: P30) days after extraction. Rats were perfused with physiological saline transcardially followed with 4% paraformaldehyde in a 0.1 M phosphate buffer (pH 7.4) under deep anaesthesia by an intraperitoneal injection of chloral hydratre (400 mg/kg). The maxillae was removed en bloc and immersed in the same fixative for 24 hours.
2.2. Histological Analysis
Following decalcification of the tissues with 10% EDTA at 4˚C, the specimens were embedded in paraffin. Cut at a thickness of 5 μm, sagittal sections were mounted on MAS-coated glass slides (Matsunami Glass Ind, Osaka, Japan). Deparaffined sections were stained with H-E. Using these sections, the numbers of inner and outer cells of HERS were calculated.
2.3. Subjects for Microarray Analysis
For microarray analysis, four upper first molar of experimental and control groups at P30 were used. All samples were extracted under anaesthesia by an intraperitoneal injection of chloral hydratre (400 mg/kg). Immediately after sampling, molars were dipped into 1000 μl of an RNA stabilization regent, RNA later® (QIAGEN, Valentia, CA). The roots and pulp floors were resected with a razor blade and only root portions except for the coronal portion were homogenised by another razor blade. These samples were then stored at −20˚C until use. An RNeassy mini kit (QIAGEN, Valentia, CA) was used to isolate total RNA from the tissue samples according to the manufacturer’s instructions. The quality and quantity of total RNA samples were determined prior to the microarray experiments by the Agilent 2100 Bioanalyzer (Agilent Technologies, Palo Alto, CA). A quantity of more than 25 ng, and density of 13.5 ng/μl were used for further microarray analysis. Doublestranded cDNA was synthesised from high-quality RNA obtained by using the Low Input Quick Amp labeling kit/lit (Agilent technologies, Palo Alto, CA). 100 ng of total RNA derived from each pool was converted to double-stranded cDNA using the reverse transcriptase and a poly dT primer containing a T7 promoter (Agilent technologies, Palo Alto, CA). Cyamine dye-labelled cRNA was synthesised from cDNA and T7 RNA polymerase (Agilent technologies, Palo Alto, CA). Following fragmentation, 480 ng of cRNA was hybridised for 17 h at 65˚C on Sureprint G3 Rat Gene Expression 8 × 60 k (Agilent technologies). GeneChips were washed and stained in Gene Expression Hybridization kit (Agilent technologies). Fluorescence intensities for each chip were captured on a Scanner G2539A (Agilent technologies), and the data obtained were processed and analysed with the perfect match/mismatch algorithm using Scan Control, version A.8.5.1 (Agilent technologies).
2.4. Microarray Data Analysis
Microarray data were initially processed using Feature Extraction (Agilent technologies). The MAS5.0 algorithm was used to normalise the signals to correct for non-specific hybridization, taking into account perfect match and mismatch probe pairs. Comparison analyses were then used to differentiate the real changes in gene expression levels between normal and experimental groups. Genes that revealed at least two-fold changes in their gene expression were selected, and the obtained data were filtered to ensure both statistical and biological significance. 59 Genes which indicated a statistically significant gap compared with the control group were selected by a paired t-test (P < 0.05).
2.5. Statistics
The numbers of inner and outer cells in HERS were noted as the means ± standard deviation (SD). The significant difference was evaluated using Student’s t-test.
3. RESULTS
3.1. HERS of Normal Molars at 15 and 21 Days Old
HERS of normal molars at 15 and 21 days old At P15, tooth cusps have not emerged into the oral cavity, but tooth root formation has commenced (Figure 1(a)). In this stage, cells from the inner enamel epithelium (IEE) and outer enamel epithelium (OEE) extended in an apical direction (Figure 1(b)). IEE cells were square, and OEE cells were rectangular. At P21, the tooth has already erupted into the oral cavity. In this stage, root development continues to an apical direction (Figures 1(c) and (d)). During a period of 6 days, cells from IEE and OEE decreased (Table 1).
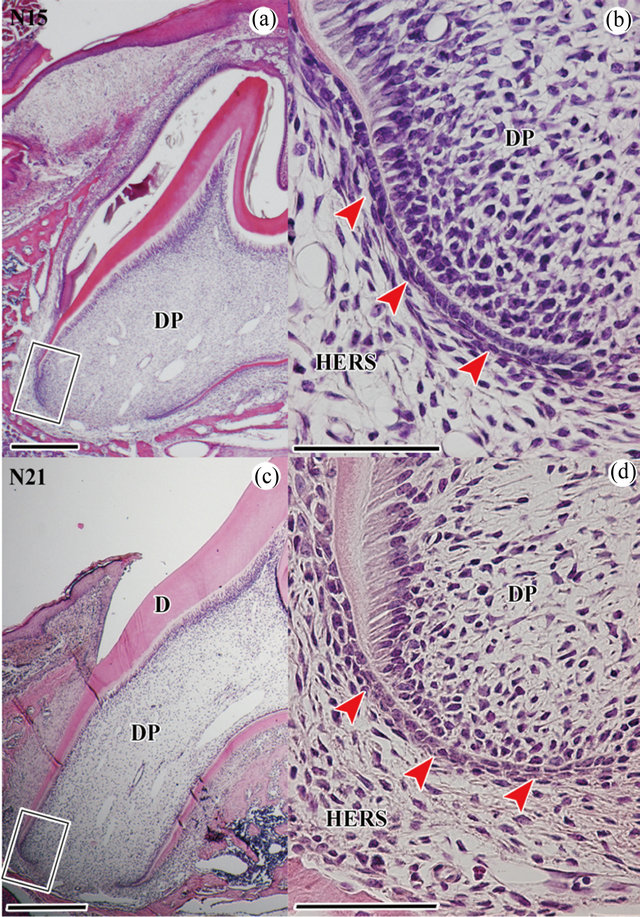
Figure 1. Histological analysis of normal molars during root development at P15 and P21. The mesial side is to the left in (a)-(d). (a) H-E stain in right first molar of the upper jaw at P15. It begins to erupt, but not emerge into the oral cavity; (b) Higher magnification of the boxed area in (a). HERS (red arrow heads) is observed in the apical region; (c) H-E stain in right first molar of the upper jaw at P21. It has already erupted in the oral cavity; (d) Higher magnification of the boxed area in (c). Scale bars = 500 μm (a), (c), 50 μm (b), (d). N15: normal molar at P15, N21: normal molar at P21, DP: dental pulp, D: dentin, HERS: Hertwig’s epithelial root sheath.
Table 1. Comparison of number of HERS cells between normal and experimental groups.
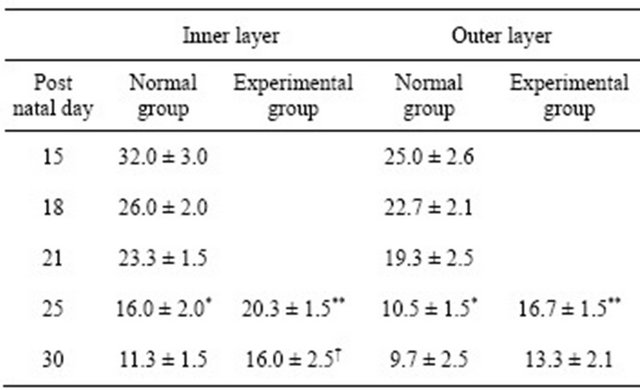
Data are given as mean ± SD. n = 3. *P < 0.05 versus P21, **P < 0.05 versus normal group at P25. †P < 0.05 versus experimental group at P30.; Student’s t-test.
3.2. HERS of Normal and Experimental Molars at 25 and 30 Days Old
At P25, normal tooth roots continued to be formed. The morphological difference of both normal and experimental root dentin were not observed (Figures 2(a) and (c)). However, Sharpey’s fibers displayed an irregular orientation in experimental molar as in our previous report (Figure 2(c)). We compared the number of HERS cells among P21, normal group at P25 (N25) and experimental group at P25 (E25). The number of HERS cells in the normal group was significantly fewer than in the experimental group (Table 1). The cell number from inner and outer enamel epithelium in the normal group at P25 was significantly lower than that at P21, in contrast to an insignificant difference noted in the experimental
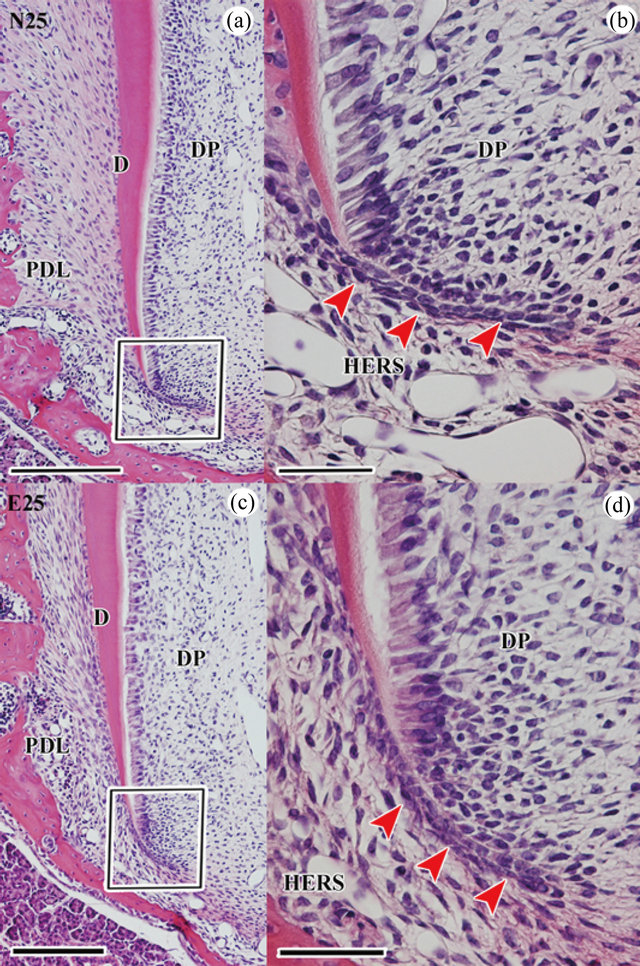
Figure 2. Histological analysis of normal and experimental molars during root development at P25. The mesial side is to the left in (a)-(d). (a) H-E stain in normal first molar of upper jaw at P25. (b) Higher magnification of the boxed area in (a). (c) H-E stain in experimental first molar of upper jaw at P25. (d) Higher magnification of the boxed area in (c). Scale bars = 200 μm (a), (c), 50 μm (b), (d). N25: normal molar at P25, E25: experimental molar at P25, DP: dental pulp, PDL: periodontal ligament, D: dentin, HERS: Hertwig’s epithelial root sheath.
group (Table 1).
At P30, normal teeth completed root elongation, but incomplete apical root dentin formation was observed as in a previous report [19]. Sharpey’s fiber findings were identical to those at P25 in our previous report (Figures 3(a) and (c)) [1]. The number of HERS cells in normal groups (N30) was significantly fewer than that in experimental groups (E30) (Table 1), as was observed at P25.
3.3. Microarray Analysis
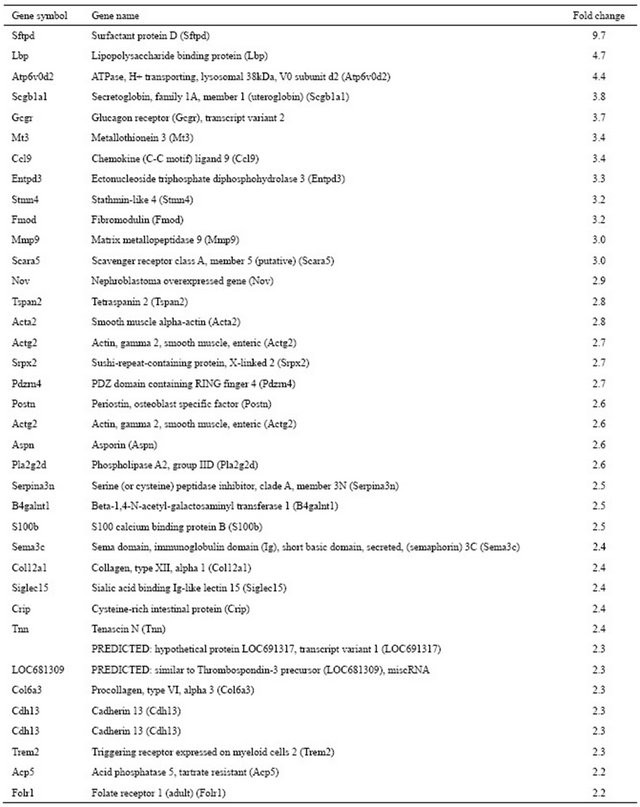
Microarray was used to compare multiple gene expression profiles between normal and non-occlusal groups during root development. Genes that expressed more than two folds were selected. 59 genes displayed either upor down-regulation between normal and experimental molars. A total of 55 genes, including the especially prominent surfactant protein D, were highly expressed in the normal group. Table 2 shows the genes that were down-regulated in the experimental group compared to
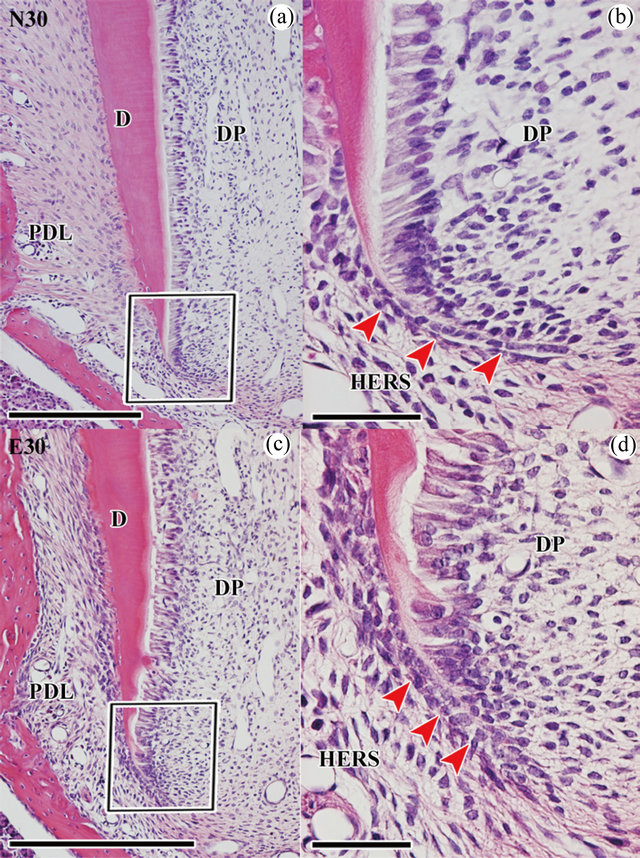
Figure 3. Histological analysis of normal and experimental molars during root development at P30. The mesial side is to the left in (a)-(d). (a) H-E stain in normal first molar of upper jaw at P30. (b) Higher magnification of the boxed area in (a). (c) H-E stain in experimental first molar of upper jaw at P30. (d) Higher magnification of the boxed area in (c). Scale bars = 200 μm (a), (c), 50 μm (b), (d). N30: normal molar at P30, E30: experimental molar at P30, DP: dental pulp, PDL: periodontal ligament, D: dentin, HERS: Hertwig’s epithelial root sheath.
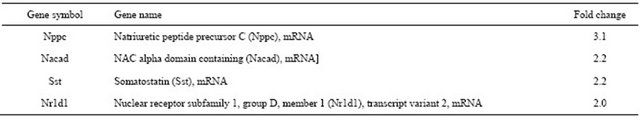
the normal group at P30. In the same way, we also found that the expression of four genes was significantly increased in the experimental group (Table 3). Highlyexpressed genes in the experimental group included natriuretic peptide precursor C (Nppc), NAC alpha domain containing (Nacad), somatostatin (Sst), and nuclear receptor subfamily 1, group D, member 1 (Nr1d1), and transcript variant 2. The number of down-regulated genes exceeded that of up-regulated genes in this study.
4. DISCUSSION
The number of HERS cells during normal root development was quantified by Yamamoto et al. [7]. During root formation, the number of HERS cells in normal molars reduces gradually as shown in his previous report in mice [7]. This study demonstrates that the number of HERS cells in normal molars decreases significantly further than that in experimental molars during root development, whereas the number of HERS cells reduces gradually before contacting molar in the upper jaw and counterpart molar in the lower jaw. These data suggest that the number of HERS cells is regulated by not only genetic factors but also environmental factors, including occlusion. Our previous report demonstrated that the number of proliferating cells in the apical region of normal molars decreased greater than in that of non-occlusal molars. This is identical to the data of HERS cell numbers in this study, suggesting that exclusion of occlusal loading during root formation leads to root elongation by regulating HERS cells and proliferating cells around the apical root [1].
Interestingly, the number of HERS cells in normal molar immediately after the onset of occlusion decreased significantly further than that in experimental molar. Once again, this data mimics our previously obtained results for the decrease of proliferating cells and root elongation [1]. Furthermore, little is reported about the effects of the early stage of occlusion during root development. Thus, occlusion during root development is important to HERS even if it is just after occlusal loading starts.
Down-regulated genes were greater in number than up-regulated genes in microarray analysis. It is conceivable that this experiment could be a non-occlusal model established by extracting counterpart teeth. When physical force is excluded, periodontal tissue causes various morphological changes including progressive atrophy of Sharpey’s fibers, loss of their regular arrangement, narrowing of periodontal space, and the loss of alveolar bone [20-22]. Hence, gene results obtained in this study are identical to the morphological findings in previous reports.
This study unearthed two genes that may have important roles in HERS development. Periostin, which is
Table 2. List of down-regulated genes showing greater than two-fold change in experimental tooth compared to normal tooth at P30.

Continued
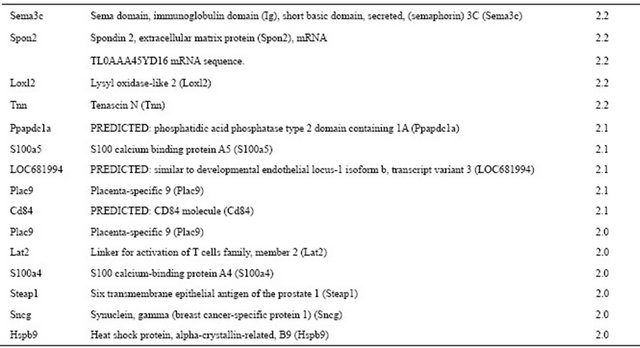
Table 3. List of up-regulated genes showing greater than two-fold change in experimental tooth compared to normal tooth at P30.
expressed in periosteum and the PDL, is vital to tooth development [6,23]. Recently, Rios et al. reported that mechanical loading maintains sufficient periostin expression to ensure the integrity of the periodontium in response to occlusal loading in normal mice [24]. Thus, periostin and occlusal loading have a close relationship. The second, asporin, is known as periodontal ligamentassociated protein-1 (PLAP-1). It is initially expressed in the dental follicle during tooth germ development, and the specific expression of PLAP-1/asporin becomes progressively evident in adult PDL tissue [25]. Whereas the relationship between PLAP-1/asporin and occlusal loading has not been reported, PLAP-1/asporin may be affected by occlusal loading because both periostin and PLAP-1/asporin are expressed specifically in the PDL. There are no reports which suggest that these genes express in HERS during root formation, but their expression in the PDL may be related to HERS.
In conclusion, our results suggest that normal occlusion is involved in the regulation of HERS cell numbers and gene expression during root development.
5. ACKNOWLEDGEMENTS
This work was supported by Grant-in-Aid for Young Scientists (B) (23792468 to N. Nakasone) from the Ministry of Education, Culture, Sports, Science and Technology (MEXT).
![]()
![]()
REFERENCES
- Nakasone, N. and Yoshie, H. (2011) Occlusion regulates tooth-root elongation during root development in rat molars. European Journal of Oral Sciences, 119, 418-426. doi:10.1111/j.1600-0722.2011.00856.x
- Nakatomi, M., Morita, I., Eto, K., et al. (2006) Sonic Hedgehog signaling is important in tooth root development. Journal of Dental Research, 85, 427-431. doi:10.1177/154405910608500506
- Hayano, S., Kurosaka, H., Yanagita, T., et al. (2012) Roles of Heparan Sulfate Sulfation in Dentinogenesis. Journal of Biological Chemistry, 15, 12217-12229. doi:10.1074/jbc.M111.332924
- Luan, X., Ito, Y. and Diekwisch, T.G. (2006) Evolution and development of Hertwig’s epithelial root sheath. Developmental Dynamics, 235, 1167-1180. doi:10.1002/dvdy.20674
- Steele-Perkins, G., Butz, K.G., Lyons, G.E., et al. (2003) Essential role for NFI-C/CTF transcription-replication factor in tooth root development. Molecular and Cellular Biology, 23, 1075-1084. doi:10.1128/MCB.23.3.1075-1084.2003
- Rios, H., Koushik, S.V., Wang, H., et al. (2005) Periostin null mice exhibit dwarfism, incisor enamel defects, and an early-onset periodontal disease-like phenotype. Molecular and Cellular Biology, 25, 11131-11144. doi:10.1128/MCB.25.24.11131-11144.2005
- Yamamoto, H., Cho, S.W., Kim, E.J., et al. (2004) Developmental properties of the Hertwig’s epithelial root sheath in mice. Journal of Dental Research, 83, 688-692. doi:10.1177/154405910408300906
- Tummers, M., Yamashiro, T. and Thesleff, I. (2007) Modulation of epithelial cell fate of root in vitro. Journal of Dental Research, 86, 1063-1067. doi:10.1177/154405910708601108
- Huang, X., Bringas, J.R.P., Slavkin, H.C., et al. (2009) Fate of HERS during tooth root development. Developmental Biology, 334, 22-30. doi:10.1016/j.ydbio.2009.06.034
- Todd, R. and Wong, D.T. (2002) DNA hybridization arrays for gene expression analysis of human oral cancer. Journal of Dental Research, 81, 89-97. doi:10.1177/154405910208100202
- Thornton, S., Sowders, D., Aronow, B., et al. (2002) DNA microarray analysis reveals novel gene expression profiles in collagen-induced arthritis. Clinical Immunology, 105, 155-168. doi:10.1006/clim.2002.5227
- Colangelo, V., Schurr, J., Ball, M.J., et al. (2002) Gene expression profiling of 12633 genes in Alzheimer hippocampal CA1: Transcription and neurotrophic factor downregulation and up-regulation of apoptotic and proinflammatory signaling. Journal of Neuroscience Research, 70, 462-473. doi:10.1002/jnr.10351
- Cláudia, M.C.C., Silvia, L., Ines, N.N., et al. (2011) Caspaseexpression in oral Squamous cell carcinoma. Head and Neck, 33, 1191-1198. doi:10.1002/hed.21602
- Abe, D., Kubota, T., Morozumi, T., et al. (2011) Altered gene expression in leukocyte transendothelial migration and cell communication pathways in periodontitis-affected gingival tissues. Journal of Periodontal Reseach, 46, 345-353. doi:10.1111/j.1600-0765.2011.01349.x
- Shimizu, T., Kubota, T., Nakasone, N., et al. (2011) Microarray and quantitative RT-PCR analyses in calciumchannel blockers induced gingival overgrowth tissues of periodontitis patients. Archives of Oral Biology, 56, 277- 284. doi:10.1016/j.archoralbio.2010.10.002
- Sasaki, H., Muramatsu, T., Kwon, H.J., et al. (2010) Down-regulated genes in mouse dental papillae and pulp. Journal of Dental Research, 89, 679-683. doi:10.1177/0022034510366844
- Kim, K.M., Lim, J., Choi, Y.A., et al. (2012) Gene expression profiling of oral epithelium during tooth development. Archives of Oral Biology, 57, 1100-1107. doi:10.1016/j.archoralbio.2012.02.019
- Landin, M.A., Shabestari, M., Babaie, E., et al. (2012) Gene expression profiling during murine tooth development. Frontiers in Genetics, 31, 1-12.
- Kaneko, H., Hashimoto, S., Enokiyo, Y., et al. (1999) Cell proliferation and death of Hertwig’s epithelial root sheath in the rat. Cell and Tissue Research, 298, 95-103. doi:10.1007/s004419900061
- Levy, G.G. and Mailland, M.L. (1982) Histologic study of the effects of occlusal hypofunction following antagonist tooth extraction in the rat. Journal of Periodontology, 51, 393-399. doi:10.1902/jop.1980.51.7.393
- Cohn, S.A. (1965) Disuse atrophy of the periodontium in mice. Archives of Oral Biology, 10, 909-919. doi:10.1016/0003-9969(65)90084-1
- Cohn, S.A. (1966) Disuse atrophy of the periodontium in mice following partial loss of function. Archives of Oral Biology, 11, 95-105. doi:10.1016/0003-9969(66)90120-8
- Horiuchi, K., Amizuka, N., Takeshita, S., et al. (1999) Identification and Characterization of a novel protein, periostin, with restricted expression to periosteum and periodontal ligament and increased expression by transforming growth factor β. Journal of Bone and Mineral Research, 14, 1239-1249. doi:10.1359/jbmr.1999.14.7.1239
- Rios, H.F., Ma, D., Xie, Y., et al. (2008) Periostin is essential for the integrity and function of the periodontal ligament during occlusal loading in mice. Journal of Periodontology, 79, 1480-1490. doi:10.1902/jop.2008.070624
- Yamada, S., Tomoeda, M., Ozawa, Y., et al. (2007) PLAP-1/Asporin, a novel negative regulator of periodontal ligament mineralization. Journal of Biological Chemistry, 282, 23070-23080. doi:10.1074/jbc.M611181200