Open Journal of Immunology
Vol.2 No.2(2012), Article ID:20126,7 pages DOI:10.4236/oji.2012.22008
CD38 expression on CD8+ cells—Its influence on development of tuberculosis in HIV positive individuals
![]()
1Immunology and Molecular Biology Division, LEPRA India-Blue Peter Public Health & Research Centre, Hyderabad, India;
*Corresponding Author: vijayavalluri@gmail.com
2Department of Genetics, Osmania University, Hyderabad, India
Received 14 February 2012; revised 20 March 2012; accepted 5 April 2012
Keywords: HIV-TB; CD38; CD8; CD4; Viral Load
ABSTRACT
CD38 expression on CD8+ cells seems to correlate well with HIV viral-loads, while the expression levels are thought to be low in patients with tuberculosis. This study aimed at determining the levels of CD38 expression in HIV+ individuals who develop tuberculosis. Expression levels of CD8 and CD38 were analysed in peripheral blood collected from HIV (73), TB (32), HIV-TB (31) and healthy controls (20). The percentage of CD8+/CD38+ cells significantly increased during the first few years of seropositivity and decreased during 5 - 6 years. A decline in the expression of CD38, especially on CD8+ cells in a HIV+ individual within first 2 years of seropositivity, may be indicative of susceptibility to tuberculosis. This observation was reiterated when two patients developed TB during follow-up. CD38 on CD8 cells could perhaps be useful as an early biomarker for tuberculosis in HIV-positive individuals.
1. INTRODUCTION
Right from the stage of infection with HIV, most of the individuals exhibit perturbation of T cells and their subsets, leading to their exacerbation in the absolute number with time. These immune cell turbulences along with variation in their function lead to progressive immunodeficiency [1] resulting in an increased risk of opportunistic infections, such as tuberculosis. HIV infection is wellrecognised with highly variable disease progression rates between individuals and are categorised as rapid, intermediate and long-term non-progressors [2]. Lympho proliferative response to HIV-specific antigen is well established in long-term non-progressors than those with more rapid progression [2].
It is well-known that CD4+ cells decline during infection with HIV and the numbers reduce further with disease progression [3]. Reduction in the number of peripheral CD4+ T cells in patients with active tuberculosis also and restoration to normal counts after successful chemotherapy has been reported earlier [4]. The influence of CD8+ cells on progression of HIV disease is a concern, as cytotoxic T lymphocytes (CTLs) are responsible for specific cellular immune response [2]. Evidences of HIV infection in humans and nonhuman primate models indicate the role of CD8+ T cells in controlling or limiting HIV-1 replication [5]. Studies revealed that HIV-1 specific CD8+ cells are associated with nonprogressive HIV-1 infection [6].
It is more or less accepted now that CD38 expression on the T cell subsets, specifically on CD8+ cells could be a useful tool to evaluate the state of cellular activation in HIV infection and also to predict the progression of the disease [3,7]. Rodrigues et al. reported that expression of CD38 on CD8 cells was high in active pulmonary tuberculosis [4]. On the other hand, Viegas et al. [8] reported that absence of CD38 rendered mice more susceptible to mycobacterial infection. HIV infection is known to aggravate susceptibility to tuberculosis by several folds. However, it is not clear how the CD8+/CD38+ expression levels vary in HIV-TB co-infection and whether it could be useful to predict susceptibility to tuberculosis in individuals with HIV infection. This study aimed at investigating variation in CD8+/CD38+ expression levels in individuals positive to HIV at different time frames and its role in early diagnosis of TB co-infection.
2. MATERIALS AND METHODOLOGY
In this study subjects attending clinics of LEPRA India and Mahavir Hospital were included and categorised as: 1) HIV+ group (73) (HIV): HIV-1 infected individuals tested at ICTC (integrated counselling and testing center) who were asymptomatic, treatment-naive and had no history of tuberculosis; the subjects were further divided as per the time-lag after being diagnosed as seropositive upto 10 years; 2) Active tuberculosis group (32) (TB): HIV-1 seronegative patients with recently diagnosed active pulmonary or extra-pulmonary tuberculosis, based on clinical picture, sputum-positivity and radiological involvement suggestive of pulmonary tuberculosis and FNAC or biopsy from the infected sites in case of extrapulmonary TB; 3) HIV-TB co-infected group (31) (HT): Confirmed with HIV-1 and active tuberculosis disease; 4) Healthy control group (20) (CTRL): Asymptomatic volunteers HIV-seronegative with no history of TB.
The study was approved by the Institutional Ethical Committee and written informed consent was obtained from all the participants.
2.1. Flow Cytometric Assay
The peripheral blood cells were stained using a three colour panel of the fluorescence tagged monoclonal antibodies for: CD8 PerCP, CD4 FITC and CD38 APC (BD Biosciences, San Jose, CA). Briefly, 100 μL of EDTAtreated blood was incubated at room temperature with a combination of monoclonal antibodies for 15 minutes in the dark, and then treated with haemolysis buffer of 1X dilution for further 15 minutes. Cells were washed and resuspended in sheath fluid for cytometric analysis.
Acquisition was performed at maximum events of 25000 and analyzed on a FACS Calibur flow cytometer using CellQuest software (BDIS). The subpopulation was analyzed as a function of the percentage of cells expressing CD4 and CD8 on the lymphocytes. The percentage surface expression of the CD38 molecule on CD8 T-lymphocytes was determined after establishing the quadrants in unstained samples.
2.2. Follow-Up Study
A longitudinal study was carried out by following up 13 HIV positive patients for maximum 2 years from the time of first sample collection to observe variation in CD8+/38+ expression with respect to time interval.
2.3. Stimulation Assay
Peripheral blood mononuclear cells (PBMCs) were isolated from the patient and cultured according to the protocol published previously [9]. Ag85A (r32KDa) antigen was used at 10 μg/mL concentration to stimulate the cells in culture.
2.4. IFN-γ Assay
The cytokine levels were measured in plasma and culture supernatants by sandwich ELISA using commercial kit (eBioscience Inc., San Diego, CA, USA). To each well, 100 μL of capture antibody (1X) diluted in coating buffer was added and incubated overnight at 4˚C. After 5 washes, the wells were blocked with 200 μL/well of 1X Assay Diluent and incubated for 1 hour at room temperature (RT). An additional 5 washes were followed by the addition of 100 μL/well of sample and standards, and then incubated for 2 hours at RT. After another 5 washes, 100 μL/well of detection antibody diluted in 1X Assay Diluent was added, incubated for 1 hour at RT and washed 5 times. After addition of 100 μL/well of AvidinHRP diluted in 1X Assay Diluent and incubation for 30 minutes at RT and 7 washes, the wells were incubated with the substrate (100 μL/well) for 15 minutes at RT. Stop solution (50 μL/well) was added and absorbance was measured at 450 nm and subtracted with the absorbance values at 540 nm. The concentrations were calculated using MPM software version 6.1.
2.5. Viral Load Assay
Thirty two samples from HIV+ patients were outsourced to VIMTA Labs and Tapadia Diagnostic Centre (Hyderabad) for the Quantitative/Viral Load assay using Real Time PCR method with a lower detection limit of 70 copies/mL.
2.6. Statistical Analysis
Statistical analysis was performed using Graph Pad Prism version 5.00. One way ANOVA with Tukey’s multiple comparisons, were used in the analysis. p < 0.05 was considered as level of significance.
3. RESULTS
3.1. Percentage CD8+ Expression
CD8 expression was significantly high in HIV-TB and HIV groups when compared with control and TB groups. Whereas, TB group had similar expression to that of control (Figure 1).
3.2. Percentage CD8+/38+ Expression
3.2.1. In Different Study Groups
Expression of %CD8+/38+ was highly significant in HIV-TB group (p < 0.05) when compared with control, HIV and TB groups. HIV group expressed high %CD8+/ 38+ (p < 0.05) when compared with control and TB, whereas, Control and TB groups had similar expression (Figure 2(a)). The viral load was found to be directly proportional to CD38 expression (data not shown).
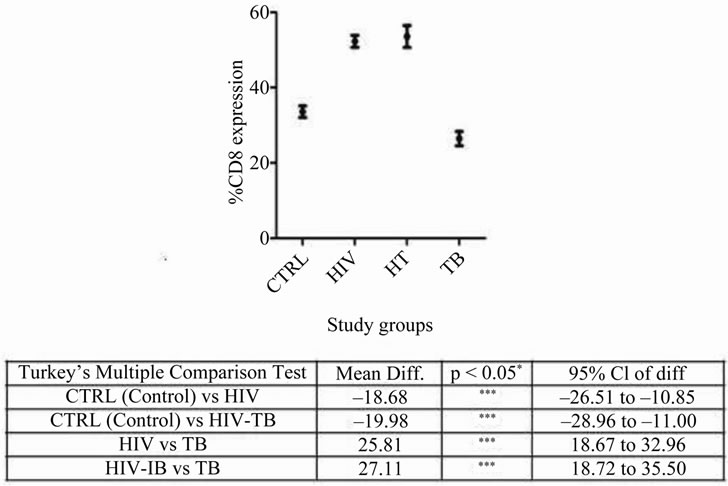
Figure 1. Percentage CD8 expression in different study groups: Mean ± SEM of CD8 expression in CTRL, HIV, HT and TB study groups is shown. Significant was calculated using tukey’s multiple comparison test between different combinations are noted in the table below: *p < 0.05, **p < 0.001 and ***p < 0.0001 with mean difference and 95% class intervals.
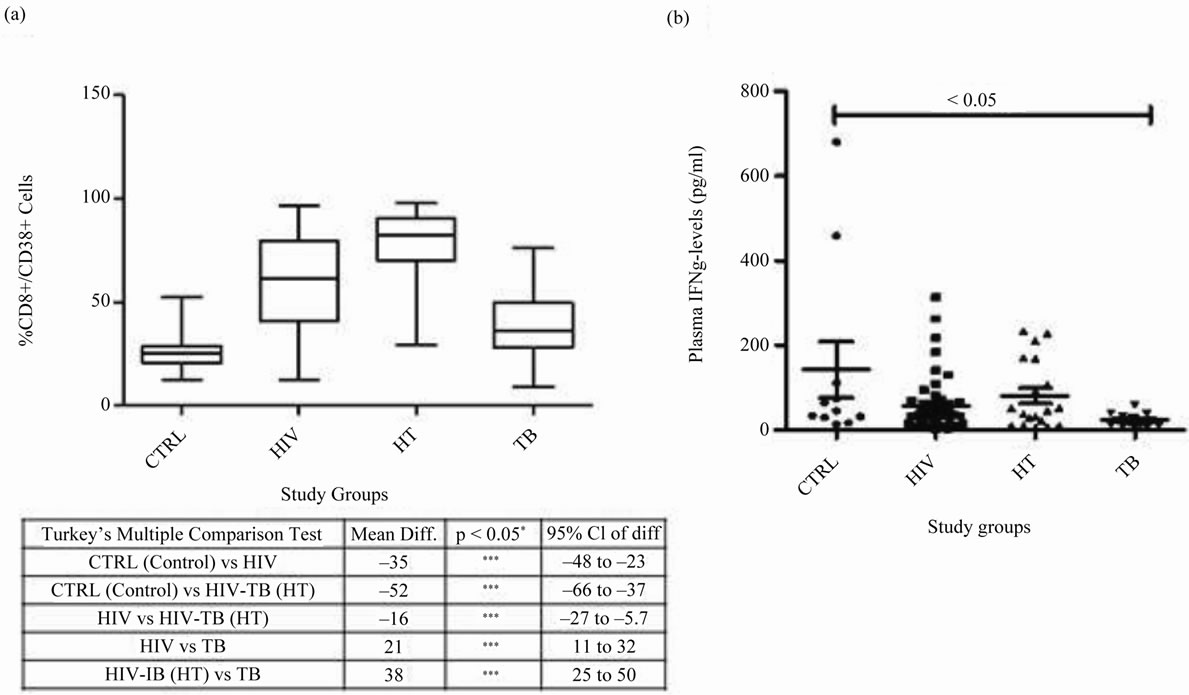
Figure 2. CD8+/38+ expression and IFN-γ levels in different study groups: (a) CD8+/38+ expression: Box plots representing % CD8+/38+ expression in CTRL, HIV, HT and TB study groups is shown. Significant was calculated using tukey’s multiple comparison test between different combinations are noted in the table below: *p < 0.05, **p < 0.001 and ***p < 0.0001 with mean difference and 95% class intervals. (b) IFN-γ levels in plasma: Scatter gram representing the plasma IFN-γ levels in CTRL, HIV, HT and TB individual. Tukey boxes and whisker plots are shown. p-value < 0.05 is considered significant.
3.2.2. In HIV+ Group at Different Time Frames after Diagnosis of HIV
The % CD8+/38+ was significantly low in HIV+ individuals 5 - 6 years after diagnosis when compared to those with time-lag 1 - 2 years. Whereas, the expression levels remained almost similar at remaining time frames after diagnosis of HIV (Figure 3(a)).
3.3. Expression of IFN-γ
3.3.1. In Different Study Groups
IFN-γ expression was almost similar in HIV-TB, HIV and had no significant association when compared with control or TB groups. TB group expressed significantly low levels of IFN-γ in plasma when compared with controls (p < 0.05). No significant co-relation was found between the plasma IFN-γ levels and CD8+/38+ expression (Figure 2(b)).
3.3.2. In HIV+ Group at Different Time Frames after Diagnosis of HIV
IFN-γ levels were almost similar in HIV+ group during all time frames after diagnosis of HIV (Figure 3(b)).
3.4. Follow-Up
Out of 13 HIV positive patients who were followed-up, 2 of them had >30% decline in CD8+/CD38+ % within a short span i.e., 1 - 2 years after diagnosis. At this point, they were diagnosed with TB. On the other hand, the variations seen in the non-progressors were minimal (Figure 4).
4. DISCUSSION
CD38 expression on CD8+ cells was high in patients with HIV-TB and HIV infection in this study. There are several reports on the increase in the number of CD4+ and CD8+ cells positive to CD38 during infection with HIV. HIV drives cell-activation and proliferation [10]. Since CD38 expression is antigen-driven, virally produced proteins could be the cause for the high expression, as also the host cytokines [11]. On the other hand, there is a gradual decrease of CD38 expression on CD8+
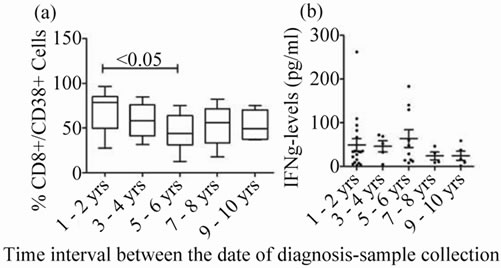
Figure 3. CD8+/38+ expression and IFN-γ levels at different time frames after HIV diagnosis: (a) CD8+/ 38+ expression: Box plots representing % CD8+/38+ expression in at different time frames after HIV diagnosis is shown. (b) IFN-γ levels in plasma: Scatter gram representing the plasma IFN-γ levels at different time frames after HIV diagnosis. p-value < 0.05 is considered significant.
T-cells associated with undetectable viremia after ART [12].
Majority of the CD8+ cells expressed CD38 in HIV+ individuals in this study. As the disease advances, increase in CD38 expression on CD8+ cells (89%) was also reported by Rodrigues et al. [3]. In case of intermediate progression as a consequence of chronic cell activation resulting in apoptosis causing cell-death may lead to decrease in the CD38 expression. The decline in CD38 expression a few years (i.e., 5 - 6 years) later, observed in this study could be probably attributed to this phenomenon. It is thought that CD8+CD38+ proportions lose their prognostic significance over time at 5 years follow up [2].
Langford et al. reported that low frequencies of HIV specific CD8+ T-cells are associated with poor survival outcomes for both ART-naïve and experienced patients providing evidence for the significant role of CTL response [2]. Rodrigues et al. [3] reported a decrease in CD8+ cells in TB patients, while they were not altered in HIV+ patients. Biancotto et al. [13] reported that apoptosis leads to cell death of T-cells and dendritic cells, resulting in impairment in both innate and adaptive immune responses. Hence, lack of CD8+ cell proliferation or decrease in CTL cells may also be responsible for decrease in CD8+/38+ expression in HIV+ individuals at the time of TB diagnosis, an observation made in our study. On other hand co-infected patients have decreased proliferative responses to M. tb antigens with a reduced production of IFN-γ, compared to patients with TB and no HIV [3,14]. Viegas et al., [8] reported that absence of CD38 rendered mice more susceptible to mycobacterial infection probably due to the ineffective Th1 differentiation and polarization. In addition, absence of CD38 seems to compromise the maintenance of the granulomatous barrier, leading to dissemination and unrestrained growth of mycobacteria. Thus, CD38 may be involved in development of protective immune responses against mycobacteria [8].
The CD8+/38+ levels in two patients who enrolled in the study soon after testing positive to HIV, were lower (>30% decrease) when they presented with rapid progression of HIV and developed TB coinfection. As reported earlier TH1 cytokines such as interferon-γ promote strong cellular responses and early HIV viremic control [2]. Decline in the IFN-γ levels (data not shown) in this study during the follow up, indicated down regulation of the CMI in the patients probably leading to manifestation of tuberculosis within two years of HIV diagnosis. After infection with tuberculosis, the expression of CD38 in a HIV+ individual is enhanced. The expression levels in this study in HIV+ patients were presumably lower than that observed in the co-infected patients. Viegas et al., [8] reported decreased IFN-γ pro-
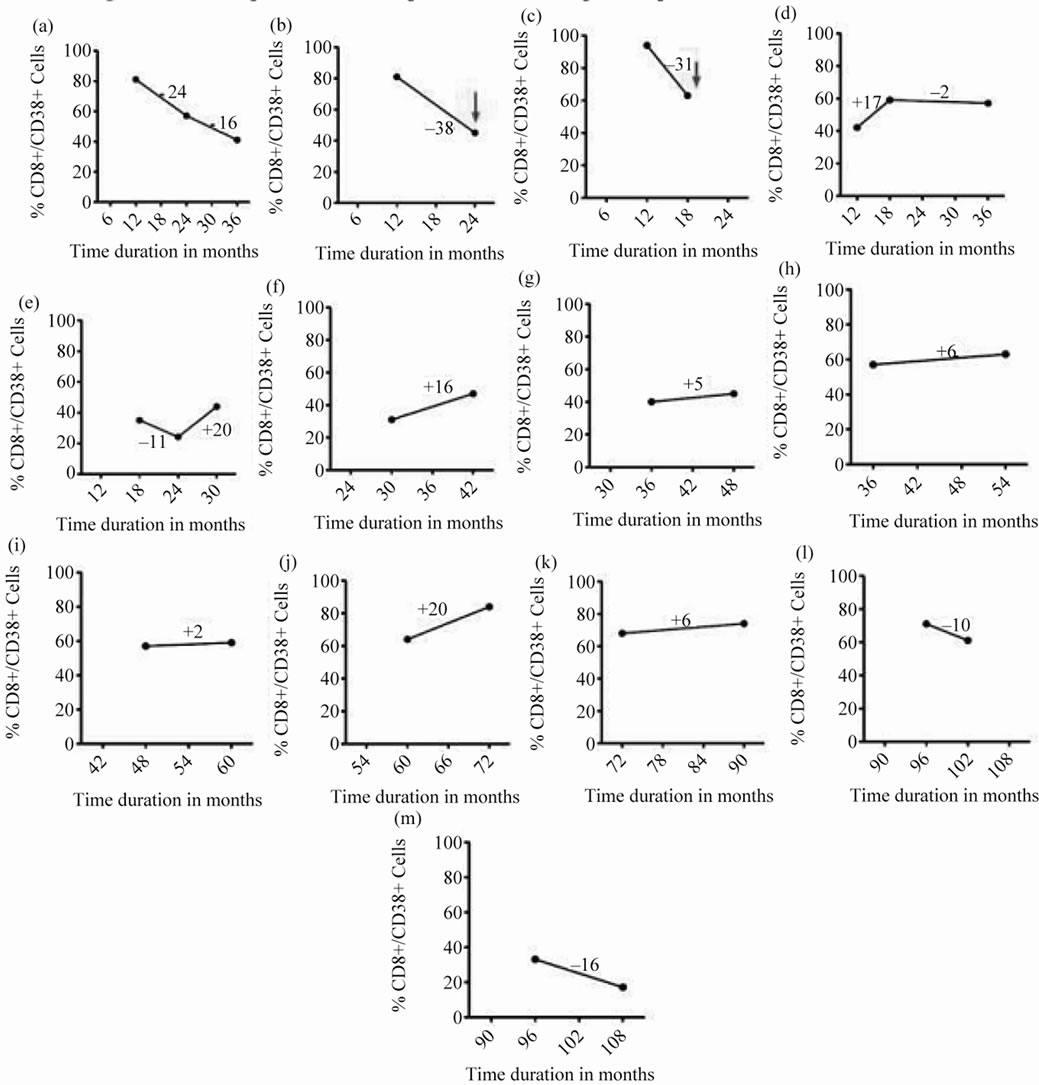
Figure 4. Follow up of CD8+/38+ expression of 13 HIV positive patients at different time intervals: CD8+/38+ expression of 13 HIV positive patients at baseline (collected at different time intervals) of sample collection and its follow-up after 6 or 12 months represented by filled circles connected with straight lines. The red arrow denotes sudden fall in the expression of CD8+/38+ (>30%) and the time interval at which the patient was diagnosed positive for tuberculosis.
duction in CD38KO mice and opined that it may be due to the absence of CD38, as activation of T cells via CD38 induces production of this cytokine. It may also be due to absence of CD38 on DC. Perhaps, other patients who were followed up and had marginal variation in CD38 expression with time had less influence on their susceptibility for developing tuberculosis.
The increase in CD38 expression on CD8+ cells after the co-infection observed in this study, could be due to the HIV viral loads which increase after the manifestation of tuberculosis. It is known that there is an increase in the percentage of cells expressing CD38 in patients with active TB, returning to normal after therapy [4]. M.tb increases HIV production in chronically or acutely infected monocytic cell lines. HIV specific CD4+ T cell activation is thought to increase viral replication that occurs during TB disease [15]. In the HIV-TB cured group (data not shown), the expression of CD38 declined in this study, indicative of low viral loads. While in the western world, plasma HIV viremia often declined after successful anti-TB treatment [15], in the Africans HIV viral load remained unchanged during or after successful completion of the treatment [16-20], suggesting that genetic factors could prevail on the viral replication. Geographic region, an important risk factor for developing active tuberculosis, may also influence the outcome of anti-tuberculosis treatment on the viral loads [21].
The present study suggested that a rapid decline in the expression of CD38 on CD8 cells would increase the risk of developing tuberculosis, especially within first 2 years after HIV infection. Studies on a larger number of HIV+ patients with a longitudinal follow-up are warranted to confirm the hypothesis. CD38 could perhaps act as an early biomarker for susceptibility to tuberculosis in HIVpositive individuals.
5. ACKNOWLEDGEMENTS
We thank LEPRA India, staff of Blue Peter Public Health & Research Centre (BPHRC) for their support. Work was funded by Department of Biotechnology (DBT), Government of India (No: BT/PR/7871/ MED/14/1153/2006) and all the subjects participated in the study.
REFERENCES
- Giorgi, J.V., Majchrowicz, M.A., Johnson, T.D., et al. (1998) Immunologic effects of combined protease inhibitor and reverse transcriptase inhibitor therapy in previously treated chronic HIV-1 infection. AIDS, 12, 1833-1844. doi:10.1097/00002030-199814000-00015
- Langford, S.E., Ananworanich, J. and Cooper, D.A. (2007) Predictors of disease progression in HIV infection: A review. AIDS Research and Therapy, 4, 11. doi:10.1186/1742-6405-4-11
- Rodrigues, D.S.S., Cunha, R.M.C., Kallas, E.G., et al. (2003) Distribution of naive and memory/effector CD4+ T lymphocytes and expression of CD38 on CD8+ T lymphocytes in AIDS patients with tuberculosis. The Brazilian Journal of Infectious Diseases, 7, 161-165. doi:10.1590/S1413-86702003000200010
- Rodrigues, D.S.S., Medeiros, E.A.S., Weckx, L.Y., et al. (2002) Immunophenotyping characterization of peripheral T lymphocytes in Mycobacterium tuberculosis infection and disease. Clinical and Experimental Immunology, 128, 149-154. doi:10.1046/j.1365-2249.2002.01809.x
- Dembek, C.J., Kutscher, S., Heltai, S., et al. (2010) Nefspecific CD45RA+ CD8+ T cells secreting MIP-1β but not IFN-γ are associated with nonprogressive HIV-1 infection. AIDS Research and Therapy, 7, 20. doi:10.1186/1742-6405-7-20
- Imami, N. and Gotch, F. (2002) Prospects for immune reconstitution in HIV-1 infection. Clinical and Experimental Immunology, 127, 402-411. doi:10.1046/j.1365-2249.2002.01822.x
- Benito, J.M., Lopez, M., Lozano, S., et al. (2005) Differential upregulation of CD38 on differential T-cell subsets may influence the ability to reconstitute CD4+ T cells under successful highly active antiretroviral therapy. Journal of Acquired Immune Deficiency Syndrome, 38, 373-381. doi:10.1097/01.qai.0000153105.42455.c2
- Viegas, M.S., Carmo, A.D., Silva, T., et al. (2007) CD38 plays a role in effective containment of mycobacteria within granulomata and polarization of Th1 immune responses against Mycobacterium avium. Microbes and Infection, 9, 847-854. doi:10.1016/j.micinf.2007.03.003
- Pydi, S.S., Bandaru, A., Venkatasubramanian, S., et al. (2011) Vaccine for tuberculosis: Up-regulation of IL-15 by Ag85A and not by ESAT-6. Tuberculosis, 91, 136-139. doi:10.1016/j.tube.2010.12.003
- Barry, S.M., Johnson, M.A. and Janossy, G. (2003) Increased proportions of activated and proliferating memory CD8+ T lymphocytes in both blood and lung are associated with blood HIV viral load. Journal of Acquired Immune Deficiency Syndrome, 34, 351-357. doi:10.1097/00126334-200312010-00001
- Shepard, B.D., Loutfy, M.R., Raboud, J., et al. (2008) Early changes in T-cell activation predict antiretroviral success in salvage therapy of HIV infection. Journal of Acquired Immune Deficiency Syndrome, 48, 149-155. doi:10.1097/QAI.0b013e31816d9c3b
- Glencross, D.K., Janossy, G., Coetzee, L.M., et al. (2008) CD8/CD38 activation yields important clinical information of effective antiretroviral therapy: Findings from the first year of the CIPRA-SA cohort. Cytometry Part B: Clinical Cytometry, 74, 131-140. doi:10.1002/cyto.b.20391
- Biancotto, A., Grivel, J.C., Iglehart, S.J., et al. (2007) Abnormal activation and cytokine spectra in lymph nodes of people chronically infected with HIV-1. Blood, 109, 4272-4279. doi:10.1182/blood-2006-11-055764
- Zhang, Y., Nakata, K., Weiden, M. and Rom, W.N. (1995) Mycobacterium tuberculosis enhances human immunodeficiency Virus-1 replication by transcriptional activation at the long terminal repeat. Journal of Clinical Investigations, 95, 2324-2331. doi:10.1172/JCI117924
- Goletti, D., Weissman, D., Jackson, R.W., et al. (1996) Effect of Mycobacterium tuberculosis on HIV replication. Role of immune activation. Journal of Immunology, 157, 1271-1278.
- Wolday, D., Tegbaru, B. ,Kassu, A., et al. (2005) Expression of chemokine receptors CCR5 and CXCR4 on CD4+ T cells and plasma chemokine levels during treatment of active tuberculosis in HIV-1-coinfected patients. Journal of Acquired Immune Deficiency Syndrome, 39, 265-271. doi:10.1097/01.qai.0000163027.47147.2e
- Lawn, S.D., Shattock, R.J., Acheampong, J.W., et al. (1999) Sustained plasma TNF-α; and HIV-1 load despite resolution of other parameters of immune activation during treatment of tuberculosis in Africans. AIDS, 13, 2231-2237. doi:10.1097/00002030-199911120-00005
- Toossi, Z., Mayanja-Kizza, H., Hrisch, C.S., et al. (2001) Impact of tuberculosis (TB) on HIV-1 activity in dually infected patients. Clinical and Experimental Medicine, 123, 233-238.
- Wolday, D., Hailu, B., Girma, M., et al. (2003) Low CD4+ T-cell count and high HIV viral load precede the development of tuberculosis disease in a cohort of HIV-positive Ethiopians. International Journal of Tuberculosis & Lung Diseases, 7, 110-116.
- Morris, L., Martin, D.J., Bredell, H., et al. (2003) Human immunodeficiency virus-1 RNA levels and CD4 lymphocyte counts, during treatment for active tuberculosis, in South African petients. Journal of Infectious Diseases, 187, 1967-1971. doi:10.1086/375346
- Astena, L.V., Langendama, M., Zangerleb, R., et al. (2003) Tuberculosis risk varies with the duration of HIV infection: A prospective study of European drug users with known date of HIV seroconversion. AIDS, 17, 1201-1208.