Open Journal of Ecology
Vol.4 No.8(2014), Article ID:46465,22 pages DOI:10.4236/oje.2014.48038
The Effects of Ocean Acidity and Elevated Temperature on Bacterioplankton Community Structure and Metabolism
Nam Siu1, Jude K. Apple2, Craig L. Moyer1*
1Biology Department, Western Washington University, Bellingham, USA
2Shannon Point Marine Center, Western Washington University, Anacortes, USA
Email: *cmoyer@hydro.biol.wwu.edu
Copyright © 2014 by authors and Scientific Research Publishing Inc.
This work is licensed under the Creative Commons Attribution International License (CC BY).
http://creativecommons.org/licenses/by/4.0/


Received 6 March 2014; revised 6 April 2014; accepted 12 April 2014
ABSTRACT
By the end of the 21st century, mean sea surface temperatures are expected to increase 4˚C, while atmospheric CO2 concentrations are predicted to triple causing seawater to become acidic. These compounding effects will undoubtedly have major consequences for the organisms and processes in the oceans. Bacterioplankton play a vital role in the marine carbon cycle and the oceans’ ability to sequester CO2. We utilized pCO2 perturbation experiments to investigate the effects of ocean acidity and elevated temperature on bacterioplankton community structure and metabolism. Terminal-restriction fragment length polymorphism (T-RFLP) of small subunit ribosomal (SSU) genes revealed that bacterioplankton incubated in lower pH conditions exhibited a reduction of species richness, evenness, and overall diversity, relative to those incubated in ambient pH conditions. Non-metric multidimensional scaling (MDS) of T-RFLP data resulted in clustering by pH suggesting that pH influenced the structure of these communities. Shifts in the dominant members of bacterioplankton communities incubated under different pH were observed in both T-RFLP and SSU clone library analyses. Both ambient and low pH communities were dominated by Gammaproteobacteria and Alphaproteobacteria, although abundance of Alphaproteobacteria increased in communities incubated at lower pH. This was expressed by the gamma to alpha ratio dropping from ~9 to 4, respectively. In general, the representative taxa from these two classes were distinctly different between the treatments, with a few taxa found to be persistent in both treatments. Changes in the structure of bacterioplankton communities coincided with significant changes to their overall metabolism. Bacterial production rates decreased, while bacterial respiration increased under lower pH conditions. This study highlights the ability of bacterioplankton communities to respond to ocean acidification both structurally and metabolically, which may have significant implications for their ecological function in the marine carbon cycle and the ocean’s response to global climate change.
Keywords
Ocean Acidification, Climate Change, Bacterioplankton, Community Structure

1. Introduction
Since the beginning of the industrial revolution, anthropogenic activities have rapidly increased the concentration of CO2 in the atmosphere, contributing to global climate change [1] . One major consequence of the change in global climate is the rise of temperatures in a variety of habitats including the oceans. The oceans have absorbed approximately one third of all CO2 released into the atmosphere, offsetting the rapid increase of CO2 in the atmosphere and ameliorating global climate change [2] . Despite oceanic sequestration of atmospheric CO2, global temperatures are expected to increase up to 4˚C and CO2 concentrations are predicted to increase two to three fold over the next century [1] [3] . Furthermore, the oceanic absorption of atmospheric CO2 is causing seawater to become increasingly acidified. This rate and magnitude of ocean acidification has not been experienced in the past 300 million years [4] . Consequently, marine ecosystems are especially vulnerable to these changes to the environment as organisms are under the compounding stress of ocean acidification and warming.
The biomass of the oceans is largely microbial, with millions of bacterial cells in every milliliter of seawater [5] . In some marine ecosystems, these microbes account for the majority of the overall respiration in the system [6] [7] . Due to their great abundance and overall contribution to biological processes in the oceans, heterotrophic bacterioplankton are fundamental components of marine biogeochemical cycles [8] -[10] . These bacterioplankton are responsible for consuming the majority of organic carbon fixed by photosynthesis [11] . In turn, organic carbon from these microbes is consumed by higher trophic levels through the “microbial loop” [12] . Heterotrophic bacterioplankton also produce sinking organic aggregates, deposits and flocculent matter in the form of detritus or marine snow and are important in marine sediment formation. This microbially mediated process known as the “biological pump” [13] transports organic carbon vertically through the water column for sequestration in the deep sea and is one of the largest oceanic carbon sinks [14] . By facilitating carbon sequestration, these bacterioplankton perform a vital role in the response of the oceans to global climate change [15] . Moreover, the efficiency of carbon sequestration in the ocean is regulated by the carbon consumption and transport rates of bacterioplankton which is ultimately determined by the phylogenetic structure of these communities and their overall metabolism [16] .
Despite the important role of heterotrophic with respect to the flux and sequestration of carbon, few studies have examined how these microorganisms will respond to increased ocean acidity and temperature over the next century, let alone the combined effects of both these factors [17] [18] . One of the first investigations utilized mesocosms to study the effects of increased partial pressure of CO2 (pCO2) on entire planktonic communities. This study found that during the breakdown of a phytoplankton bloom caused by pCO2 enrichment, bacterioplankton abundance increased significantly [19] . Alterations to the phylogenetic structure of bacterioplankton communities as a response to elevated pCO2 have been detected by denaturing gradient gel electrophoresis (DGGE) [20] [21] . A similar study using terminal-restriction fragment length polymorphism (T-RFLP) to track the response of bacterioplankton communities to increased pCO2 also suggested that ocean acidification can potentially affect the structure of the bacterioplankton communities [22] , however their findings might be limited by the use of only two restriction enzymes [23] . More recently, pyrosequencing was used to identify bacterioplankton community composition and found that these were dominated by representatives of Gammaproteobacteria and Alphaproteobacteria [24] . This study also showed how these communities response to dissolved organic carbon (DOC) input could be affected by ocean acidification [24] .
Shifts in the structure of heterotrophic bacterioplankton communities, in addition to the anticipated changes in ocean pH and temperature over the next century will undoubtedly have consequences for their overall metabolism and ecological function [16] -[18] . Even less is known about the link between changes in bacterioplankton community structure to the responses in the overall metabolism and in turn the ecological function of these communities [21] [25] [26] . Such comprehensive and encompassing studies are necessary because most of the available models on ocean acidification exclude biological processes. Additionally, due to their contribution to carbon flux in the oceans, these bacterioplankton are immensely important in determining the ocean’s response to increased pCO2 [27] . One study has suggested that vertical carbon flux will increase due to elevated pCO2 [28] , while another predicted that the vertical flux of marine aggregates will slow or even stop [29] . Increased rates of extracellular enzymatic activity, protein production and polysaccharide degradation by bacteria under enriched pCO2 conditions have also been documented [19] [30] [31] . Moreover, although it is difficult to imagine a future where increases in ocean temperature and acidity do not occur simultaneously, none of the previous studies have examined the combined effects of ocean acidification and warming on the structure and function of bacterioplankton communities.
As marine microbial assemblages have historically experienced variable pH in the environment, a practical null hypothesis is that there will be no change in the ecological function of microbial communities due to decreased pH [17] . Alternately, a review of more recent investigations suggests that ocean acidification will affect microbial communities and their overall function will shift [18] . It is clear that the changes in the marine environment predicted for the near-future are not going to catastrophically reduced bacterioplankton communities or their functions. However, due to previously observed community shifts, it is expected that changes in pH, temperature and their combined effects will drive shifts in the phylogenetic structure of bacterioplankton communities and the physiology of the communities as a whole, affecting metabolism and ecological function [16] [32] [33] .
The purpose of this study is to investigate the compositional and metabolic response of heterotrophic bacterioplankton communities taken from the Salish Sea to acidity and elevated temperature in perturbation experiments. The effects of these factors on bacterioplankton community structure and metabolism were determined by exposing bacterioplankton to anticipated near-future temperatures and pCO2 concentrations in laboratory incubations. The objectives of this study were to 1) investigate the phylogenetic response of these bacterioplankton communities to increased temperature and acidity using molecular techniques targeting the bacterial SSU rDNA and 2) determine the metabolic response of these bacterioplankton communities by measuring rates of bacterial production and respiration.
2. Materials and Methods
2.1. Study Site and Sample Collection
Water samples were collected from the central Salish Sea (San Juan Channel, San Juan Islands, WA) utilizing a conductivity, temperature and depth (CTD) rosette from a research vessel (R/V Centennial, Friday Harbor Laboratories, University of Washington) and the seawater intake system at Shannon Point Marine Center (SPMC) (48˚30'32.78"N, 122˚41'8.06"W). Three representative environmental bacterioplankton communities were collected from two locations (north and south) along the San Juan Channel and SPMC’s seawater intake system (Figure 1). Bacterioplankton assemblages were collected on 0.22 µm Sterivex filters (Millipore, Billerica, MA) and individually stored at 4˚C in RNAlater nucleic acid preservative (Ambion, Austin, TX). Inoculum used in perturbation experiments were made by filtering SPMC intake seawater through a 3 µm capsule filter (Pall Life Sciences, Port Washington, NY).
2.2. Perturbation Experimental Design
A gas equilibration and measurement system utilizing a LI-820 CO2 Analyzer (LI-COR Biosciences, Lincoln, NE) was used to bubble autoclaved 0.22 µm filtered seawater to experimental pCO2 concentrations of 380 ppm and 1050 ppm for one week [34] . The pH was verified through direct probe measurements and Gran alkalinity titrations coupled with the use of a web-based alkalinity calculator (http://or.water.usgs.gov/alk/) and the program co2sys.xls v14 [35] . Equilibrated seawater were inoculated and incubated in collapsible 4 liter cubitainers and 300 ml biological oxygen demand (BOD) bottles in incubators set on 24 hr dark cycles at experimental temperatures of 10˚C and 16˚C. The four experimental treatments resulted in a 4 × 4 factorial design allowing for the investigation of the direct and combined effects of pCO2 concentration and temperature on bacterioplankton community structure and metabolism. One treatment of 380 ppm and 10˚C represented present day conditions and one treatment of 1050 ppm and 16˚C represented conditions predicted for the next century. For each treatment three replicates were performed in cubitainer incubations and four replicates were performed in BOD incubations. One liter fractions were sampled from the cubitainers on to 0.22 µm Sterivex filters for molecular analysis at 7 and 14 days, while BOD bottles were fixed using Winkler titration reagents at the beginning of in
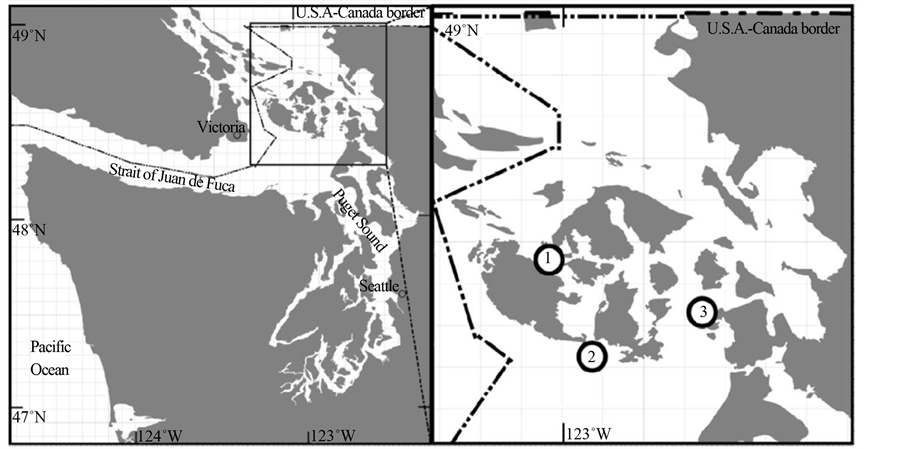
Figure 1. Sample locations include: environmental samples collected from the bottom waters of North (1) and South (2) San Juan Channel, San Juan Islands WA. Inoculum (3) for pCO2 perturbation experiments were taken from the seawater intake system at Shannon Point Marine Center, Fidalgo Island, WA.
cubations, 24 and 48 hrs for measurement of dissolved oxygen. Three replicate incubations for each of the two pCO2 treatments (380 ppm and 1050 ppm), two temperature treatments (10˚C and 16˚C) and two sampling time points (7 and 14 days) were pooled resulting in the analysis of eight experimental meta-communities. The pH in the 380 ppm treatments ranged between 7.89 and 7.85, while in the 1050 ppm treatments the pH ranged between 7.60 and 7.55. A second perturbation experiment was conducted to quantify bacterial production of the different bacterioplankton communities that responded to the increase in environmental pCO2 concentrations. Due to relatively minor changes in bacterioplankton community structure with regards to temperature, this second experiment focused only on the effects of increased pCO2 concentrations (380 ppm vs. 1050 ppm) for an incubation period of 7 days.
2.3. DNA Extraction and Amplification
Genomic DNA (gDNA) of the bacterioplankton communities collected on 0.22 µm Sterivex filters were extracted using a FastDNA SPIN Kit for Soil (MP Biomedicals, Santa Ana, CA) following the manufacturer’s specifications; with the modifications where the filters were aseptically and individually extracted from their housing and diced to fit into the supplied extraction tubes. DNA was eluted into filter sterilized 10 mM Tris buffer at pH 8. A FastPrep instrument was used at an indexed speed of 5.5 for 30 seconds to mechanically lyse cells. The purity and concentration of gDNAs were quantified with a Nanodrop ND-1000 spectrophotometer (Thermo Scientific, South Logan, UT) and samples were diluted to a concentration of ~10 ng/µl. Extracted gDNAs were PCR amplified using FAM labeled forward primer 68F (5’ TNA NAC ATG CAA GTC GRR CG 3’) and an unlabeled reverse primer 1492R (5’ RGY TAC CTT GTT ACG ACT T 3’) for the bacterial SSU rRNA gene, where R is a purine analog, Y is a pyrimidine analog, and N is an equal mixture both analogs (Glen Research, Sterling, Virginia). PCR reactions were performed in duplicates using 10 - 20 ng of gDNA template, 5 U of Taq DNA polymerase, 1X PCR Buffer (100 mM Tris-HCl at pH 9.0, 500 mM, 1% Triton X-100), 2.5 mM MgCl2, 200 µM of each dNTP, 10 µg BSA, 1 µM each of forward and reverse primers, and molecular grade water to a total volume of 50 µl. A hot start step (2 min at 95˚C) was performed before the addition of BSA and Taq. The following conditions were used for the amplification process: 30 cycles of denaturation (94˚C for 1 min), annealing (57˚C for 90 sec) and elongation (72˚C for 3 min) with an additional final elongation (72˚C for 7 min). The size of PCR amplicons were verified using 1% agarose gel electrophoresis against a 1-kb ladder (Invitrogen, Carlsbad, CA). Negative PCR controls were confirmed throughout experiments. Replicate PCR products were pooled and desalted using 30 K centrifugal filters (VWR International, Radnor, PA).
2.4. Terminal-Restriction Fragment Length Polymorphism Analysis
Pooled PCR products from each sample were separated and individually digested with the eight following restriction-endonuclease treatments (New England Biolabs, Ipswich, MA): AluI, BstUI, HaeIII, HhaI, HinfI, MboI, MspI and RsaI. Each reaction mixture used 10 U of restriction enzyme, 1X NEBuffer 2 (New England Biolabs), 15 µl PCR product and molecular grade water for a 30 µl total volume. All treatments were incubated for 12 hrs at 37˚C, except for BstUI which was at 60˚C. Fragments were cleaned using Sephadex G-75 columns by centrifuging at 750 × g at 4˚C for 5 min into aseptic 96-well plates. Desalted fragments were then dried at 60˚C under vacuum and resuspended in 15 µl of formamide with 0.5 µl LIZ-labeled GeneScan-500 internal size standard (Applied Biosystems, Foster City, CA). Samples were denatured at 95˚C for 5 min, before separation by capillary electrophoresis via an ABI 3130xl with a 50 cm capillary array using POP 6. Analysis only included terminal restriction fragments (T-RFs) between 50 - 500 bp in size [23] . All samples were normalized so that T-RF arrays containing peaks greater than 1000 relative fluorescence units (RFUs) with none greater than 6000 RFUs. BioNumerics (Applied Maths, Sint-Martens-Latem, Belgium) was used for cluster analysis of the composite T-RFLP fingerprints by UPGMA and Pearson product-moment correlation [36] . Cophenetic correlation coefficients were calculated to assess the robustness of the cluster analysis groupings. A similarity matrix was generated and entered in to a Bray-Curtis resemblance matrix in the program PRIMER v6 [37] for 2D multidimensional scaling (MDS) and two-way analysis of similarities (ANOSIM) on the effects of pCO2 concentrations and temperatures. A univariate analysis of variance (ANOVA) was performed using the program SPSS version 17 (IBM, Armonk, NY) on the number of T-RFs detected for each of three sample types, where T-RF counts from each restriction enzyme was used as a separate replicates.
2.5. Clone Library Construction and Analysis
Two representative clone libraries (380 ppm and 1050 ppm) were constructed from four replicate PCRs of SSU genes, using 25 to 50 ng of gDNA template, 5 U of AmpliTaq Gold (Applied Biosystems, Carlsbad, CA), 1X AmpliTaq Gold PCR buffer, 2.5 mM MgCl2, 200 µM each dNTP, 10 µg BSA, 1 µg T4 gene 32 protein (Ambion, Austin, TX), 1 µM of unlabeled primer (i.e., both 68F and 1492R) and molecular grade water to a total volume of 50 µl. The following conditions were used for the amplification process: a hot start (94˚C for 5 min), 30 cycles of denaturation (94˚C for 1 min), annealing (56˚C for 90 sec) and elongation (72˚C for 3 min) with a final elongation (72˚C for 7 min). The size of amplicons was again verified using 1% agarose gel electrophoresis against a 1-kb ladder. Negative controls were confirmed throughout. The replicate PCR mixtures were pooled, concentrated, and desalted with Amicon 50 K ultra centrifugal filters (Millipore). The purified amplicons were then ligated with a CloneJET blunt-end PCR cloning kit (Thermo Scientific, South Logan, UT) following the manufacturer’s instructions. Ligation reactions were transformed into One Shot Top10 cells (Invitrogen) and grid-plated on LB media with 100 µg/ml ampicillin. All putative clones were partially sequenced to determine operational taxonomic unit (OTU) structure of each clone library, and one clone from each major OTU was selected for full-length sequencing [38] . Full length (>1400 bp) sequences were assembled contiguously with a minimum of 2X coverage using the program BioNumerics. SSU sequences were aligned with the Arb-SILVA database using the SINA Webaligner function [39] . Alignments were edited and then masked using the program BioEdit [40] . A minimum similarity of 97% was used to bin the clones into their prospective OTUs [41] . OTUs were numbered in order from lowest to highest according to the abundance of clones from highest to lowest, thus OTU 1 was the most dominant OTU containing the highest abundance of clones. Shannon diversity index, estimated OTU richness (ACE and Chao), and rarefaction curves were calculated using the program DOTUR with a 97% similarity cutoff [41] . Clone library coverage was calculated with the following equation: C = 1-(n/N), where n is the number of unique OTUs and N is the total number of clones analyzed [42] . Clone sequences were identified to the lowest taxonomic group possible using both the Ribosomal Database Project (RDP) version 10.14 seqmatch algorithm [43] and NCBI’s Basic Local Alignment Search Tool (BLAST). Sequences were screened for chimeras with the program Mallard v1.02 [44] . SSU sequences from each clone library were digested in silico in order to assign phylogenetic affiliations to T-RFs from the perturbation experiment. The in silico digests were performed using the same eight restriction enzymes as in the T-RFLP analysis, allowing for a variation of 2 bp when comparing T-RF sizes. A SIMPER analysis was performed in the program PRIMER v6 to identify the taxa responsible for differences in the structure of bacterioplankton communities between the two clone libraries. SSU rDNA sequences obtained in this study were submitted to GenBank under the accession numbers KC139297 through KC139306.
2.6. Bacterial Respiration
The decline of O2 concentrations over 24 and 48 hr periods was measured using Winkler titrations [45] with a MetrohmTitrino automated titrator with a potentiometric titrode (Metrohm AG, Herisau, Switzerland). Initial O2 concentrations were measured from five replicate BOD bottles fixed at the beginning of experimental incubations. Final O2 concentrations were determined using four replicate BOD bottles for each treatment. The oxygen measurements taken at 24 and 48 hrs from the two pCO2 treatments and two temperature treatments resulted in four averaged bacterial respiration rates from four replicates during each incubation period. A multivariate ANOVA (MANOVA) was performed in the program SPSS version 17 (IBM, Armonk, NY) to examine the effects of incubation period, pCO2 concentration and temperature on bacterial respiration in the different treatments.
2.7. Bacterial Production
For the second perturbation experiment, 3H-leucine incorporation was as used to measure bacterial production [32] . Briefly, bacterioplankton samples were incubated with 3H-leucine for 1 hr and then terminated with the addition of 100% trichloroacetic acid (TCA). Precipitation of incorporated leucine was achieved by addition of cold 5% TCA followed by centrifugation. Standardization of production rates was performed by subtracting mean change in leucine concentrations among controls for each treatment. Three replicates were performed for two pCO2 treatments (380 ppm and 1050 ppm) and averaged to determine mean bacterial leucine uptake rate. Rates of leucine incorporation were converted to carbon using a conversion factor of 3.1 kg C mol per leucine [46] . A univariate ANOVA was performed in the program SPSS version 17 (IBM, Armonk, NY) to test for differences in bacterial production rates between pCO2 treatments.
3. Results
Three distinct clusters of bacterioplankton communities were identified with UPGMA/Pearson product moment correlation cluster analysis of composite bacterial T-RFLP community fingerprints. The first cluster was exclusively composed of environmental samples, while the remaining two clusters consisted of experimental samples clustering by pCO2 treatments. These clusters are designated as the environmental cluster, the low pCO2 cluster and the high pCO2 cluster. Communities in the environmental cluster were most similar to those of the low pCO2 cluster and most dissimilar to those of the high pCO2 cluster (Figure 2). The three most revealing restriction enzymes treatments in terms of T-RFs and community shifts were BstUI, HaeIII and HhaI (Figure S1). Enumerations of group mean T-RFs ± SE among clusters found that the environmental cluster exhibited the highest richness with 19 ± 1 T-RFs; the low pCO2 cluster contained 9 ± 1 T-RFs, while the high pCO2 cluster was lowest in richness with 6 ± 1 T-RFs (Table 1). The number of T-RFs between the three clusters were found to be significantly different (P = 0.02). Multidimensional scaling of similarity values between samples in bacterial T-RFLP community fingerprints also revealed the same three distinct clusters in a 2D MDS plot with a 2D stress of 0.01 (Figure 3). The mean similarity (± SE) between samples was greatest within the environmental cluster at 82.4% ± 2.22%, followed by the low pCO2 cluster and the high pCO2 cluster at 80.2% ± 2.68% and 70.8% ± 3.20% respectively. This suggested that communities in the environmental cluster experienced the least amount of variability in community structure. Mean pairwise similarity values (± SE) were greatest between the environmental cluster and the low pCO2 cluster at 28.7% ± 1.73%, however the environmental cluster was only 20.7% ± 0.63% similar to the high pCO2 cluster. Lastly, the low pCO2 cluster was 23.1% ± 1.98% similar to the high pCO2 cluster. A two-way ANOSIM on the effects of pCO2 and temperature between all samples found that pCO2 concentration was most influential on the structure of bacterioplankton communities, their similarities and how they clustered (R = 1, P = 0.11), while temperature had little to no effect (R = 0, P = 0.67). A subsequent one-way ANOSIM isolating the effects of pCO2 found that pCO2 significantly influenced the structure of bacterioplankton communities (R = 1, P = 0.004).
Clone library analysis of SSU rDNA from two samples representing the low and high pCO2 clusters resulted in the partial and full length sequencing of 75 clones from the 380 ppm treatments and 74 clones from the 1050 ppm treatments. Analysis of the two constructed clone libraries revealed distinctly different phylogenetic struc-
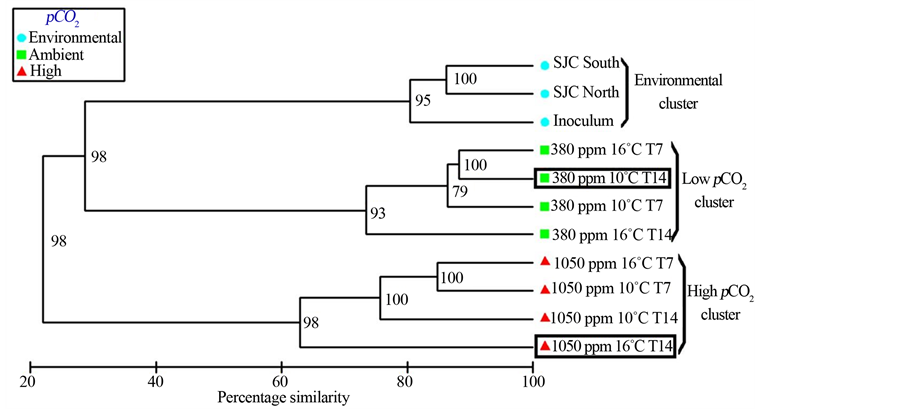
Figure 2. UPGMA/Pearson product moment correlation cluster analysis of bacterial T-RFLP community fingerprint analysis of three environmental samples and eight meta-communities from pC02 perturbation experiments. Scale bar is in percentage similarity calculated by the Pearson product moment correlation r-value × 100. Values at nodes represent the cophenetic correlation coefficients. Clone library analyses were performed on samples in boxes.
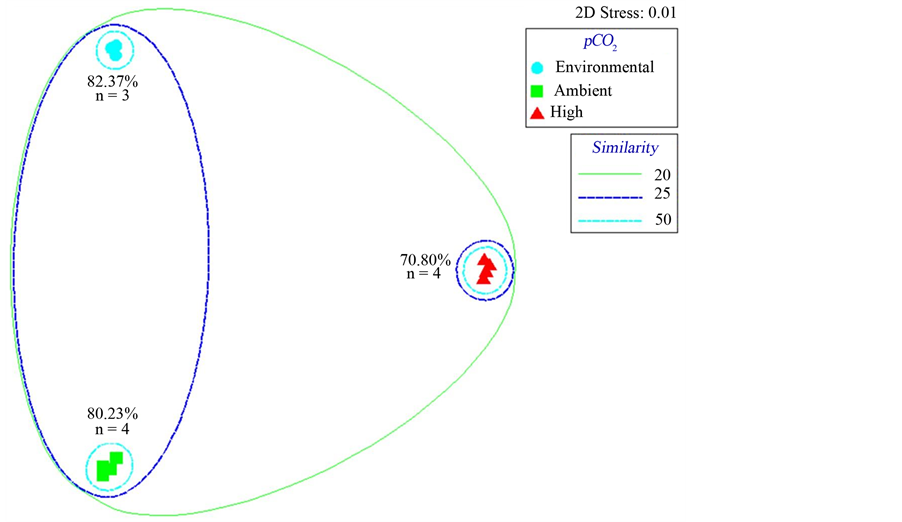
Figure 3. Bray-Curtis similarity multidimensional scaling plot generated from bacterial T-RFLP community fingerprint analysis with 20, 25 and 50 percentage similarity contours. Values adjacent to clusters represent mean similarity between samples within clusters.
ture between the low and high pCO2clusters. Communities in the 380 ppm treatments were more rich and diverse relative to those in the 1050 ppm treatments (Table 2). In total, 32 and 23 OTUs were detected in the 380 ppm and 1050 ppm clone libraries respectively. The terms “OTU” and “phylotype” are synonymous in which both are defined as a group of organisms based on taxonomic and phylogenetic relationships. ACE and Chao indexes were used to estimate OTU richness, while the Shannon index was used to estimate diversity in both

Table 1. T-RF counts from eight restriction enzymes in bacterial T-RFLP community fingerprint analysis. The number of T-RFs is a richness index representing the putative number of OTUs within a bacterial community. Dotted lines separate three clusters identified by UPGMA/Pearson product moment correlation cluster analysis of bacterial T-RFLP community fingerprints. Reported values are mean ± SE.
Table 2. Summary of clone library analyses results. Number of OTUs, estimated OTU richness (ACE and Chao), and Shannon diversity index were calculated at 97% sequence similarity using DOTUR, values in brackets represents 95% confidence intervals. γ:α ratios are estimated by the GenBank matches for sequences in each clone library. Clone library coverage was calculated with the following equation: C = 1 − (n/N) × 100, where n is the number of unique OTUs and N is the total number of clones analyzed.
clone libraries; these values are reported in Table 2 followed by their 95% low and high confidence intervals in brackets. In the 1050 ppm clone library, a higher OTU coverage of 68.9% was found relative to the 57.3% OTU coverage in the 380 ppm clone library. Rarefaction analysis of the two clone libraries suggested greater diversity in terms of richness in the 380 ppm clone library representing the low pCO2 cluster (Figure 4). Rarefaction curves also indicated sufficient sampling of both clone libraries as evident by the absence of overlap in 95% confidence intervals at the maximum number of clones sequenced. Both clone libraries were dominated by sequences of Gammaproteobacteria and Alphaproteobacteria (Figure 5). The 380 ppm clone library contained 82.7% Gammaproteobacteria and 9.3% Alphaproteobacteria sequences, yielding a higher gamma vs. alpha ratio (Table 2) than that of the 1050 ppm clone library with 75.7% Gammaproteobacteria and 18.9% Alphaproteobacteria sequences. Epsilonproteobacteria were only detected in the 380 ppm clone library, while Betaproteobacteria were detected solely in the 1050 ppm clone library. Greater richness among the Gammaproteobacteria was observed in the 380 ppm clone library. Eleven Gammaproteobacteria taxa were identified with the most abundant phylotype from the genus Colwellia. A total of six Gammaproteobacteria were detected in the 1050 ppm clone library in which phylotypes from the genus Pseudomonas were most abundant. The opposite pattern is observed among the Alphaproteobacteria. Three taxa were identified in the 1050 ppm clone library with phylotypes from the family Rhodobacteraceae being most abundant. However, Rhodobacteraceae was the only taxa of Alphaproteobacteria detected in the 380 ppm clone library. Several shared taxa were detected throughout both clone libraries. These were represented by unclassified Gammaproteobacteria phylotypes as well as phylotypes
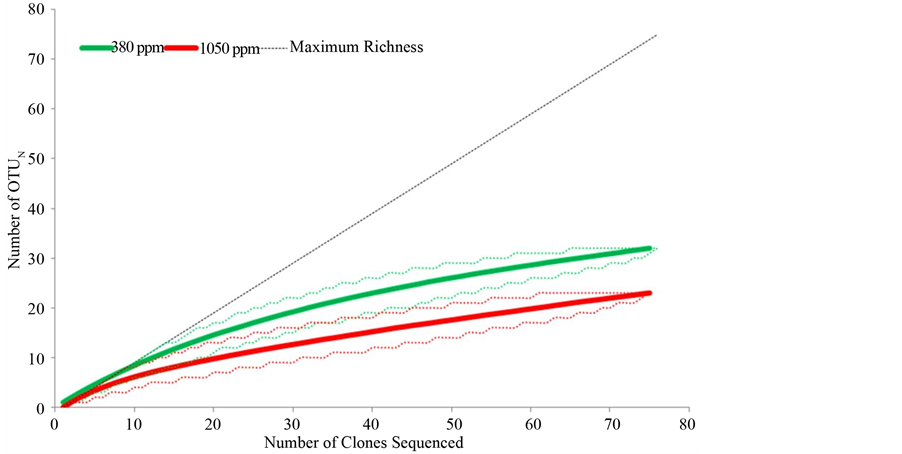
Figure 4. Rarefaction analyses of sequences from constructed clone libraries. DOTUR was used to designate OTUs based on a 97% sequence similarity cut-off. Dotted lines represent 95% low and high confidence intervals.
belonging to Alcanivorax, Glaciecola and Oceanospirillales; Alphaproteobacteria phylotypes of Rhodobacteraceae; and phylotypes of the Flavobacteria Cellulophaga. In contrast, Gammaproteobacteria phylotypes belonging to Colwellia, Spongiispira, Spongiibacter, Oleispira, Amphritea, Psychrosphaera and Marinobacter, Epsilonproteobacteria phylotypes related to Arcobacter as well as Planctomyces phylotypes were detected only in the 380 ppm clone library. Whereas Gammaproteobacteria phylotypes belonging to Pseudomonas and Porticoccus, Alphaproteobacteria phylotypes of Sneathiella and Roseovarius, and Betaproteobacteria phylotypes related to Ralstonia, and Hydrogenophaga were detected exclusively in the 1050 ppm clone library. SIMPER analysis revealed Pseudomonas, Colwellia and Porticoccus to be the three taxa contributing to a total of 53.6% of the differences in the structure of bacterioplankton communities, their relative contributions were 22.5%, 20.3% and 10.9% respectively.
Respiration rates of bacterioplankton in the perturbation experiment were calculated by the decline of O2 concentration over 24 and 48 hr incubations. Only results from the 48 hr incubations are shown, as the respiration rates in the first 24 hrs were an order of magnitude lower and did not significantly differ between treatments (Figure 6). After 48 hrs, significant differences were observed in bacterial respiration due to elevated pCO2 (P < 0.001) and temperatures (P = 0.018) (Figure 6(b)). The greatest difference was found between pCO2 treatments, where a 243% ± 29% increase in respiration rates was observed from 380 ppm to 1050 ppm pCO2 treatments. A slight decrease in respiration rates of 38% ± 5% was also observed from 10˚C to 16˚C temperature treatments. Respiration rates for the two pCO2 and two temperature treatments are reported in µgC/l/hr ± SE. These rates were 8.2 ± 2.4 in the 380 ppm 10˚C treatments, 5.5 ± 2.2 in the 380 ppm 16˚C treatments, 30.7 ± 1.2 in the 1050 ppm 10˚C treatments, and 17.4 ± 3.9 in the 1050 ppm 16˚C treatments. A significant reduction of 72% ± 13% in bacterial production due to increased pCO2 concentration was observed (P = 0.002) (Figure 7). Production rates for the two pCO2 treatments are reported in µgC/l/hr ± SE. These rates were 3.2 ± 0.14 in the 380 ppm treatments and 0.97 ± 0.50 in the 1050 ppm treatments.
4. Discussion
Heterotrophic bacterioplankton represent a majority of the biomass in the oceans [5] [10] As such, this group of microorganisms is responsible for consuming most of the primary production from phytoplankton, and facilitating many important biological processes in the oceans, including the “biological pump”, one of the largest oceanic carbon sinks [11] [13] . In addition to being a fundamental component of the marine carbon cycle, bacterioplankton play a vital role in the ocean’s ability to sequester carbon and respond to global climate change [17] .
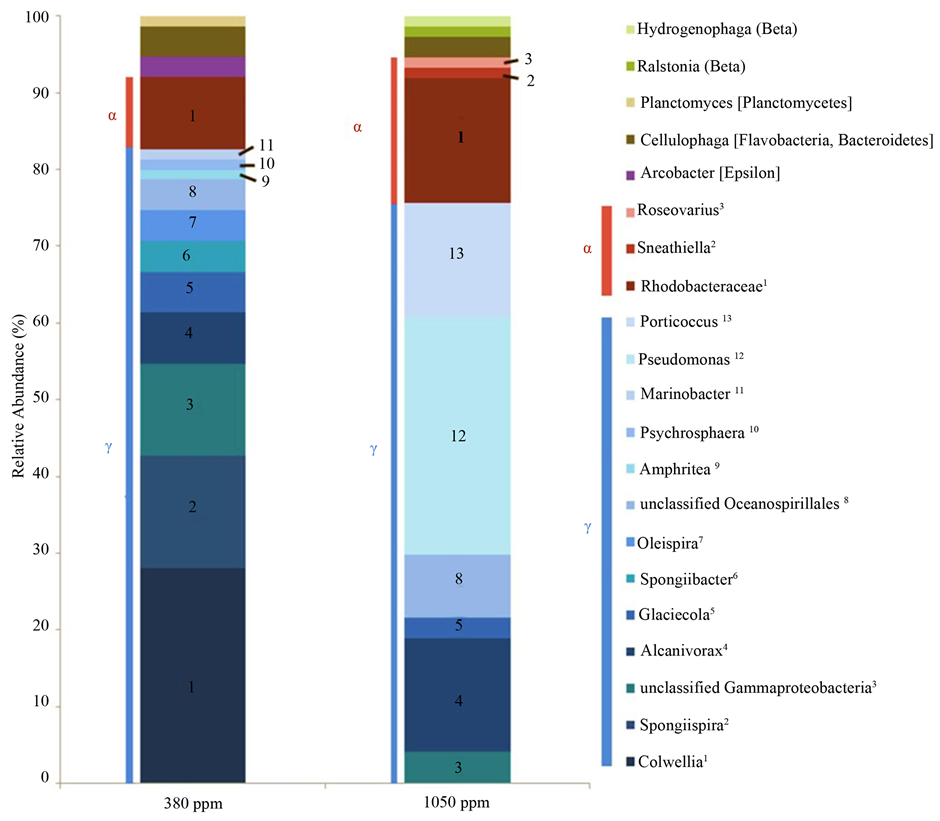
Figure 5. Relative taxonomic composition identified by clone library analyses of 380 ppm and 1050 ppm treatments. Taxonomic affiliations were determined by RDP version 10.14 seqmatch algorithm. Representatives of Gammaproteobacteria are identified by shades of blue, while those of Alphaproteobacteria are identified by shades of red.
Despite of the importance of bacterioplankton, relatively little is known about how these microorganisms themselves will respond to the warmer and more acidified oceans of the future [17] [18] . Our objective was to study on the effects of elevated temperature and ocean acidity on the composition and metabolism of heterotrophic bacterioplankton communities taken from the Salish Sea. Bacterioplankton from the Salish Sea were incubated at present-day (380 ppm) and predicated (1050 ppm) pCO2 concentrations [1] in perturbation experiments. The manipulation of pCO2 concentrations and pH in these perturbation experiments was achieved by equilibration of media through CO2 gas bubbling. This technique is considered to be more representative of natural changes over the next century compared to other methods such as acid base additions [34] . As such, 380 ppm and 1050 ppm were the concentrations of pCO2 during the equilibration of media and they represented a proxy for the change in pH/acidity. Accordingly, the low (380 ppm) pCO2 treatments equated to a mean pH of 7.88, while 7.58 was the mean pH in the high (1050 ppm) pCO2 treatments. The difference between the two pCO2 treatments corresponded to a difference of 0.3 pH units or a threefold increase in acidity, replicating present-day conditions and those predicted for the next century [1] [4] . Therefore, treatments designated as low (380 ppm) pCO2 will be referred to as less acidic or ambient pH conditions, while those of high (1050 ppm) pCO2 will be referred to as more acidic or low pH conditions.
T-RFLP community fingerprinting analysis revealed distinctly different structure among bacterioplankton
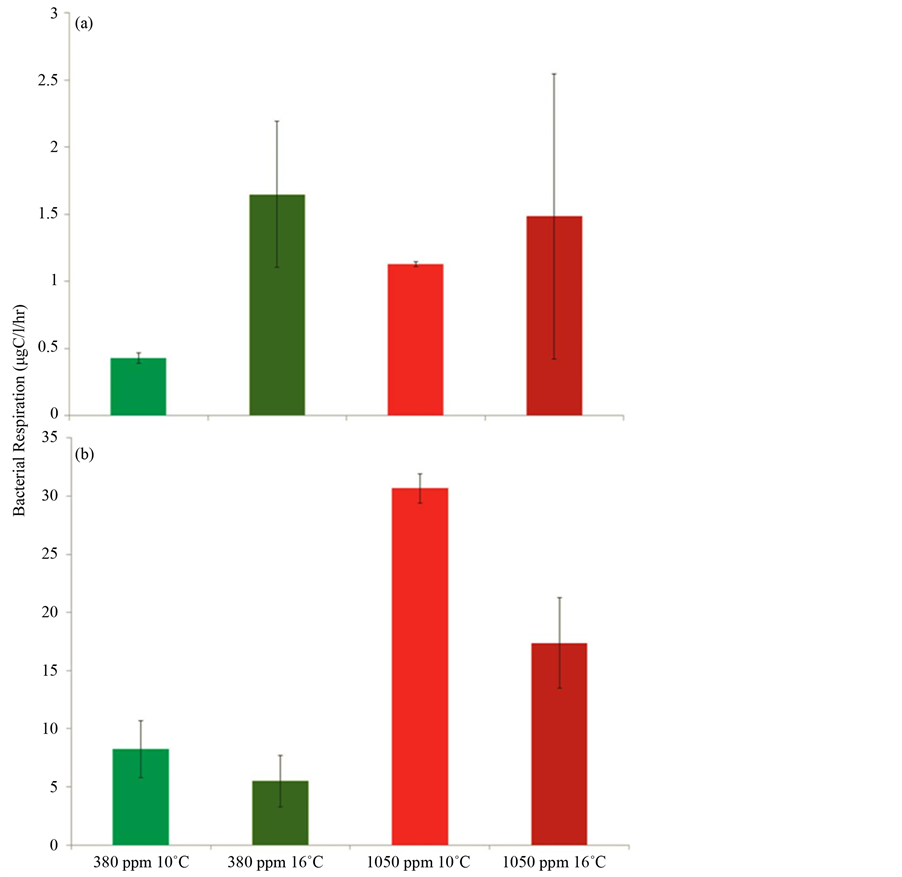
Figure 6. Bacterial respiration rates (O2 mg/l/hr) of various treatments measured by the decline of O2 in 24 hr (a) and 48 hr (b) incubations. Error bars represent standard error between replicates in each treatment. Note the difference in scale of bacterial respiration rates between graphs A and B.
communities incubated in ambient and low pH conditions. Bacterioplankton communities from ambient pH incubations exhibited a greater level of richness and structure relative to bacterioplankton communities incubated at low pH (Table 1). The first evidence of these changes in community structure arose from the comparison of T-RFLP community fingerprints among bacterioplankton communities in the ambient and low pH conditions, where significant population shifts were observed. UPGMA/Pearson product-moment correlation cluster analysis (Figure 2) and multidimensional scaling of T-RFLP data (Figure 3) revealed discrete clustering of bacterioplankton communities by pCO2 concentrations, suggesting that these changes in community structure were caused by the different pH conditions. In contrast, a recent study also using T-RFLP and SSU rDNA clone library analyses found no such responses in bacterioplankton community structure due to increased pCO2 [22] . However, only two restriction enzymes (MspI and RsaI) were used in that analysis, which could have potentially limited the ability to accurately resolve changes in community structure [23] . Nevertheless, other studies have also found little evidence of changes in bacterial community structure as a result of pCO2 enrichments [47] [48] . Still, several studies have shown varying changes to the structure of bacterioplankton communities in response
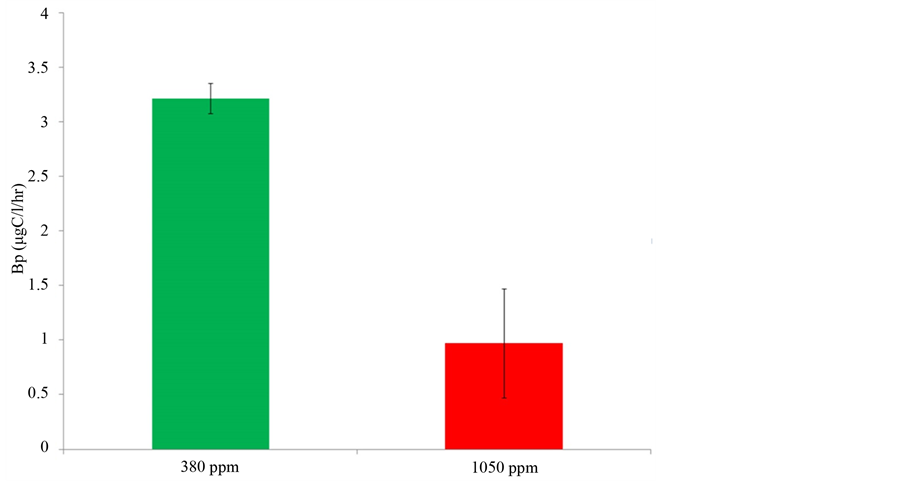
Figure 7. Bacterial production rates (µgC/l/hr) of 380 ppm and 1050 ppm treatments estimated by the incorporation of [3H] leucine with a carbon conversion factor of 3.1 kg C mol per leucine. Error bars represent standard error between replicates in each treatment.
to elevated pCO2 or reduced pH [19] [20] [49] [50] . Marine biofilms [21] [51] and other planktonic communities such as picoeukaryotes [52] have also shown altered community structure in response to increased ocean acidity.
Although the focus of this study was on the comparison of structure and metabolism among bacterioplankton communities under pH and temperatures associated with ambient and predicted conditions, environmental samples were taken and analyzed to serve as a reference. The primary difference between environmental and experimental communities was the decrease or loss of autotrophs as pCO2 perturbations were all incubated in the dark (Table 1). It was also possible that losses of heterotrophic bacterioplankton from the environment occurred due to non-ideal conditions or inability to culture certain strains [53] . This was evident in the T-RFLP analysis by the observed reduction of populations in experimental samples relative to the inoculum environmental reference (Figure S1). Despite this reduction in bacterioplankton populations, all the populations in ambient pH samples were found to be dominant populations in environmental references. This suggests that in the ambient pH samples, the same bacterioplankton from the environment were present and exhibited relatively similar patterns of dominance and structure. There were the considerable shifts in populations observed in the low pH samples relative to ambient pH and environmental samples (Figure 3). Many of the dominant bacterioplankton populations in the ambient pH and environmental samples were not detectable in the low pH samples, while populations that were not detectable previously emerged in the more acidic conditions (Figure S2). SSU rDNA clone libraries were constructed from a representative experimental sample from each of the low and ambient pH clusters observed in the T-RFLP analysis (Figure 2). The presence of similar DNA fingerprints between environmental and experimental samples was observed. The led to our simulated or in silico digests of SSU rDNA gene sequences that showed matches of fingerprints thereby allowing for the putatively identification of populations from other conditions where clone library analysis was not performed (Figure S1 and Figure S2).
Clone library analysis of SSU rDNA corroborated with the findings of the T-RFLP community fingerprinting analysis and helped to identify the phylogenetic affiliations of bacterioplankton in the two different community types associated with ambient and low pH conditions. Although fewer bacterioplankton populations were found across all samples in the T-RFLP analysis relative to numbers of found in the clone libraries. Multiple phylotypes are known to occur in the same T-RFLP peak. This was observed in T-RFLP peaks when compared to in silico digests of SSU rDNA sequences (Figure S1). However, the trend in both T-RFLP and clone library analyses were very similar in that bacterioplankton communities in acidified treatments exhibited lower levers of richness (Figure 4). Greater abundance of populations, higher levels of richness and evenness were all observed in the ambient pH clone library in comparison to the low pH clone library. Greater coverage was found in the low pH clone library and because the number of clones in the two libraries were very similar, this was most likely due to the lower richness in the low pH clone library as coverage determined by dividing the number of unique clones by the number analyzed (Table 2). The phylogenetic affiliations of populations were resolved to the lowest taxonomic group possible, some populations were identified to genus level, some only to family level, while yet others remained unclassified. Although a few taxa were found to be ubiquitous in both clone libraries, the majority of taxa were found exclusively at either ambient or low pH treatments (Figure 5). Bacterioplankton that arose in the acidified conditions were likely present under ambient pH conditions in low abundance below detection thresholds until shifts in environmental conditions favored the growth and dominance of these bacterioplankton [54] . As indicated by the SIMPER analysis, it was the change in these exclusive taxa that significantly influenced the structure of bacterioplankton communities in our study. Lower numbers of taxa relative to populations in each clone library were observed as a result of assigning and binning phylotypes into the same taxa due to inability to resolve to the lower taxonomic levels. For instance in the ambient pH clone library, three populations were all found to be phylotypes of Colwellia, causing these three populations to be represented as only one taxa in the results. Regardless of this disparity in abundance of OTUs and taxa, the trend again is clear, lower levels richness and structure were exhibited in bacterioplankton communities incubated under low pH or acidified conditions.
Phylotypes of Gammaproteobacteria and Alphaproteobacteria dominated the composition of bacterioplankton communities in both low and ambient pH incubations. However, the relative proportion of Gammaproteobacteria decreased while that of the Alphaproteobacteria increased with increasing acidity (Figure 5). This was indicated by the reduced alpha vs. gamma ratio from ambient pH to low pH incubations (Table 2). Other investigations on the response of bacterioplankton communities to increased ocean acidity have also shown Gammaproteobacteria and Alphaproteobacteria to dominate communities taken from the North Atlantic and Arctic Oceans [22] [24] . In addition, natural bacterioplankton communities throughout the vertical water column and within the acidified zone of the North Pacific have been shown to contain Gammaproteobacteria and Alphaproteobacteria occurring in a variable range of pH levels [55] . The gamma vs. alpha ratio between the clone libraries in this study was calculated as a means to signify the shift in dominance between bacterioplankton communities, as it was observed that Alphaproteobacteria increased overall richness and abundance in the low pH or more acidic incubations (Table 2 and Figure 5). A possible explanation for this shift is that Alphaproteobacteria are genetically and metabolically better adapted for the low pH and acidic conditions expected for the future. Members of the Alphaproteobacteria are known to exhibit opportunistic or generalist traits [56] [57] . For instance, members of the Rhodobacteraceae, a family of Alphaproteobacteria found in this study (Figure 5), in addition to performing nitrogen fixation, have the ability to obtain energy both heterotrophically or autotrophically (i.e., are mixothrophs) under a wide range of conditions [58] . Moreover, Roseobacter a genus found within the Rhodobacteraceae has been characterized as versatile group of marine bacteria with unusually large numbers of genes encoding for various metabolic pathways [59] -[61] . Perhaps by reducing the pH, Alphaproteobacteria are not only being selective for, but can thrive in absence of competitors that are not well suited for acidified conditions. This was indicated by the loss of bacterioplankton abundance observed in reduced DNA yields (data not shown) and richness in low pH incubations. Increased rates of protein synthesis and polysaccharide degradation by extracellular enzymes as a consequence of acidification have been documented [19] [30] [31] . Moreover, considerable suppression of prokaryotic activities has been observed at low pH conditions [62] [63] . It is possible that the changes in the composition and structure of bacterioplankton communities observed in our study were driven by the succession of bacterioplankton possessing enzymes and metabolisms that are better suited for low pH conditions. Perhaps these better adapted bacterioplankton are the opportunistic Alphaproteobacteria. A correlation between community structure and metabolism was observed in our study. Changes in the structure of bacterioplankton communities as a result of increasing acidity coincided with major changes in the overall metabolism of these communities. The production of bacterioplankton communities in low pH incubations was significantly depressed (Figure 6). This could have been caused by the observed reduction of richness in low pH incubations, and possibly the energetic and metabolic costs to bacterioplankton under acidic or stressful conditions [64] . The respiration of bacterioplankton communities significantly increased in response to low pH conditions, and was reduced to a lesser extent due to elevated temperatures (Figure 7). The effects of reduced pH on bacterial respiration were greater than those of increase temperature. It is well known that bacterioplankton under elevated temperatures respond by increasing respiration [32] [65] [66] . However, in this study, the overall respiration of bacterioplankton communities decreased due to elevated temperatures. Because there is a positive correlation between respiration and production of bacterioplankton communities [31] [32] [67] , the reduced respiration rates may have been caused by suppressed metabolic activities as indicated by decreases in bacterial production in reduced pH incubations. Another contributing factor may be the loss of total bacterioplankton respiring, as reduced richness and biomass suggested by lower DNA yields (data not shown) were observed in the acidified conditions. Although the overall respiration of bacterioplankton communities decreased, if there were less bacterioplankton in these communities as suggested, the per-cell respiration might actually not have decreased, but rather remained constant or increased. Moreover, there may have been complex unknown interactions between pH and temperature that caused the observed suppression of respiration under elevated temperature.
In this study, the effects of elevated temperature on the structure of bacterioplankton communities were minor relative to those of reduced pH, although respiration was lower due to elevated temperature. The acidified conditions in incubations were a stronger driving force behind changes in the structure and metabolism of bacterioplankton communities. In contrast to the findings of our study, past investigations have documented shifts in the composition of freshwater and marine bacterioplankton communities induced by increased temperatures [68] -[73] . However a majority of these findings have been made in exceptionally cold environments where bacteria are adapted to the cold and are more likely to respond to minor increases in temperatures. Additionally, elevated temperatures have been shown to increase bacterial production and respiration [32] . Although the independent effects of elevated temperatures have been previously studied, relatively little is known about the combined effects and interactions of pH and temperature on bacterioplankton community structure and metabolism. This represents a critical area for future investigation, if we are to fully understand the role of bacterioplankton in the warmer and more acidic oceans of the future.
Advances in technologies will allow future investigators to examine heterotrophic bacterioplankton communities at higher resolutions. For instance the use of membrane-inlet mass spectrometry can allow for very precise respiration measurements over short time scales [32] [74] . Next-gen sequencing technology can be used to produce large metagenomic and metatranscriptomic datasets providing deeper insights into the structure of bacterioplankton communities as well as the types and rates of their metabolisms. Little is know regarding the effects of dissolved (DOM) and particulate (POM) organic matter quantity and quality, which are important regulators of heterotrophic bacterioplankton community structure and metabolism [75] [76] . Previous studies have suggested that ocean acidification has the potential to alter the C:N stoichiometry and therefore the quality of organic matter produced by phytoplankton [77] -[79] . Such changes to the content and quality of organic matter can result in shifts in structure and metabolism of heterotrophic bacterioplankton communities [66] [80] [81] . Additionally, varying quantities and concentrations of DOM has also been shown to affect bacterioplankton community structure and metabolism [24] [82] . Even increasing pCO2 concentrations alone has been shown to increase the consumption of organic matter by heterotrophic bacterioplankton [25] . It is predicted that these changes to food source of bacterioplankton in addition to the effects of increased temperature and acidity will result in greater losses of carbon in the upper ocean [25] [28] [29] . This could have potentially significant consequences for carbon sequestration in the oceans and the oceans’ ability to respond to global climate change and acidification. Nonetheless, definitive knowledge regarding how bacterioplankton will structurally and metabolically respond to these combined and interactive effects remains limited [83] . This represents an area where future research is necessary to fully integrate biological processes into models of how the oceans will respond to future conditions. Although biological processes are fundamental in determining how the oceans will respond, most of the current models overlook this important component [27] . Complex feedback cycles exist between the chemistry and biology of the oceans [26] [84] . In order to make reliable predictions for the future, ensuing models on the effects of climate change and acidification on the oceans should not overlook the biological processes and the potential feedbacks that exist between the various oceanographic processes that are simultaneously occurring.
The Salish Sea is a unique marine and estuarine ecosystem with tremendous socio-economic and ecological value extending from the northern most point of the Strait of Georgia, to the western most extent of the Strait of Juan de Fuca and the southern reaches of Puget Sound. Not only are such ecosystems under the direct threat of ocean acidification from the absorption of atmospheric CO2 [85] , these ecosystems experience enhanced acidification from natural upwellings and anthropogenic sources of eutrophication increasing overall respiration in the system [86] -[88] . This is the first study to focus on the effects of elevated temperature and acidity on the structure of heterotrophic bacterioplankton communities in the Salish Sea. Only a few studies have been carried out in other similar marine ecosystems [17] [18] . Furthermore, there are few investigations linking shifts in community structure to changes in the metabolism and ecological function of these important microorganism as a result of warmer and more acidified conditions [21] [25] [26] . In this study, temperature had little detectable effects on the structure of heterotrophic bacterioplankton communities taken from the Salish Sea. However, acidified conditions caused shifts in the structure of these bacterioplankton communities. In addition to the observable changes in dominance and composition, lowered pH also reduced richness and overall structure of manipulated communities. These changes in the structure and diversity of bacterioplankton communities correlated with significant changes in their overall metabolic activity. Bacterial production rates decreased, while bacterial respiration increased under lower pH conditions. These findings suggest that the ecological function of heterotrophic bacterioplankton communities in the ocean will potentially be affected by the acidified conditions that are predicted for the next century. Changes in the structure and metabolism of bacterioplankton communities have been shown to affect their ecological function [16] [33] . Based on the observations made in this study, in a more acidified ocean the efficiency of biological processes mediated by heterotrophic bacterioplankton may be reduced as less organics are cycled through bacterial production and more carbon is lost to respiration. Such alterations to the ecological function of heterotrophic bacterioplankton communities could have far reaching consequences for marine trophic interactions as well as the cycling and sequestration of carbon in the oceans. Results from the handful of previous investigations on the response of bacterioplankton communities to the effects of global climate change and ocean acidification are varying and are sometimes contradictory, suggesting that this area of research is still at its infancy. As such, further research in this area is necessary and should focus on drawing strong connections between the structure and function of these ecologically important organisms. Nonetheless, the results from this study highlight the ability of heterotrophic bacterioplankton to respond to ocean acidification both structurally and metabolically, which will have significant implications for their ecological function in the marine carbon cycle and the ocean’s response to global climate change.
Acknowledgements
The authors would like to thank Drs. Brooke Love and Brady Olson, and the Ocean Acidification Lab at Shannon Point Marine Center (SPMC) for their help and expertise in CO2 equilibration and experimentation, as well as the staff at SPMC and members of the Biology stockroom at Western Washington University (WWU) especially Peter Thut and Gene McKeen for providing laboratory space and logistical assistance. We would also like to acknowledge NSF grants OCE 0961229 and OCE 1220664 for providing funds used in the construct SPMC’s ocean acidification system. Special thanks to Sean McAllister for his assistance with data analysis and thoughtful input aiding in the completion of this project. We are grateful to Forrest Callaghan, Sarah Delands and Hannah Clarke for their help with data collection during their SPMC summer internships. Most of all, we are grateful to Kevin Hager, Mark Price (lab mates), and Dr. Dietmar Schwarz (thesis committee) for their help and support, without which this project could not be possible. This project was funded in part by WWU’s Office of Research and Sponsored Programs, Biology Alumni Student Research Fellowship, and Biology Department Graduate Committee and Chair Funds. We also like to thank the June and Charles Ross Graduate Scholarship (WWU Biology) for support during this project.
References
- Pachauri, R.K. and Reisinger, A. (Eds.) (2008) Climate Change 2007. Synthesis Report. Contribution of Working Groups I, II and III to the Fourth Assessment Report. Cambridge University Press, Cambridge.
- Doney, S.C., Fabry, V.J., Feely, R.A. and Kleypas, J.A. (2009) Ocean Acidification: The Other CO2 Problem. Annual Review of Marine Science, 1, 169-192. http://dx.doi.org/10.1146/annurev.marine.010908.163834
- Doney, S.C., Balch, W.M., Fabry, V.J. and Feely, R.A. (2009) Ocean Acidification: A Critical Emerging Problem for the Ocean Sciences. Oceanography, 22, 16-25. http://dx.doi.org/10.5670/oceanog.2009.93
- Caldeira, K. and Wickett, M.E. (2003) Oceanography: Anthropogenic Carbon and Ocean pH. Nature, 425, 365. http://dx.doi.org/10.1038/425365a
- Hobbie, J.E., Daley, R.J. and Jasper, S. (1977) Use of Nuclepore Filters for Counting Bacteria by Fluorescence Microscopy. Applied and Environmental Microbiology, 33, 1225-1228.
- Pomerory, L.R. (1974) The Ocean’s Food Web, a Changing Paradigm. BioScience, 24, 499-504. http://dx.doi.org/10.2307/1296885
- Robinson, C. and Williams, P.J.L.B. (2005) Respiration and Its Measurement in Surface Marine Waters. In: del Giorgio, P.A. and Williams, P.J.L.B., Eds., Respiration in Aquatic Ecosystems, Oxford University Press, Oxford, 147-180.
- Bidle, K.D. and Azam, F. (2001) Bacterial Control of Silicon Regeneration from Diatom Detritus: Significance of Bacterial Ectohydrolases and Species Identity. Limnology and Oceanography, 46, 1606-1623. http://dx.doi.org/10.4319/lo.2001.46.7.1606
- Kirchman, D.L. (1994) The Uptake of Inorganic Nutrients by Heterotrophic Bacteria. Microbial Ecology, 28, 255-271. http://dx.doi.org/10.1007/BF00166816
- Kirchman, D.L. (2012) Processes in Microbial Ecology. Oxford University Press, Oxford.
- del Giorgio, P.A. and Duarte, C.M. (2002) Respiration in the Open Ocean. Nature, 420, 379-384. http://dx.doi.org/10.1038/nature01165
- Azam, F., Fenchel, T., Field, J.G., Gray, J.S., Meyer-Reil, L.A. and Thingstad, F. (1983) The Ecological Role of Water-Column Microbes in the Sea. Marine Ecology-Progress Series, 10, 257-263. http://dx.doi.org/10.3354/meps010257
- Longhurst, A.R. and Harrison, W.G. (1989) The Biological Pump: Profiles of Plankton Production and Consumption in the Upper Ocean. Progress in Oceanography, 22, 47-123. http://dx.doi.org/10.1016/0079-6611(89)90010-4
- Siegenthaler, U. and Sarmiento, J.L. (1993) Atmospheric Carbon Dioxide and the Ocean. Nature, 365, 119-125. http://dx.doi.org/10.1038/365119a0
- Joint, I., Karl, D.M., Doney, S.C., Armbrust, E.V., Balch, W., Berman, M., Bowler, C., Church, M., Dickson, A., Heidelberg, J., Iglesias-Rodriguez, D., Kirchman, D., Kolber, Z.S., Letelier, R., Lupp, C., Maberly, S., Park, S., Raven, J., Repeta, D.J., Riebesell, U., Steward, G., Tortell, P., Zeebe, R.E. and Zehr, J.P. (2009) Consequences of High CO2 and Ocean Acidification for Microbes in the Global Ocean. University of Hawaii, Honolulu.
- Fuhrman, J.A. (2009) Microbial Community Structure and Its Functional Implications. Nature, 459, 193-199. http://dx.doi.org/10.1038/nature08058
- Joint, I., Doney, S.C. and Karl, D.M. (2011) Will Ocean Acidification Affect Marine Microbes. The ISME Journal, 5, 1-7. http://dx.doi.org/10.1038/ismej.2010.79
- Liu, J., Weinbauer, M.G., Maier, C., Dai, M. and Gattuso, J.P. (2010) Effect of Ocean Acidification on Microbial Diversity and on Microbe-Driven Biogeochemistry and Ecosystem Functioning. Aquatic Microbial Ecology, 61, 291-305. http://dx.doi.org/10.3354/ame01446
- Grossart, H.P., Allgaier, M., Passow, U. and Riebesell, U. (2006) Testing the Effect of CO2 Concentration on Dynamics of Marine Heterotrophic Bacterioplankton. Limnology and Oceanography, 51, 1-11. http://dx.doi.org/10.4319/lo.2006.51.1.0001
- Allgaier, M., Riebesell, U., Vogt, M., Thyrhaug, R. and Grossart, H.P. (2008) Coupling of Heterotrophic Bacteria to Phytoplankton Bloom Development at Different pCO2 Levels: A Mesocosm Study. Biogeosciences, 5, 1007-1022. http://dx.doi.org/10.5194/bg-5-1007-2008
- Lidbury, I., Johnson, V., Hall-Spencer, J.M., Munn, C.B. and Cunliffe, M. (2012) Community-Level Response of Coastal Microbial Biofilms to Ocean Acidification in a Natural Carbon Dioxide Vent Ecosystem. Marine Pollution Bulletin, 64, 1063-1066. http://dx.doi.org/10.1016/j.marpolbul.2012.02.011
- Zhang, R., Xia, X., Lau, S.C.K., Motegi, C., Weinbauer, M.G. and Jiao, N. (2013) Response of Bacterioplankton Community Structure to an Artificial Gradient of pCO2 in the Arctic Ocean. Biogeosciences, 10, 3679-3689. http://dx.doi.org/10.5194/bg-10-3679-2013
- Engebretson, J.J. and Moyer, C.L. (2003) Fidelity of Select Restriction Endonucleases in Determining Microbial Diversity by Terminal-Restriction Fragment Length Polymorphism. Applied and Environmental Microbiology, 69, 4823- 4829. http://dx.doi.org/10.1128/AEM.69.8.4823-4829.2003
- Ray, J.L., Töpper, B., An, S., Silyakova, A., Spindelböck, J., Thyrhaug, R., Dubow, M.S., Thingstad, T.F. and Sandaa, R.A. (2012) Effect of Increased pCO2 on Bacterial Assemblage Shifts in Response to Glucose Addition in Fram Strait Seawater Mesocosms. FEMS Microbiology Ecology, 82, 713-723. http://dx.doi.org/10.1111/j.1574-6941.2012.01443.x
- Riebesell, U., Schulz, K.G., Bellerby, R.G.J., Botros, M., Fritsche, P., Meyerhöfer, M., Neill, C., Nondal, G., Oschlies, A., Wohlers, J. and Zöllner, E. (2007) Enhanced Biological Carbon Consumption in a High CO2 Ocean. Nature, 450, 545-548. http://dx.doi.org/10.1038/nature06267
- Teira, E., Fernández, A., Álvarez-Salgado, X.A., García-Martín, E.E., Serret, P. and Sobrino, C. (2012) Response of Two Marine Bacterial Isolates to High CO2 Concentration. Marine Ecology Progress Series, 453, 27-36. http://dx.doi.org/10.3354/meps09644
- Borges, A.V., Delille, B. and Frankignoulle, M. (2005) Budgeting Sinks and Sources of CO2 in the Coastal Ocean: Diversity of Ecosystems Counts. Geophysical Research Letters, 32, Published Online. http://dx.doi.org/10.1029/2005gl023053
- Delille, B., Harlay, J., Zondervan, I., Jacquet, S., Chou, L., Wollast, R., Bellerby, R.G.J., Frankignoulle, M., Borges, A.V., Riebesell, U. and Gattuso, J.P. (2005) Response of Primary Production and Calcification to Changes of pCO2 during Experimental Blooms of the Coccolithophorid Emiliania huxleyi. Global Biogeochemical Cycles, 19, Published Online. http://dx.doi.org/10.1029/2004GB002318
- Mari, X. (2008) Does Ocean Acidification Induce an Upward Flux of Marine Aggregates? Biogeosciences, 5, 1023- 1031. http://dx.doi.org/10.5194/bg-5-1023-2008
- Piontek, J., Borchard, C., Sperling, M., Schulz, K.G., Riebesell, U. and Engel, A. (2013) Response of Bacterioplankton Activity in an Arctic Fjord System to Elevated pCO2: Results from a Mesocosm Perturbation Study. Biogeosciences, 10, 297-314. http://dx.doi.org/10.5194/bg-10-297-2013
- Piontek, J., Lunau, M., Handel, N., Borchard, C., Wurst, M. and Engel, A. (2010) Acidification Increases Microbial Polysaccharide Degradation in the Ocean. Biogeosciences, 7, 1615-1624. http://dx.doi.org/10.5194/bg-7-1615-2010
- Apple, J.K., Del Giorgio, P.A. and Kemp, M.W. (2006) Temperature Regulation of Bacterial Production, Respiration, and Growth Efficiency in a Temperate Salt-Marsh Estuary. Aquatic Microbial Ecology, 43, 243-254. http://dx.doi.org/10.3354/ame043243
- del Giorgio, P.A. and Bouvier, T.C. (2002) Linking the Physiologic and Phylogenetic Successions in Free-Living Bacterial Communities along an Estuarine Salinity Gradient. Limnology and Oceanography, 47, 471-486. http://dx.doi.org/10.4319/lo.2002.47.2.0471
- Riebesell, U., Fabry, V.J., Hansson, L. and Gattuso, J.P. (2010) Guide to Best Practices for Ocean Acidification Research and Data Reporting. Publications Office of the EU, Luxembourg, 258.
- Lewis, E., Wallace, D. and Allison, L.J. (1998) Program Developed for CO2 System Calculations. Carbon Dioxide Information Analysis Center, Managed by Lockheed Martin Energy Research Corporation for the U.S. Department of Energy, 38.
- Häne, B.G., Jäger, K. and Drexler, H.G. (1993) The Pearson Product-Moment Correlation Coefficient is Better Suited for Identification of DNA Fingerprint Profiles Than Band Matching Algorithms. Electrophoresis, 14, 967-972. http://dx.doi.org/10.1002/elps.11501401154
- Clarke, K.R. and Gorley, R.N. (2006) PRIMER v6. Plymouth Marine Laboratory, Plymouth.
- Lane, D.J. (1991) 16S/23S rRNA Sequencing. In: Stackebrandt, E. and Goodfellow, M., Eds., Nucleic Acid Techniques in Bacterial Systematics, John Wiley & Sons Ltd., Chichester, 115-175.
- Pruesse, E., Quast, C., Knittel, K., Fuchs, B.M., Ludwig, W., Peplies, J. and Glöckner, F.O. (2007) SILVA: A Comprehensive Online Resource for Quality Checked and Aligned Ribosomal RNA Sequence Data Compatible with ARB. Nucleic Acids Research, 35, 7188-7196. http://dx.doi.org/10.1093/nar/gkm864
- Hall, T.A. (1999) BioEdit: A User-Friendly Biological Sequence Alignment Editor and Analysis Program for Windows 95/98/NT. Nucleic Acids Symposium Series, 41, 95-98.
- Schloss, P.D. and Handelsman, J. (2005) Introducing DOTUR, a Computer Program for Defining Operational Taxonomic Units and Estimating Species Richness. Applied and Environmental Microbiology, 71, 1501-1506. http://dx.doi.org/10.1128/AEM.71.3.1501-1506.2005
- Mullins, T.D., Britschgi, T.B., Krest, R.L. and Giovannoni, S.J. (1995) Genetic Comparisons Reveal the Same Unknown Bacterial Lineages in Atlantic and Pacific Bacterioplankton Communities. Limnology and Oceanography, 40, 148-158. http://dx.doi.org/10.4319/lo.1995.40.1.0148
- Cole, J.R., Wang, Q., Cardenas, E., Fish, J., Chai, B., Farris, R.J., Kulam-Syed-Mohideen, A.S., McGarrell, D.M., Marsh, T., Garrity, G.M. and Tiedje, J.M. (2009) The Ribosomal Database Project: Improved Alignments and New Tools for rRNA Analysis. Nucleic Acids Research, 37, D141-D145. http://dx.doi.org/10.1093/nar/gkn879
- Ashelford, K.E., Chuzhanova, N.A., Fry, J.C., Jones, A.J. and Weightman, A.J. (2006) New Screening Software Shows That Most Recent Large 16S rRNA Gene Clone Libraries Contain Chimeras. Applied Environmental Microbiology, 72, 5734-5741. http://dx.doi.org/10.1128/AEM.00556-06
- Carignan, R., Blais, A.M. and Vis, C. (1998) Measurement of Primary Production and Community Respiration in Oligotrophic Lakes Using the Winkler Method. Canadian Journal of Fisheries and Aquatic Sciences, 55, 1078-1084. http://dx.doi.org/10.1139/f97-319
- Kirchman, D., K’nees, E. and Hodson, R. (1985) Leucine Incorporation and Its Potential as a Measure of Protein Synthesis by Bacteria in Natural Aquatic Systems. Applied and Environmental Microbiology, 49, 599-607.
- Newbold, L.K., Oliver, A.E., Booth, T., Tiwari, B., Desantis, T., Maguire, M. andersen, G., van der Gast, C.J. and Whiteley, A.S. (2012) The Response of Marine Picoplankton to Ocean Acidification. Environmental Microbiology, 14, 2293-2307. http://dx.doi.org/10.1111/j.1462-2920.2012.02762.x
- Sperling, M., Piontek, J., Gerdts, G., Wichels, A., Schunck, H., Roy, A.S., La Roche, J., Gilbert, J., Nissimov, J.I., Bittner, L., Romac, S., Riebesell, U. and Engel, A. (2013) Effect of Elevated CO2 on the Dynamics of Particle-Attached and Free Living Bacterioplankton Communities in an Arctic Fjord. Biogeosciences, 10, 181-191. http://dx.doi.org/10.5194/bg-10-181-2013
- Arnosti, C., Grossart, H.P., Mühling, M., Joint, I. and Passow, U. (2011) Dynamics of Extracellular Enzyme Activities in Seawater under Changed Atmospheric pCO2: A Mesocosm Investigation. Aquatic Microbial Ecology, 64, 285-298. http://dx.doi.org/10.3354/ame01522
- Tortell, P.D., Ditullio, G.R., Sigman, D.M. and Morel, F.M.M. (2002) CO2 Effects on Taxonomic Composition and Nutrient Utilization in an Equatorial Pacific Phytoplankton Assemblage. Marine Ecology Progress Series, 236, 37-43. http://dx.doi.org/10.3354/meps236037
- Witt, V., Wild, C., Anthony, K.R.N., Diaz-Pulido, G. and Uthicke, S. (2011) Effects of Ocean Acidification on Microbial Community Composition of, and Oxygen Fluxes through, Biofilms from the Great Barrier Reef. Environmental Microbiology, 13, 2976-2989. http://dx.doi.org/10.1111/j.1462-2920.2011.02571.x
- Meakin, N.G. and Wyman, M. (2011) Rapid Shifts in Picoeukaryote Community Structure in Response to Ocean Acidification. The ISME Journal, 5, 1397-1405. http://dx.doi.org/10.1038/ismej.2011.18
- Morris, J.J., Lenski, R.E. and Zinser, E.R. (2012) The Black Queen Hypothesis: Evolution of Dependencies through Adaptive Gene Loss. mBio, 3, e00036-12. http://dx.doi.org/10.1128/mBio.00036-12
- Sogin, M.L., Morrison, H.G., Huber, J.A., Welch, D.M., Huse, S.M., Neal, P.R., Arrieta, J.M. and Herndl, G.J. (2006) Microbial Diversity in the Deep Sea and the Underexplored “Rare Biosphere”. Proceedings of the National Academy of Sciences of the United States of America, 103, 12115-12120. http://dx.doi.org/10.1073/pnas.0605127103
- DeLong, E.F., Preston, C.M., Mincer, T., Rich, V., Hallam, S.J., Frigaard, N.U., Martinez, A., Sullivan, M.B., Edwards, R., Brito, B.R., Chisholm, S.W. and Karl, D.M. (2006) Community Genomics among Stratified Microbial Assemblages in the Ocean’s Interior. Science, 311, 496-503. http://dx.doi.org/10.1126/science.1120250
- Moreno, E. (1998) Genome Evolution within the Alpha Proteobacteria: Why Do Some Bacteria Not Possess Plasmids and Others Exhibit More Than One Different Chromosome? FEMS Microbiology Reviews, 22, 255-275. http://dx.doi.org/10.1111/j.1574-6976.1998.tb00370.x
- Teeling, H., Fuchs, B.M., Becher, D., Klockow, C., Gardebrecht, A., Bennke, C.M., Kassabgy, M., Huang, S., Mann, A.J., Waldmann, J., Weber, M., Klindworth, A., Otto, A., Lange, J., Bernhardt, J., Reinsch, C., Hecker, M., Peplies, J., Bockelmann, F.D., Callies, U., Gerdts, G., Wichels, A., Wiltshire, K.H., Glöckner, F.O., Schweder, T. and Amann, R. (2012) Substrate-Controlled Succession of Marine Bacterioplankton Populations Induced by a Phytoplankton Bloom. Science, 336, 608-611. http://dx.doi.org/10.1126/science.1218344
- Imhoff, J.F., Trüper, H.G. and Pfennig, N. (1984) Rearrangement of the Species and Genera of the Phototrophic “Purple Nonsulfur Bacteria”. International Journal of Systematic Bacteriology, 34, 340-343. http://dx.doi.org/10.1099/00207713-34-3-340
- Brinkhoff, T., Giebel, H.A. and Simon, M. (2008) Diversity, Ecology, and Genomics of the Roseobacter Clade: A Short Overview. Archives of Microbiology, 189, 531-539. http://dx.doi.org/10.1007/s00203-008-0353-y
- Moran, M.A., Belas, R., Schell, M.A., González, J.M., Sun, F., Sun, S., Binder, B.J., Edmonds, J., Ye, W., Orcutt, B., Howard, E.C., Meile, C., Palefsky, W., Goesmann, A., Ren, Q., Paulsen, I., Ulrich, L.E., Thompson, L.S., Saunders, E. and Buchan, A. (2007) Ecological Genomics of Marine Roseobacters. Applied and Environmental Microbiology, 73, 4559-4569. http://dx.doi.org/10.1128/AEM.02580-06
- Newton, R.J., Griffin, L.E., Bowles, K.M., Meile, C., Gifford, S., Givens, C.E., Howard, E.C., King, E., Oakley, C.A., Reisch, C.R., Rinta-Kanto, J.M., Sharma, S., Sun, S., Varaljay, V., Vila-Costa, M., Westrich, J.R. and Moran, M.A. (2010) Genome Characteristics of a Generalist Marine Bacterial Lineage. The ISME Journal, 4, 784-798. http://dx.doi.org/10.1038/ismej.2009.150
- Yamada, N. and Suzumura, M. (2010) Effects of Seawater Acidification on Hydrolytic Enzyme Activities. Journal of Oceanography, 66, 233-241. http://dx.doi.org/10.1007/s10872-010-0021-0
- Yamada, N., Tsurushima, N. and Suzumura, M. (2010) Effects of Seawater Acidification by Ocean CO2 Sequestration on Bathypelagic Prokaryote Activities. Journal of Oceanography, 66, 571-580. http://dx.doi.org/10.1007/s10872-010-0047-3
- del Giorgio, P.A., Condon, R., Bouvier, T., Longnecker, K., Bouvier, C., Sherr, E. and Gasol, J.M. (2011) Coherent Patterns in Bacterial Growth, Growth Efficiency, and Leucine Metabolism along a Northeastern Pacific Inshore-Offshore Transect. Limnology and Oceanography, 56, 1-16. http://dx.doi.org/10.4319/lo.2011.56.1.0001
- Hall, E.K. and Cotner, J.B. (2007) Interactive Effect of Temperature and Resources on Carbon Cycling by Freshwater Bacterioplankton Communities. Aquatic Microbial Ecology, 49, 35-45.
- Vázquez-Domínguez, E., Vaqué, D. and Gasol, J.M. (2007) Ocean Warming Enhances Respiration and Carbon Demand of Coastal Microbial Plankton. Global Change Biology, 13, 1327-1334. http://dx.doi.org/10.1111/j.1365-2486.2007.01377.x
- Karl, D.M., Laws, E.A., Morris, P., Williams, P.J.L. and Emerson, S. (2003) Global Carbon Cycle (Communication Arising): Metabolic Balance of the Open Sea. Nature, 426, 32. http://dx.doi.org/10.1038/426032a
- Adams, H.E., Crump, B.C. and Kling, G.W. (2010) Temperature Controls on Aquatic Bacterial Production and Community Dynamics in Arctic Lakes and Streams. Environmental Microbiology, 12, 1319-1333. http://dx.doi.org/10.1111/j.1462-2920.2010.02176.x
- Dziallas, C. and Grossart, H.P. (2011) Temperature and Biotic Factors Influence Bacterial Communities Associated with the Cyanobacterium microcystis sp. Environmental Microbiology, 13, 1632-1641. http://dx.doi.org/10.1111/j.1462-2920.2011.02479.x
- Hall, E.K., Dzialowski, A.R., Stoxen, S.M. and Cotner, J.B. (2009) The Effect of Temperature on the Coupling between Phosphorus and Growth in Lacustrine Bacterioplankton Communities. Limnology and Oceanography, 54, 880- 889. http://dx.doi.org/10.4319/lo.2009.54.3.0880
- Lindh, M.V., Riemann, L., Baltar, F., Romero-Oliva, C., Salomon, P.S., Granéli, E. and Pinhassi, J. (2012) Consequences of Increased Temperature and Acidification on Bacterioplankton Community Composition during a Mesocosm Spring Bloom in the Baltic Sea. Environmental Microbiology Reports, 5, 252-262. http://dx.doi.org/10.1111/1758-2229.12009
- Pearce, D.A. (2005) The Structure and Stability of the Bacterioplankton Community in Antarctic Freshwater Lakes, Subject to Extremely Rapid Environmental Change. FEMS Microbiology Ecology, 53, 61-72. http://dx.doi.org/10.1016/j.femsec.2005.01.002
- Simon, M., Glöeckner, F.O. and Amann, R. (1999) Different Community Structure and Temperature Optima of Heterotrophic Picoplankton in Various Regions of the Southern Ocean. Aquatic Microbial Ecology, 18, 275-284. http://dx.doi.org/10.3354/ame018275
- Kana, T.M., Darkangelo, C., Hunt, M.D., Oldham, J.B., Bennett, G.E. and Cornwell, J.C. (1994) Membrane Inlet Mass Spectrometer for Rapid High-Precision Determination of N2, O2, and Ar in Environmental Water Samples. Analytical Chemistry, 66, 4166-4170. http://dx.doi.org/10.1021/ac00095a009
- Pomeroy, L.R. and Wiebe, W.J. (2001) Temperature and Substrates as Interactive Limiting Factors for Marine Heterotrophic Bacteria. Aquatic Microbial Ecology, 23, 187-204. http://dx.doi.org/10.3354/ame023187
- Reinthaler, T. and Herndl, G.J. (2005) Seasonal Dynamics of Bacterial Growth Efficiencies in Relation to Phytoplankton in the Southern North Sea. Aquatic Microbial Ecology, 39, 7-16. http://dx.doi.org/10.3354/ame039007
- Bellerby, R.G.J., Schulz, K.G., Riebesell, U., Neill, C., Nondal, G., Heegaard, E., Johannessen, T. and Brown, K.R. (2008) Marine Ecosystem Community Carbon and Nutrient Uptake Stoichiometry under Varying Ocean Acidification during the PeECE III Experiment. Biogeosciences, 5, 1517-1527. http://dx.doi.org/10.5194/bg-5-1517-2008
- Hutchins, D.A., Mulholland, M.R. and Fu, F. (2009) Nutrient Cycles and Marine Microbes in a CO2-Enriched Ocean. Oceanography, 22, 128-145. http://dx.doi.org/10.5670/oceanog.2009.103
- Losh, J.L., Morel, F.M.M. and Hopkinson, B.M. (2012) Modest Increase in the C:N Ratio of N-Limited Phytoplankton in the California Current in Response to High CO2. Marine Ecology Progress Series, 468, 31-42. http://dx.doi.org/10.3354/meps09981
- Apple, J.K. and del Giorgio, P.A. (2007) Organic Substrate Quality as the Link between Bacterioplankton Carbon Demand and Growth Efficiency in a Temperate Salt-Marsh Estuary. The ISME Journal, 1, 729-742. http://dx.doi.org/10.1038/ismej.2007.86
- Kirchman, D.L., Moran, X.A.G. and Ducklow, H. (2009) Microbial Growth in the Polar Oceans—Role of Temperature and Potential Impact of Climate Change. Nature Reviews Microbiology, 7, 451-459.
- Eiler, A., Langenheder, S., Bertilsson, S. and Tranvik, L.J. (2003) Heterotrophic Bacterial Growth Efficiency and Community Structure at Different Natural Organic Carbon Concentrations. Applied and Environmental Microbiology, 69, 3701-3709. http://dx.doi.org/10.1128/AEM.69.7.3701-3709.2003
- Finkel, Z.V., Beardall, J., Flynn, K.J., Quigg, A., Rees, T.A.V. and Raven, J.A. (2010) Phytoplankton in a Changing World: Cell Size and Elemental Stoichiometry. Journal of Plankton Research, 32, 119-137. http://dx.doi.org/10.1093/plankt/fbp098
- Riebesell, U., Körtzinger, A. and Oschlies, A. (2009) Sensitivities of Marine Carbon Fluxes to Ocean Change. Proceedings of the National Academy of Sciences of the United States of America, 106, 20602-20609. http://dx.doi.org/10.1073/pnas.0813291106
- Harley, C.D.G., Hughes, A.R., Hultgren, K.M., Miner, B.G., Sorte, C.J.B., Thornber, C.S., Rodriguez, L.F., Tomanek, L. and Williams, S.L. (2006) The Impacts of Climate Change in Coastal Marine Systems. Ecology Letters, 9, 228-241. http://dx.doi.org/10.1111/j.1461-0248.2005.00871.x
- Cai, W.J., Hu, X., Huang, W.J., Murrell, M.C., Lehrter, J.C., Lohrenz, S.E., Chou, W.C., Zhai, W., Hollibaugh, J.T., Wang, Y., Zhao, P., Guo, X., Gundersen, K., Dai, M. and Gong, G.C. (2011) Acidification of Subsurface Coastal Waters Enhanced by Eutrophication. Nature Geoscience, 4, 766-770. http://dx.doi.org/10.1038/ngeo1297
- Feely, R.A., Alin, S.R., Newton, J., Sabine, C.L., Warner, M., Devol, A., Krembs, C. and Maloy, C. (2010) The Combined Effects of Ocean Acidification, Mixing, and Respiration on pH and Carbonate Saturation in an Urbanized Estuary. Estuarine, Coastal and Shelf Science, 88, 442-449. http://dx.doi.org/10.1016/j.ecss.2010.05.004
- Mucci, A., Starr, M., Gilbert, D. and Sundby, B. (2011) Acidification of Lower St. Lawrence Estuary Bottom Waters. Atmosphere-Ocean, 49, 206-218.
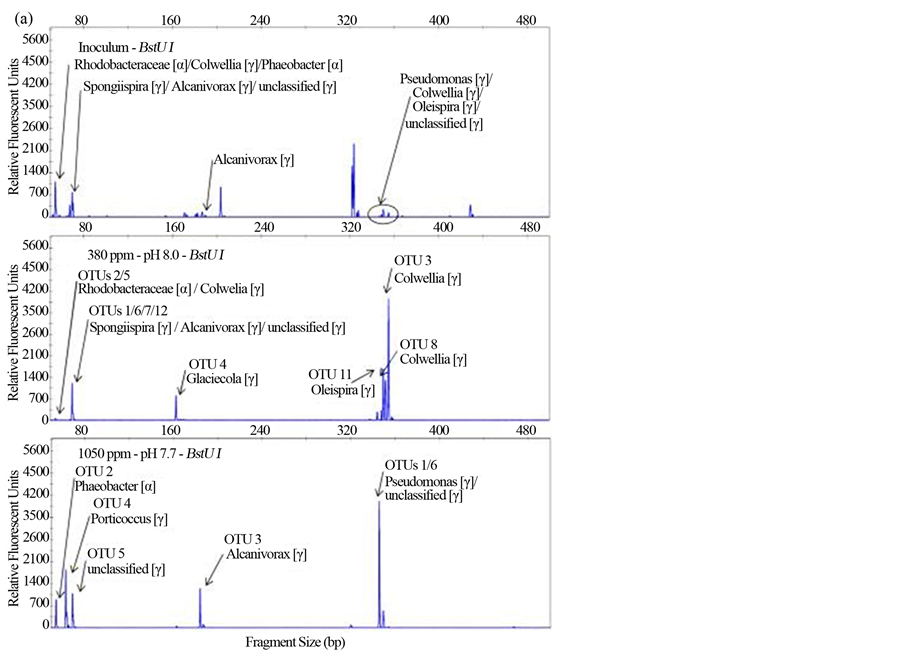
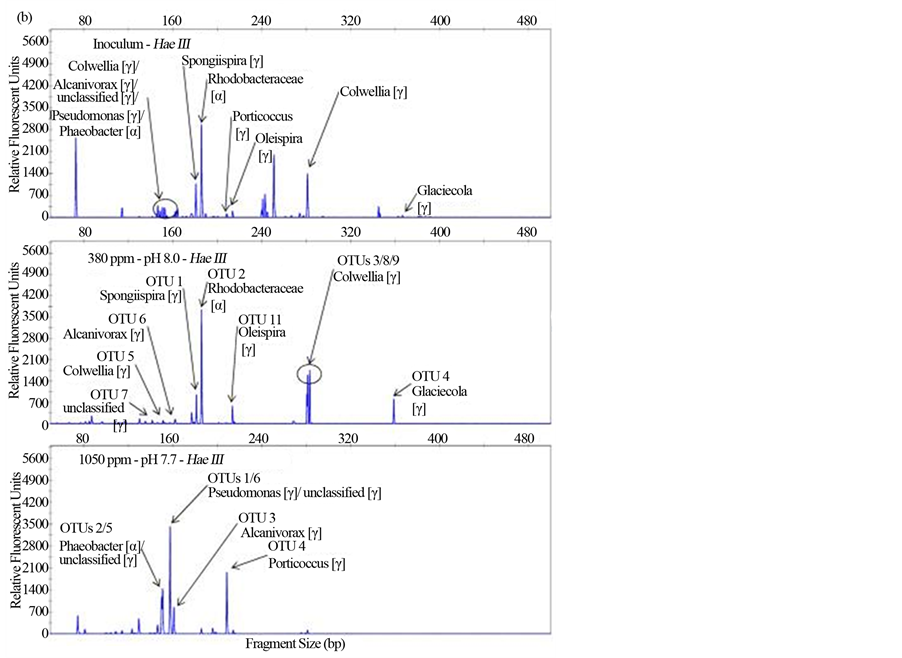
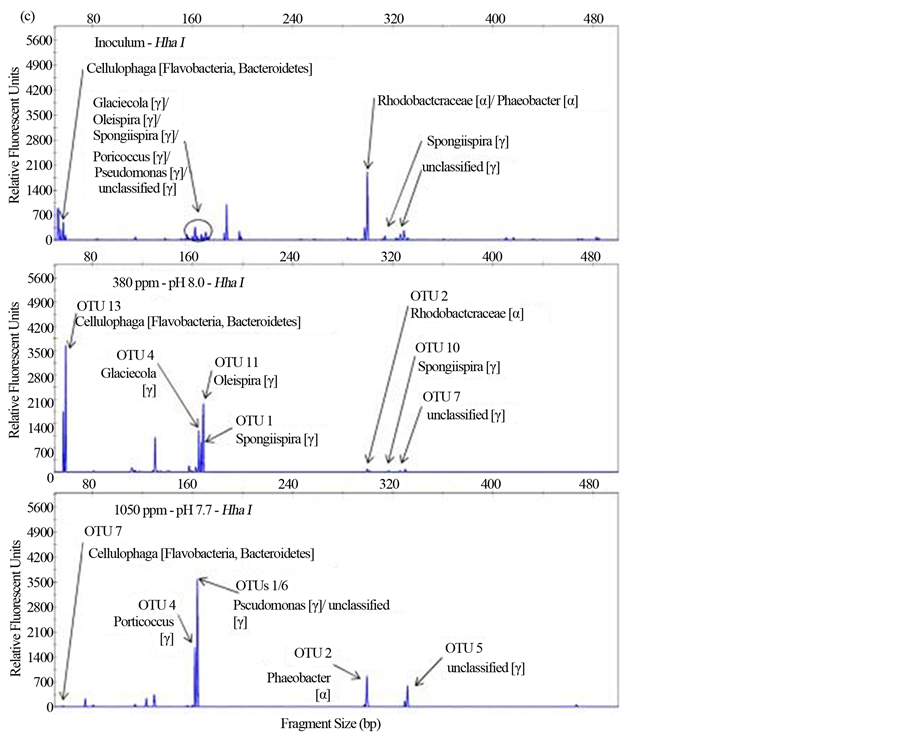
Figure S1. Terminal-restriction fragment length polymorphism (T-RFLP) electropherograms showing BstUI (a), HaeIII (b) and HhaI (c) digests for the samples (from top to bottom) Inoculum, 380 ppm, and 1050 ppm. Clone libraries were only constructed for experimental samples (380 ppm and 1050 ppm). Arrows indicate peaks corresponding to OTUs detected in each clone library with associated Ribosomal Database Project (RDP) matches.
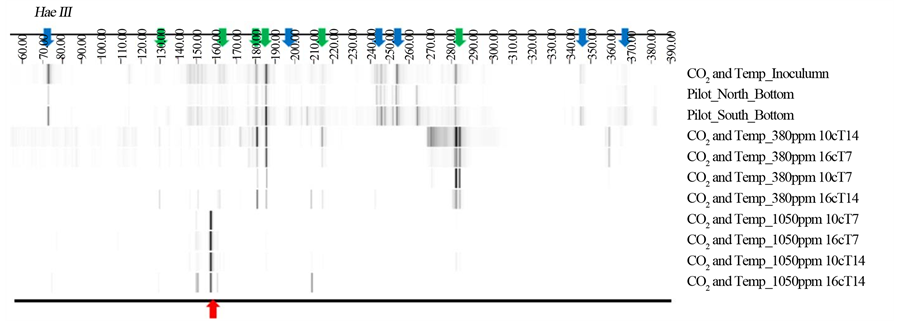
Figure S2. Bacterial T-RFLP data from three environmental samples, as well as eight CO2 and temperature experiment samples by the restriction enzyme HaeIII. Colored arrows indicate T-RFs from both environmental communities and communities associated with lower pCO2 concentrations(Green), communities associated with higher pCO2 concentrations (Red), and those of unculturable bacterial from environmental communities (Blue).
NOTES

*Corresponding author.