Open Journal of Molecular and Integrative Physiology
Vol.3 No.2(2013), Article ID:31300,7 pages DOI:10.4236/ojmip.2013.32009
A new geometrical and mechanical relation in the respiratory system with airflow limitation—From the perspective of analytical respiratory mechanics
![]()
Respiratory Division, Department of Internal Medicine, Itami City Hospital, Itami, Japan
Email: in1007@poh.osaka-med.ac.jp
Copyright © 2013 Kyongyob Min. This is an open access article distributed under the Creative Commons Attribution License, which permits unrestricted use, distribution, and reproduction in any medium, provided the original work is properly cited.
Received 2 March 2013; revised 6 April 2013; accepted 15 April 2013
Keywords: Secondary Pulmonary Lobule; Analytical Mechanics; Airflow Limitation; Flow-Volume Trajectory; Regional Air-Trapping
ABSTRACT
Classic respiratory mechanics is a branch of vectorial mechanics, which aims to recognize all forces acting on the respiratory system. Another branch of mechanics, analytical mechanics, has been used for analyzing the motions of complicated systems with constraints through equilibrium among scalar quantities such as kinetic energy and potential energy. However, until now, there have not been any studies concerning about analytical respiratory mechanics. In this paper, the author has obtained two types of motion equations (linear and nonlinear) for the airflow limitation from formulation of the analytical respiratory mechanics. Reconstructed flow-volume trajectories of the linear equation revealed a new relationship among the slope of the linear portion of trajectory, the coefficient of the dissipation function and the coefficient of the potential function. Reconstructed trajectories of the nonlinear equation suggested that a curved flow-volume trajectory would be caused by the emergence of regional hypoventilated clusters with airtrapped lobules. In conclusion, analytical respiratory mechanics will provide the basis for analyzing the mechanical properties of the respiratory system concerning pulmonary functional images made by newly developed technologies.
1. INTRODUCTION
Since Newton laid the solid foundation of dynamics by formulating the laws of motion, the science of mechanics has developed along two main lines. One branch, which we shall call vectorial mechanics, starts directly from Newton’s laws of motion. It aims at recognizing all the forces acting on any given particle, its motion being uniquely determined by the known forces acting on it at every instant. The analysis and synthesis of forces and moments is thus the basic concern of vectorial mechanics [1]. Classic respiratory mechanics has been established as a branch of vectorial mechanics.
While in Newton’s mechanics the action of a force is measured by the momentum produced by that force, Liebniz advocated another quantity, kinetic energy, as the proper gauge for dynamical action of a force. Leibniz replaced the momentum of Newton with kinetic energy, and replaced the force of Newton with the work of force or the work function. Leibniz is the originator of the second branch of mechanics which usually called analytical mechanics, which bases the entire study of equilibrium and motion on two fundamental scalar quantities, kinetic energy and work function (this is frequently replaceable by the potential energy) [1]. The energy theorem, which states that the sum of kinetic and potential energies remains unchanged during the motion, yields only one equation.
We encounter problems of mechanics for which the work function is a function not only of the position of particles but also of the time. For such systems, the law of conservation of energy does not hold. Hamilton has introduced a new formulation of the principle of least action asserting that the actual motion realized in nature is that particular motion for which the action (the time-integral of the difference between the kinetic and potential energies) assumes its smallest value. In the case of mechanical systems composed of two or more particles, two or three fundamental scalars contain the complete dynamics of even the most complicated system, provided that they are used as the basis of a principle [1].
It has generally been accepted that the secondary pulmonary lobule (SPL) is a fundamental unit of lung structure and function [2,3]. A pulmonary lobe is composed of a large number of SPLs, which a single bronchial tree integrates to the whole lung as a complicated system. Recent rapid progress in new technologies concerning pulmonary functional images has displayed regional and temporal functional images of the lung in vivo, which should be recognized as the complicated system of a large number of SPLs [2-4]. Thus, it is now demanded that physiologists reconstruct analytical respiratory mechanics based on SPLs in place of the classical vectorial, which will help us to accurately understand new pulmonary functional images produced by new technologies.
In this paper the author has reconstructed flow-volume trajectories of the airflow limitation by using the method of analytical mechanics. Reconstructed trajectories have revealed a new relationship among mechanical properties of the respiratory system in airflow limitation, and suggested a close relationship between the shapes of flowvolume trajectories and the emerged regional air-trapping in the lung.
2. ANALYTICAL RESPIRATORY MECHANICS
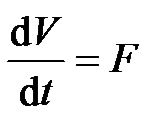
2.1. Volume Variable, V
From the viewpoint of the secondary pulmonary lobule (SPL), the terminal branch of the bronchial tree should be the lobular bronchiole because each SPL is supplied by a single lobular bronchiole of about 1 mm in diameter [2,3]. The lung is composed of a large number (N) of SPLs by integration of the single fractal bronchial tree [4]. Thus, the volume variable (V [L]) of a respiratory system is a function of lobular volume variables ;
; . During breathing, the volume variable of the respiratory system makes a trajectory in the space of the lobular volume variables.
2.2. Flow Variable, F
Air inflow or outflow of an SPL is supplied by a single corresponding lobular bronchiole, and during breathing one would be able to see a flow  in each lobular bronchiole. A spirometry system measures airflow F [L/sec] at the mouth of the subject. The variable F is defined as a function of lobular flow variables;
 .
.
2.3. Energy Functions of Respiratory System in Motion
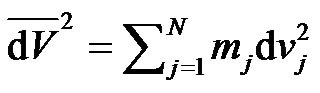
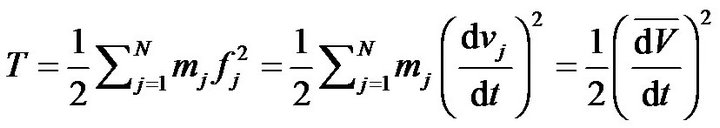
When an inertial quantity of mass (mj) was given to each lobule, the kinetic energy T was defined as follows,
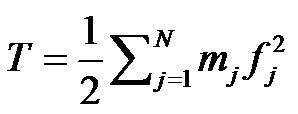 (1)
(1)
When a work function 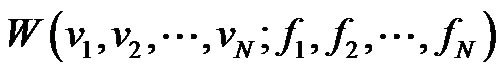 was given, the potential energy U was defined as the following,
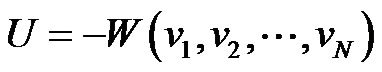
 (2)
(2)
The respiratory system in motion is a dissipative system. After introduction of Rayleigh’s dissipation function, the dissipation of energy in the system was defined by the dissipation function D as follows,
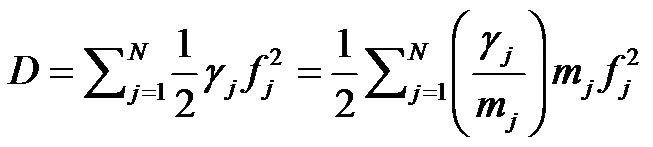 (3)
(3)
The parameters  indicate dissipation coefficients distributed to every flow variables of the system.
2.4. Motion Equations of Respiratory System in Motion
The analytical mechanics is based on the principle of least action for actual motions of the system [1]. The characteristic quantity of action is the time-integral of the difference between the kinetic and potential energies . By use of the least action of
  and D, one obtained a set of motion equations for the respiratory system in motion as follows [1].
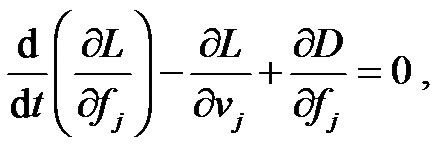 (4)
(4)
where j is .
.
3. A MOTION EQUATION FOR THE RESPIRATORY SYSTEM IN A STATE OF AIRFLOW LIMITATION
3.1. Kinetic Energy, T(F)
The volume variable V is defined as a moving point in the space of . During breathing, one would obtain a trajectory of the moving point in the space. According to Riemann geometry, the infinitesimal distance between two points on the trajectory or the line element
  was expressed by the following equation [1],
 (5)
(5)
By use of Eqs.1 and 5, the kinetic energy T was defined as follows
 (6)
(6)
When  was measured as flow variable F by the spirometry system, the kinetic energy
  was defined on the flow-volume plane by the following,
 (7)
(7)
3.2. Potential Energy, U(V)
On the flow-volume plane, one can see two particular states of the respiratory system by use of geometrical patterns of flow-volume trajectories: a stable state of resting breathing or a critical state of airflow limitation (Figure 1). Geometrical patterns of the forced expiratory flow-volume (FEFV) trajectories around the point of forced end-expiration have suggested that the point of residual volume (RV) is a stable equilibrium point in terms of a dynamical system [5]. Around the point of stable equilibrium, the potential function U(V) was expressed as the first approximation by the following,
 (8)
(8)
where the volume variable V was measured from RV (thus, V is zero or a negative value), and the parameter ω is a potential coefficient of the respiratory system.
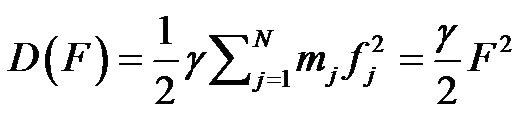
3.3. Energy Dissipation, D(F)
It is well known that choked flows are independent from expiratory efforts of the subject [6]. Therefore, we adopted the assumption that distributed dissipation coefficients  of Eq.3 would be fixed to a single value
  during the state of airflow-limitation [7] (Figure 2). The energy dissipation of the system in the state of airflow-limitation was defined by the dissipation function D(F),
 (9)
(9)
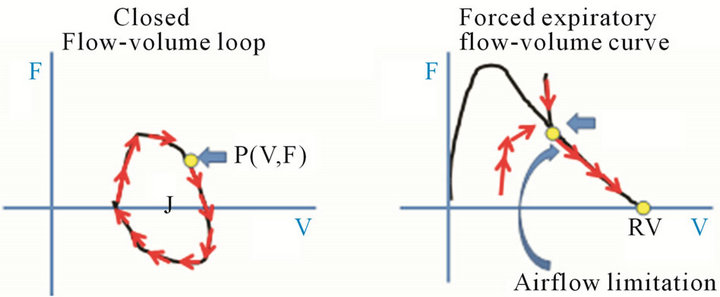
Figure 1. Typical two patterns of flow-volume curves: a periodic loop of spontaneous breathing, and a maximal forced expiratory flow-volume (MEFV) curve. A moving point representing the subject moves along the typical curves. Each arrow in red denotes the moving velocity of point. Note that in the MEFV curve the moving point approaches the residual volume (RV) point along the line of airflow-limitation while slowing down its moving velocity. The RV point seems to be the stable equilibrium point of the respiratory dynamical system in the forced expiratory motion.
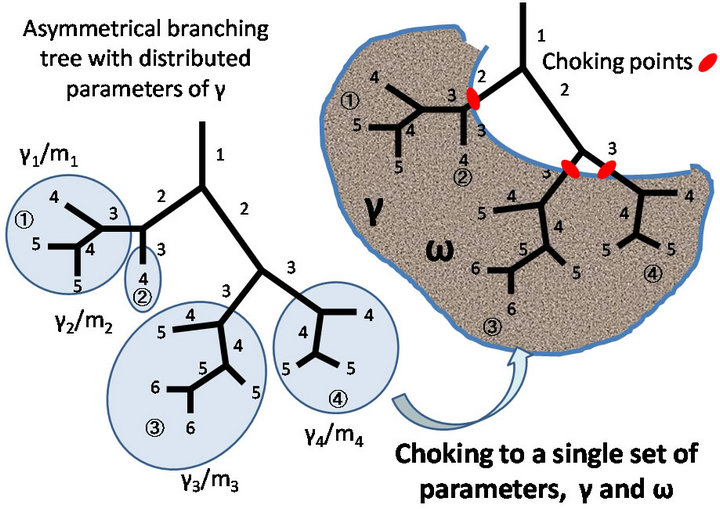
Figure 2. Distributed properties  of the respiratory system are fixed to a single set of mechanical values (γ and ω) during airflow limitation. Each number in the bronchial tree is the Weibel’s generation of corresponding bronchial branch.
3.4. Motion Equations of Airflow Limitation
By use of Eqs.7-9, from Eq.4 we obtained the ordinary differential equations for the state of airflow limitation as follows,
 (10a)
(10a)
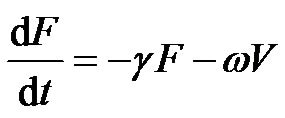 (10b)
(10b)
4. RECONSTRUCTED FLOW-VOLUME TRAJECTORIES OF AIRFLOW LIMITATION
4.1. Straight Patterns of Reconstructed Flow-Volume Trajectories
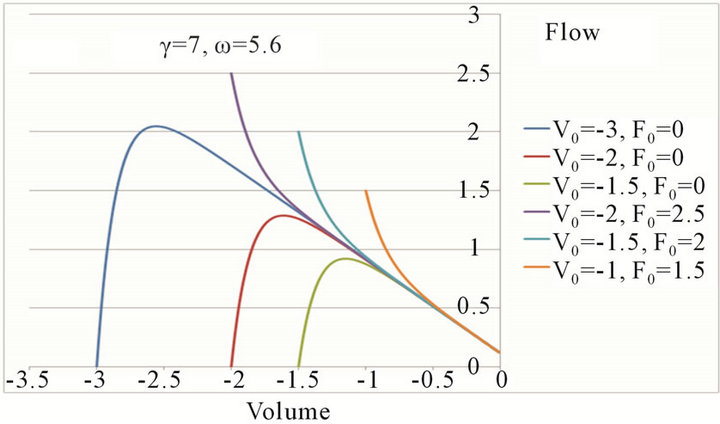
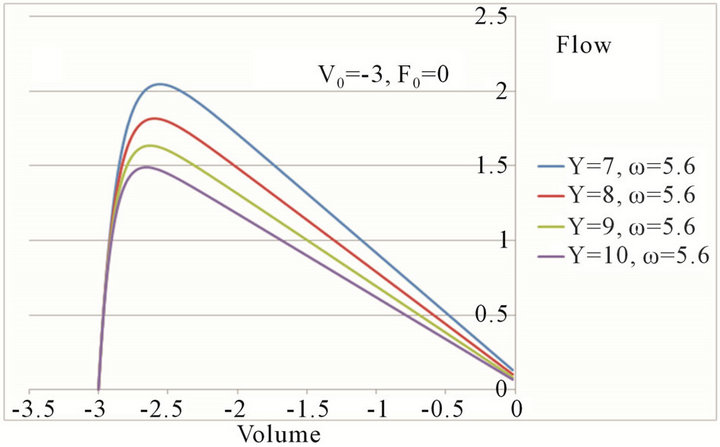
Reconstructed flow-volume trajectories from several initial values of V and F by numerical solutions of Eq. 10 with the midpoint method (see Appendix) were drawn in Figure 3(a). These reconstructed trajectories showed a common straight trajectory in their descending legs. The slope of straight trajectory ![]() was dependent on parameters of
was dependent on parameters of  and
and![]() ; the higher the parameter
; the higher the parameter  was or the lower the parameter
 ![]() was, the flatter the trajectory became (Figures 4(a) and (b)).
was, the flatter the trajectory became (Figures 4(a) and (b)).
The straight trajectory seemed to have the property of the descending leg of the maximal expiratory flowvolume (MEFV) curve. Theoretical analysis of the linear ordinary differential equations of Eq.10 has shown that the straight trajectory has a specified slope ![]() which must satisfy the following equation, [5]
which must satisfy the following equation, [5]
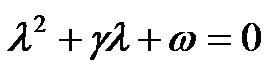 (11)
(11)
As the slope ![]() is a real number, the relation of
is a real number, the relation of 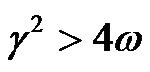 is necessary.
 (a)
(a)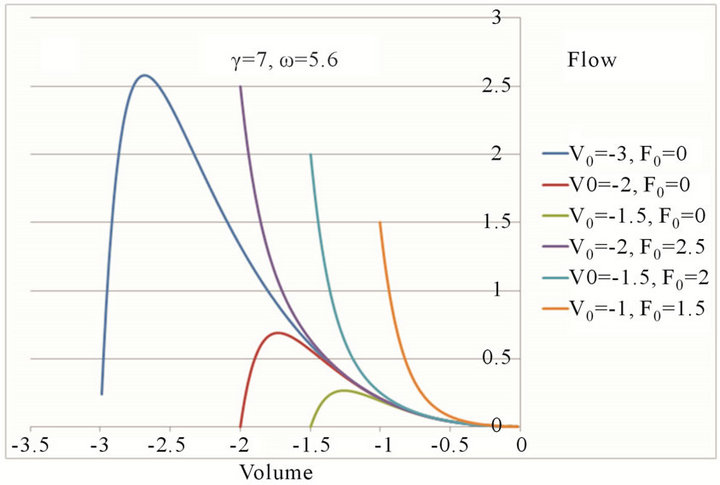 (b)
(b)
Figure 3. Reconstructed flow-volume trajectories of motion equations. (a) Reconstructed flow-volume trajectories according to the linear motion equation of Eq.10. Six sets of initial values were given. Note that the latter part of the trajectory indicates the existence of a straight line seen often in the maximal expiratory flow-volume (MEFV) curves of normal subjects; (b) Reconstructed flow-volume trajectories according to the nonlinear motion equation of Eq.13. Curved trajectories of convexity below were drawn.
4.2. Curved Patterns of Reconstructed Flow-Volume Trajectories
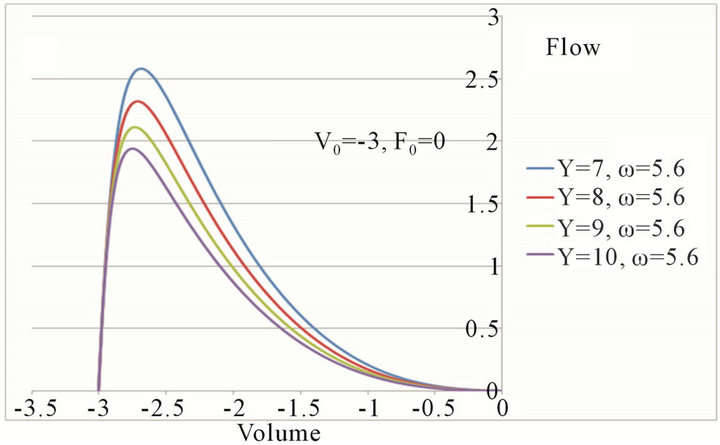
Forced expiratory flow-volume (FEFV) curves often approach the point of RV as the tangent of the volume axis. This phenomenon always accompanies curving transformation of FEFV curves. Eq.10 always reproduced a straight trajectory, but never a curved one (Figures 4(a) and (b)). A curved trajectory was reproduced only when the potential function U(V) was defined by a higher approximation of U around the stable equilibrium point of zero as follows (Figures 3(b), 5(a) and (b)),
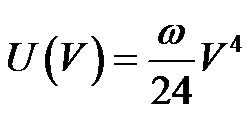 (12)
(12)
Therefore, the motion equation for a curved MEFV trajectory approaching tangent to RV was obtained as follows,
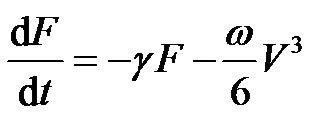 (13)
(13)
 (a)
(a)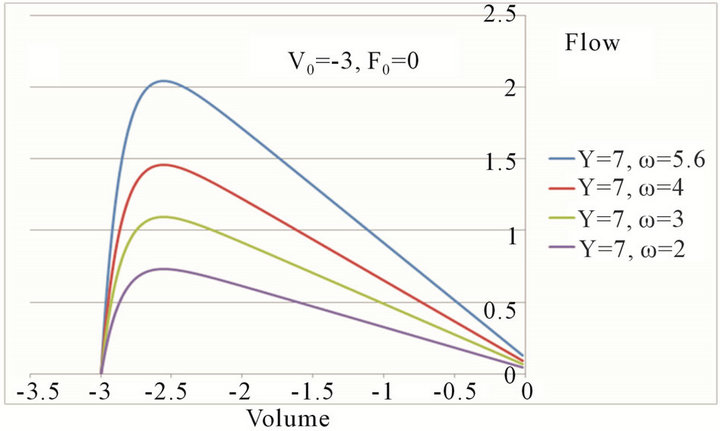 (b)
(b)
Figure 4. The slope of flow-volume trajectory was dependent upon the mechanical parameters of the respiratory system. The higher the dissipation coefficient (the respiratory resistance) was (a) or the lower the potential coefficient (the respiratory elastance) was (b), the flatter the expiratory flow-volume trajectory became.
5. DISCUSSION
5.1. Vectorial Mechanics and Analytical Mechanics
Lanczos compared the difference between Newtonian mechanics (vectorial mechanics) and analytical mechanics [1], and summarized four principal viewpoints: 1) vectorial mechanics isolates the particle and considers it as an individual, but analytic mechanics considers the system as a whole; 2) vectorial mechanics constructs a separate acting force for each moving particle, but analytical mechanics considers one single function the work function (the potential function); 3) if strong forces maintain a definite relation between the coordinates of a system, and that relation is empirically given, the analytical treatment takes the given relation for granted, without requiring knowledge of the forces which maintain it; and 4) in the analytical method, the entire set of equations of motion can be developed from one unified principle of least action. In the case of free particles, i.e., particles whose motion is not restricted by given constraints, the two forms of description lead to equivalent
 (a)
(a)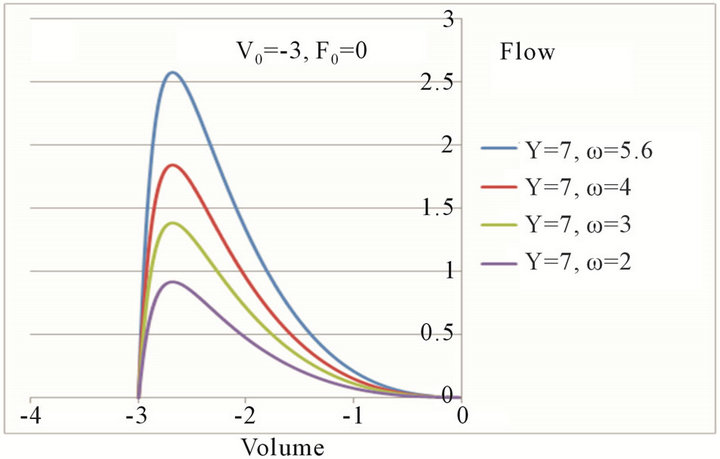 (b)
(b)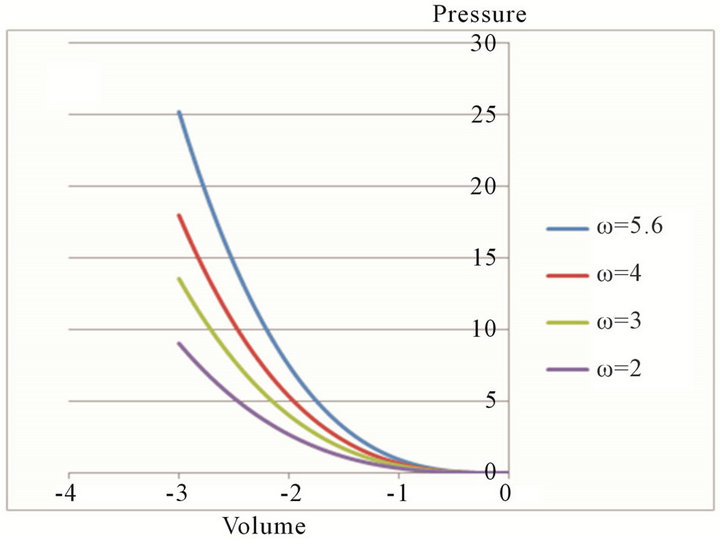 (c)
(c)
Figure 5. The degree of curvature in flow-volume trajectories was dependent more on the coefficient of potential energy than on the dissipation coefficient (the respiratory resistance).
results. But for systems with constraints, the analytical treatment is simpler and more economical. The given constraints are taken into account in a natural way by letting the system move along all the tentative paths in harmony with them.
It is easy to obtain paths of motion of the respiratory system as flow-volume trajectories from a patient in standard clinical practices. Since the flow-volume trajectory is a path of motion, it is possible to recognize it as the actual one chosen by the principle of least action according to the analytical mechanics. The most important trajectory is the forced expiratory flow-volume curve, which suggests the existence of the critical condition of airflow limitation in the respiratory system (Figure 1(b)). Based on geometrical properties of maximal expiratory flow-volume (MEFV) curves two assumptions were adopted at the state of airflow-limitation: 1) according to dynamical patterns of FEFV trajectories, the potential function of U would be defined by either Eq.8 or Eq.12; 2) the distributed regional flow resistances or the regional dissipation coefficients would be fixed to a single value of the whole system according to the wave-speed theory [7] (Figure 2). Thus, the respiratory system during the airflow limitation would be completely described by two variables: the volume and the choked flow. However, the flow-volume trajectories of spontaneous breathing (Figure 1(a)) would not be described by the equations of two variables because more regional volume and flow variables would be necessary. In order to describe spontaneous breathing in terms of analytical mechanics, it should be necessary to evaluate the number of variables such as regional flows and volumes for each spontaneous motion. Recent advances are being made in technologies concerning the making of images of pulmonary regional function based on the lobular structures, and these advances are providing new information for insights on solving this problem.
Computational models previously published such as Lambert’s model [8] and Solway’s transistor model [9] were based on the mechanical property of the site of airflow limitation or the choke point. However, the location of the choke point at the condition of airflow-limitation has not been revealed yet, thus the mechanical property of the choke point is only a proposal assumption for adapting experimental data from MEFVC. In the case of the model proposed in this paper, it is not necessary to define the location and the property of the choke point, but the dynamical characterization of pulmonary system in the airflow-limitation is necessary through kinematic properties of flow-volume trajectories.
5.2. Forced Expiratory Flow Rates at Low Lung Volumes and Hysteresis
Forced expiratory flow rates at low lung volumes often differ between maximal (i.e., initiated from total lung capacity) and partial (i.e., initiated from below total lung capacity) forced expiratory maneuvers because of the effects of a deep inhalation (DI) on expiratory flowvolume relationships. On average, healthy adults display slightly higher forced expiratory flow at a specified lung volume during a maximal expiratory maneuver than during a partial expiratory maneuver [10]. Lim et al. reported that asthmatic patients who went to a hospital for treatment of severe attacks were assessed for level of obstruction and the effects of deep inhalation (DI) on degree of obstruction at various stages of their treatment and after recovery over several days, and suggested that the more severe the obstruction was, the greater the constrictor effect of a DI would be [11]. According to our results of Eq.11, the ratio of maximal and partial forced expiratory flows was transformed to the ratio , where
  and
and  were the slope of the MEFV curve at partial and maximal forced expiratory maneuvers, respectively. Then, the relationship of
  is expressed between mechanical properties approximately by the following equation when
  and
and ,
,
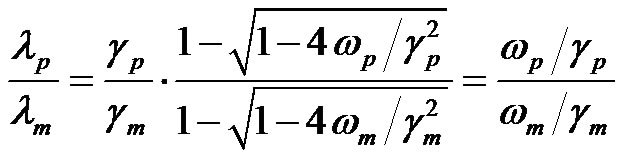 (14)
(14)
Eq.14 has shown that the difference of expiratory flows in the specified lung volume during a maximal maneuver and a partial maneuver was explained as the difference in the ratio of the dissipation coefficient to potential coefficient in a respiratory system composed of many lobules. Venegas et al. showed the hypoventilated lobular clusters emerging in asthmatics having an attack by use of reconstructed images of PET-CT [12]. Thus, the hysteresis or the dependency with volume history of the respiratory system should be explained in terms of emerged patterns in hypoventilated lobular clusters in the lung, and the mechanical properties of the respiratory system should be also explained in terms of relationships with the pattern of hypoventilated lobular clusters.
5.3. Curved Maximal Expiratory Flow-Volume Curves and Regional Air-trapping
The transforming of a straight MEFV trajectory to a curved one has been recognized clinically as an indicator to detect early stages of chronic obstructive pulmonary disease (COPD) or small airways disease [13]. Expiratory air trapping on high resolution CT images was never observed in the 10 healthy subjects, but was observed in 21 (72%) of 29 patients with predominantly small airways obstruction (abnormal flow-volume curve and FEV1: vital capacity > or = 80%) [14]. According to reconstructed flow-volume trajectories in this study, this transforming of the MEFV curve was caused by transformation of the potential function U and was independent from the dissipation coefficient or the respiratory resistance (Figures 5(a) and (b)). By use of Eq.12, driving pressure P of the respiratory system in the airflow-limitation is expressed as , which shows that driving pressure P would decline rapidly during the end of expiration (Figure 5(c)). Mead et al. revealed that the pressure P was equal to the elastic recoil pressure of the lung [15]. When the regional airtrappings would appear extensively as clusters of lobules in the lung, the elastic recoil pressure would decline rapidly. When the regional air-trappings would appear extensively as clusters of lobules in the lung, the elastic recoil pressure would decline rapidly. Therefore, the curve transformation of flow-volume trajectory should be analyzed in relation to regional clusters of air-trapped lobules emerged in the lung.
6. CONCLUSION
In this paper, the author has proposed the formulation of analytical respiratory mechanics applied to the system of secondary pulmonary lobules, which are integrated by a fractal bronchial tree. Based on analytical respiratory mechanics, two types of motion equations (linear and nonlinear) were obtained for describing the airflow limitation. Reconstructed flow-volume trajectories from the linear equation have shown a new relationship between geometrical and mechanical properties of the respiratory system with airflow-limitation. Reconstructed curved flow-volume trajectories from the nonlinear equation have suggested the possibility to detect the degree of air-trapped regional clusters of lobules through a change in the shape of the MEFV curve. In conclusion, analytical respiratory mechanics will provide the basis for transforming previous functional data into newly emerging functional images.
REFERENCES
- Lanczos, C. (1970) The variational principles of mechanics. 4th Edition, Dover Publications, Inc., New York.
- Webb, W.R. (2006) Thin-section CT of the secondary pulmonary lobule: Anatomy and the image—The 2004 fleischner lecture. Radiology, 239, 322-338. doi:10.1148/radiol.2392041968
- Itoh, H., Nakatsu, M., Yoxtheimer, L.M., Uematsu, H., Ohno, Y. and Hatabu, H. (2001) Structural basis for pulmonary functional imaging. European Journal of Radiology, 37, 143-154. doi:10.1016/S0720-048X(00)00301-6
- Min, K., Hosoi, K., Kinoshita, Y., Hara, S., Degami, H., Takada, T. and Nakamura, T. (2012) Use of fractal geometry to propose a new mechanism of airway-parenchymal interdependence. OJMIP, 2, 14-20. doi:10.4236/ojmip.2012.21003
- Asano, N. and Watachi, M. (1987) Kinematic properties in ordinary differential equation. Applicable Mathematics, 2, Kohdannsha, Tokyo, 148-164.
- Hyatt, R.E., Shilder, D.P. and Fry, D.L. (1958) Relationship between maximum expiratory flow and degree of lung inflation. Journal of Applied Physiology, 13, 331- 336.
- Dawson, S.V. and Elliott, E.A. (1977) Wave-speed limitation on expiratory flow: a unifying concept. Journal of Applied Physiology, 43, 498-515.
- Lambert, R.K. and Beck, K.C. (2004) Airway area distribution from the forced expiration maneuver. Journal of Applied Physiology, 197, 570-578. doi:10.1152/japplphysiol.00912.2003
- Solway, J., Fredberg, J.J., Ingram Jr., R.H., Pedersen, O.F. and Drazen, J. (1987) Interdependent regional lung emptying during forced expiration. Journal of Applied Physiology, 62, 2013-2025.
- O’Connor, G.T., Sparrow, D., Demolles, D., Dockery, D., Raizenne, M., Fay, M., Ingram Jr., R.H. and Speizer, F.E. (2000) Maximal and partial expiratory flow rates in a population sample of 10- to 11-yr-old schoolchildren: Effect of volume history and relation to asthma and maternal smoking. American Journal of Respiratory and Critical Care Medicine, 162, 436-439. doi:10.1164/ajrccm.162.2.9906087
- Lim, T.K., Ang, S.M., Rossing, T.H., Ingenito, E.P. and Ingram Jr., R.H. (1989) The effects of deep inhalation on maximal expiratory flow during intensive treatment of spontaneous asthmatic episodes, American Journal of Respiratory and Critical Care Medicine, 140, 340-343. doi:10.1164/ajrccm/140.2.340
- Venegas, J.G., Winkler, T., Musch, G., Vidal Melo, M.F., Layfield, D., Tgavalekos, N., Fischman, A.J., Callahan, R.J., Bellani, G. and Harris, R.S. (2005) Self-organized patchiness in asthma as a prelude to catastrophic shifts. Nature, 434, 777-782. doi:10.1038/nature03490
- Matsuba, K., Shirakusa, T., Kuwano, K., Hayashi, S. and Shigematsu, N. (1987) Small airways disease in patients without chronic air-flow limitation. American Journal of Respiratory and Critical Care Medicine, 136, 1106-1111. doi:10.1164/ajrccm/136.5.1106
- Lucidarme, O., Coche, E., Cluzel, P., Mourey-Gerosa, I., Howarth, N. and Grenier P. (1998) Expiratory CT scans for chronic airway disease: Correlation with pulmonary function test results. American Journal of Roentgenology, 170, 301-307. doi:10.2214/ajr.170.2.9456933
- Mead, J., Turner, J.M., Macklem, P. and Little, J. (1967) Significance of the relationship between lung recoil and maximal expiratory flow. Journal of Applied Physiology, 22, 95-108.
APPENDIX
In numerical analysis, a branch of applied mathematics, the midpoint method is a one-step method for numerically solving the differential equation. When a differrential equation  is given with initial values V0 and F0,
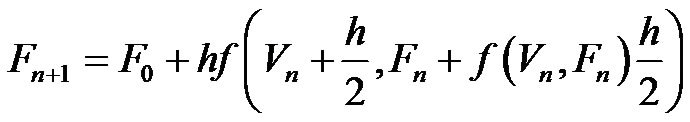
for n=1, 2, 3, ... and, h is the step size—a small positive number (h = 0.01). For reconstruction of flow-volume trajectories, the function of f is defined as follows,
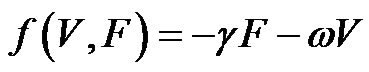
for Eq.10.
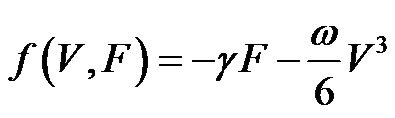

for Eq.13.
Several sets of initial values were given as (V0,F0) = (−3,0), (−2,0), (−1.5,0), (−1,0), (−2,2.5), (−1.5,2), (−1, 1.5). The name of the method comes from the fact that in the formula above, the function f is evaluated at V = Vn + h/2 which is the midpoint between Vn at which the value of F is known and Vn+1 at which the value of F needs to be found. The local error at each step of the midpoint method is of order O(h3), giving a global error of order O(h2). Several series of values (Vn,Fn) were obtained by using Excel 2007 in accordance with the midpoint method under the given sets of mechanical parameters γ, ω. These series of values were plotted on the flow-volume plane as shown in Figures 3-5.