Open Journal of Preventive Medicine
Vol.4 No.1(2014), Article ID:41850,5 pages DOI:10.4236/ojpm.2014.41002
Racial disparity in years of potential life lost to induced abortions
1Department of Public Health Sciences, University of North Carolina at Charlotte, Charlotte, US; *Corresponding Author: jstudnic@uncc.edu
2Doctoral Program in Health Services Research, University of North Carolina at Charlotte, Charlotte, US
Copyright © 2014 James Studnicki et al. This is an open access article distributed under the Creative Commons Attribution License, which permits unrestricted use, distribution, and reproduction in any medium, provided the original work is properly cited. In accordance of the Creative Commons Attribution License all Copyrights © 2014 are reserved for SCIRP and the owner of the intellectual property James Studnicki et al. All Copyright © 2014 are guarded by law and by SCIRP as a guardian.
Received 31 October 2013; revised 3 December 2013; accepted 21 December 2013
KEYWORDS
Abortion; Years of Potential Life Lost
ABSTRACT
The magnitude of the overall prevalence and racial disparity in induced abortion suggests that it is a major influence on the demographic and socioeconomic composition of the population of the United States (US). However, the years of potential lives averted by induced abortion have not been systematically studied. We applied race-specific intra-uterine death estimates to the induced abortions occurring to non-Hispanic (NH) white and non-Hispanic (NH) black women in the US state of North Carolina in 2008. The resultant estimate of births averted by induced abortion was used to project years of potential life lost. All-cause detailed mortality data were used to compare induced abortion with other contributing causes of years of potential life lost before age 75 (YPLL 75). For NH whites, induced abortions in 2008 contributed 59% of total YPLL 75, and 1.5 times the total YPLL 75 from all other causes combined. For NH blacks, induced abortions in 2008 contributed 76% of total YPLL 75 and 3.2 times the total YPLL 75 from all other causes combined. Induced abortion is the overwhelmingly predominant contributing cause of preventable potential lives lost in the North Carolina population, and NH blacks are disproportionately affected.
1. INTRODUCTION
Large racial differences have been consistently observed for a number of years in pregnancy rates, average lifetime pregnancies and induced abortion rates [1-3]. Based on the most recent multi-year national summary of pregnancy outcomes, covering the years 1990-2008, in 2008 in the US, 64.6% of all pregnancies ended in a live birth, 17% in an intrauterine death (includes miscarriages occurring at less than 20 weeks and stillbirths >20 weeks gestation), and 18.4% in an induced abortion [3]. The overall (all maternal ages) pregnancy rate for NH black women was 144.3 per 1000, 65% higher than the rate for NH white women (87.5 per 1000 women). According to the same report, NH black women experience an average of more pregnancies in a lifetime (4.3) than NH white women (2.7). In 2008, 69% of NH white but only 49% of NH black pregnancies resulted in a live birth [3]. For NH white women 12.4% of pregnancies were terminated by induced abortions, whereas the percentage for NH black women was nearly three times higher at 35.6% [3]. There were 5.5 NH white live births for every NH white induced abortion, but only 1.4 NH black live births for every NH black induced abortion. Therefore, in spite of a higher pregnancy rate than NH whites, pregnancies experienced by NH black women are much less likely to result in a live birth, largely as the result of their dramatically higher induced abortion rate. The abortion experience of Hispanic women closely corresponds to that of NH whites and was therefore not included in this analysis [3].
Both the magnitude of the prevalence of induced abortion and the huge NH black/NH white racial disparity suggest that it is a major influence on the demographic, socioeconomic and cultural composition of the United States population. An understudied aspect of particular interest in this regard is the estimate of the years of potential lives averted by induced abortions. The statistical construct of Years of Potential Life Lost (YPLL) is the most widely applied method of characterizing the burden of premature death within defined populations. It has been included by the Centers for Disease Control and Prevention (CDC) in its standard reports since 1982 [4] and extensively applied in measuring and comparing the health status of cities [5], counties [6] and states [7] within the US, as well as in comparisons of nations conducted by international organizations [8]. The YPLL method, however, has not previously been used to characterize the burden of potential lives lost to induced abortion. It is of interest to note that previous YPLL analyses have included infant mortality and perinatal conditions as causes of death, even though the latter includes conditions arising between 28 weeks of gestation and 7 days of life [9]. In those applications of YPLL, the qualifying condition for inclusion as a potential life lost, therefore, has been that there must be a live birth and not merely some minimum defined gestational period. This same reporting convention regarding the nature of potential life lost can be seen in the inconsistency surrounding the counting of stillbirth (intrauterine death occurring in the third trimester) as a death. One observer has questioned why the 35 week old neonate who dies of respiratory failure 24 hours after delivery and the developmentally indistinguishable 35 week old stillborn baby are treated differentially in mortality statistics; i.e., one is considered as a death, and therefore as a potential life lost, while the other is not [10]. The likely explanation, of course, is that attributing existing (or potential) life to an intrauterine loss due to natural means (i.e. spontaneous abortion) by counting it as a death (or potential life) could suggest equivalent treatment of elective abortions. However, requiring that only a live birth can represent years of potential life lost is a logical tautology for induced abortion, the specific intent of which is to prevent a live birth.
The rationale for the use of a confirmed pregnancy rather than a live birth as a measure of potential life lost by means of induced abortions is logically persuasive and empirically validated. Potential lives lost to induced abortion can be accurately estimated from confirmed pregnancies because: 1) in the absence of induced abortion, physiological factors are the sole determinants of whether conception actually results in a live birth [11], 2) induced abortion averts both live births and intra-uterine deaths so not all aborted fetuses would result in a live birth in the absence of induced abortion; 3) Intra-uterine deaths at all gestational stages following a confirmed pregnancy are reasonably estimated on the basis of empirical studies of pregnant populations as well as extensive surveys of women who have experienced miscarriages and stillbirths, thus enabling an accurate estimate of potential lives lost to induced abortions [12]. Further, the reluctance to quantify the measurable impact of induced abortion impedes legitimate discourse regarding its societal consequences. Therefore the objective of this research was to apply the concept of YPLL to induced abortion within a geographically defined population of NH blacks and NH whites; and, to compare the magnitude of its impact against other causes of potential life lost.
2. METHOD
2.1. Data
Event-level and aggregated data used in this analysis were all de-identified and publically available from the following sources: The North Carolina State Center for Health Statistics (NC-SCHS) provided pregnancy counts for North Carolina residents by year (2008), county, mother’s race and Hispanic origin, age, education and marital status. Reported pregnancies include live births, induced abortions and fetal deaths of 20 or more weeks of gestation. Detailed event-level mortality statistics provided death counts for North Carolina residents by year (2008), cause of death, county, race, gender, age and Hispanic origin. The Centers for Disease Control and Prevention (CDC) provided estimated national pregnancy rates and outcomes for the United States, 1990-2008, for pregnancies, live births, estimated intra-uterine deaths and induced abortions by race and ethnicity. Also provided were total YPLL and death counts in North Carolina (2008) for all causes of death by race and ethnicity. The United States Census Bureau, U.S. Department of Commerce, provided annual mid-year (2008) estimates of the resident population of North Carolina by sex, race and Hispanic origin.
2.2. Fetal Loss Estimation
The provision of induced abortion services is predicated on the assumption that the pregnancy has been clinically confirmed. In order to accurately reflect intrauterine deaths in the absence of induced abortion, our definition and estimate of intra-uterine deaths excluded those that occur prior to implantation and included all of those that might occur at all gestational ages; i.e., miscarriages and stillbirths. Since fetal deaths that occur at less than 20 weeks, i.e. miscarriages are not reported in North Carolina it was necessary that we apply the CDC National Center for Health Statistics (NCHS) race-specific intra-uterine death estimates to induced abortions in North Carolina in order to avoid overestimating live births in the absence of induced abortion. Of all fetal loss estimate methodologies during recognized pregnancies, the CDC-NCHS method returns the highest fetal loss rates and therefore provides the most conservative estimate of potential lives lost to induced abortion [13-16]. The multiple sources of data, consistency of reporting over an extended period of time, and careful attention to statistical significance of the estimates assures the most valid estimate of pregnancy rates and outcomes possible. The components of the CDC method of estimation, briefly summarized, are as follows:
1) Live births are based on complete counts reported on birth certificates provided by every state to the NCHS through the Vital Statistics Cooperative Program (VSCP) [17,18];
2) Estimates of induced abortions are from abortion surveillance information collected by the CDC’s National Center for Chronic Disease Prevention and Health Promotion (NCCDPHP) from most states (including North Carolina); these estimates are adjusted to national totals by the Guttmacher Institute from surveys of all known abortion providers [19,20];
3) Intra-uterine death estimates are derived from the pregnancy history data collected by the National Survey of Family Growth (NSFG), NCHS; estimates are based on the proportion of pregnancies which ended in fetal loss during the three most recent NSFG survey cycles for adults (age 20 - 44), and the four most recent NSFG survey cycles for teens under 20. Unlike vital statistics data which are generally limited to fetal losses at 20 weeks or more gestation, the NSFG data include losses at all gestational points.
2.3. Analysis
Results were determined by:
1) Establishing national (2008) estimates of fetal loss rates [fetal losses/(live births + fetal losses)] for NH whites and NH blacks; 2) Applying those fetal loss rates to the (2008) North Carolina NH white and NH black number of induced abortions; 3) Subtracting those estimated fetal losses from the total induced abortions to derive the estimated number of live births averted by induced abortions; 4) Multiplying those estimated averted births by 75 years to determine the total YPLL due to induced abortions before age 75 (YPLL 75); 5) Determining YPLL 75 for every cause using both North Carolina detailed mortality data and the CDC (WISQARS YPLL 75) categories for reporting; and, 6) Comparing the contributions to the total YPLL 75 from all other major causes.
3. RESULTS
In 2008 in North Carolina, 12.9% of NH white and 27% of NH black pregnancies were terminated by induced abortions (Table 1). Fetal loss rates totaled for all gestational periods estimated from national data were 21% for NH whites and 23.7% for NH blacks. Applied to the North Carolina induced abortions in 2008, there were 2267 estimated fetal losses and 8530 live births averted for NH whites; and 2811 estimated fetal losses and 9050 live births averted for NH blacks (Table 2).
For NH whites, induced abortions in 2008 contributed 59% of total YPLL 75, and 1.5 times the total YPLL 75 from all other causes combined. For NH blacks, induced abortions in 2008 contributed 76% of total YPLL 75 and 3.2 times the total YPLL 75 from all other causes combined. Induced abortions contributed 3.6 times the YPLL 75 accumulated from the three major chronic diseases (malignant neoplasm, heart disease, cerebrovascular) combined for NH whites; and 8.7 times for NH blacks (Table 3). Despite the magnitude of the contribution of induced abortions to YPLL 75 for both NH whites and NH blacks, and the very large racial disparity in the rate per 100,000 population, there were even wider differences in the rates for other causes. YPLL 75 NH black rates per 100,000 were 10.9 times higher than NH whites for HIV, 5.6 times higher for homicide and 4.4 times higher for both hypertension and the perinatal conditions. NH white YPLL 75 rates were actually higher than NH black rates for suicide, unintentional injuries, chronic lower respiratory disease and liver disease.
4. DISCUSSION
This study has demonstrated that induced abortion is the overwhelmingly predominant contributing cause of years of preventable potential lives lost in the North Carolina population, and NH blacks are disproportionately affected. A particular strength of this study is that the validity and accuracy of these objective estimates are free of subjective points of view, and attendant value judgments, derived from any ideological, religious, poli-
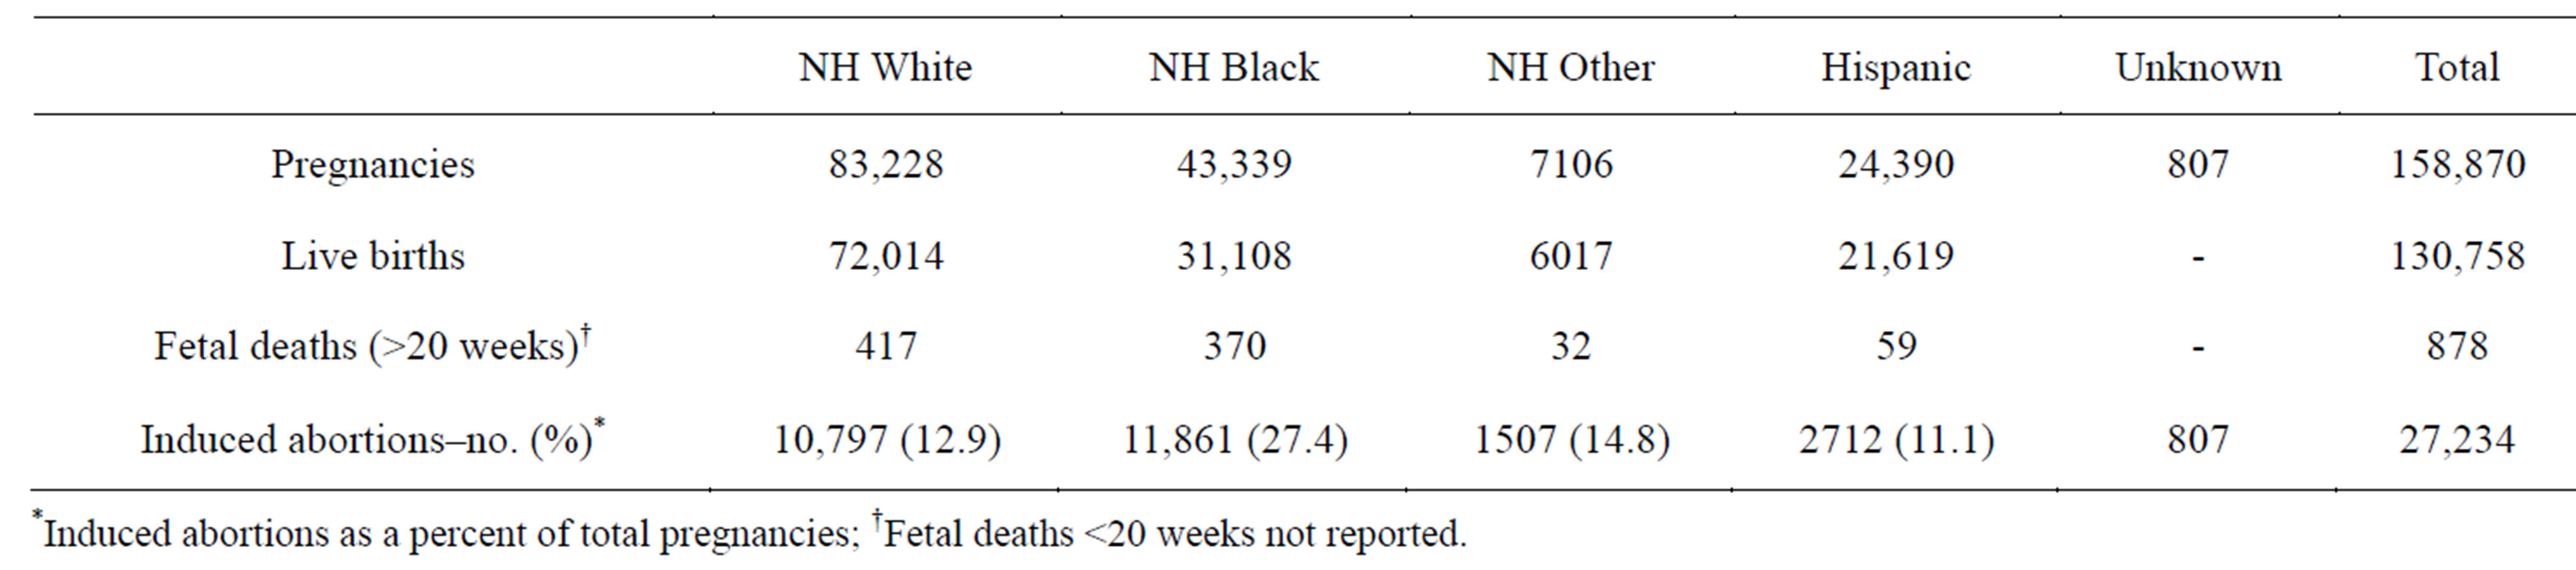
Table 1. Pregnancy outcomes by race/ethnicity, North Carolina, 2008.
tical or cultural perspective. These analyses and results are completely independent of answers to questions such as whether a fetus has the same moral status as a newborn [21]; whether some induced abortions are more justified than others, as in the case of rape or incest; whether the “intentionality” of the woman was to abort or continue the pregnancy to a live birth [22]; or, whether
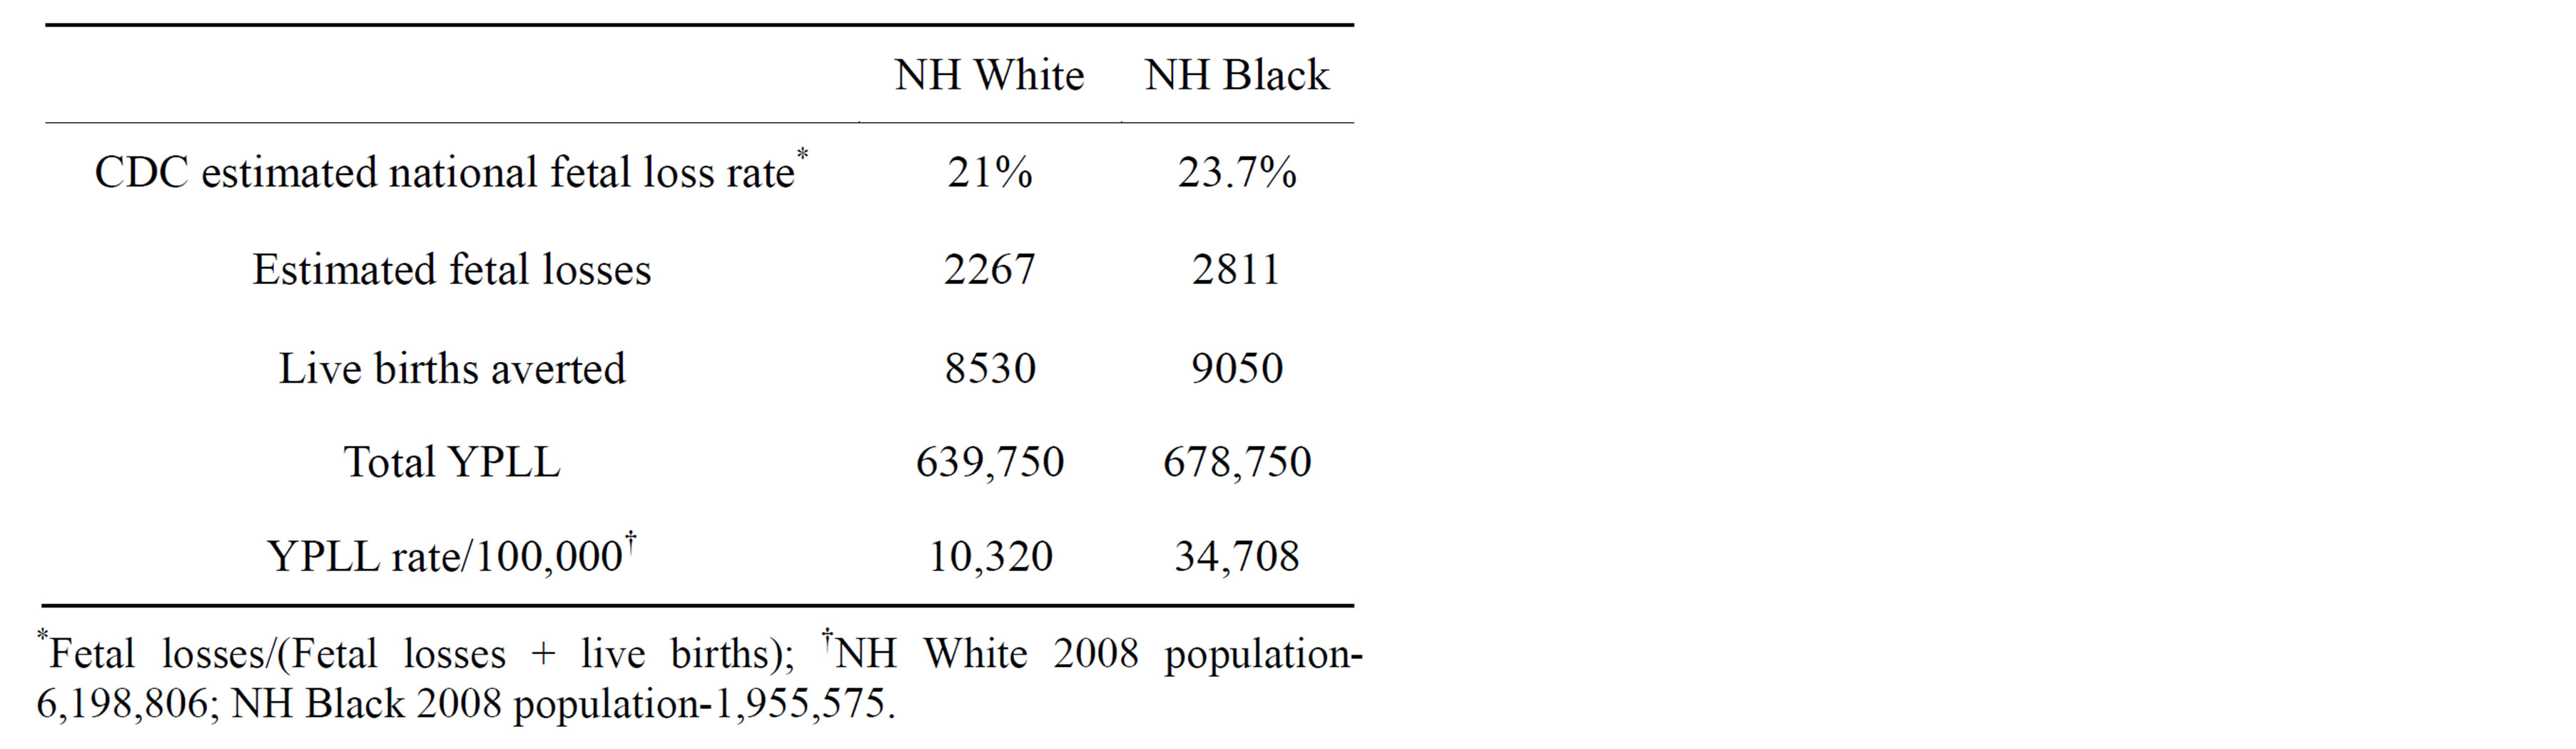
Table 2. YPLL 75 from induced abortions, North Carolina, 2008.
abortions should be prohibited beyond some gestational period such as 28 weeks.
Except for the statistical differences in the likelihood of surviving to a live birth based on gestational age, included in the method of fetal loss estimation, no attempt is made to impute differential “value” or “quality” to these years of life lost in any way. The magnitude and racial disparity in potential lives lost to induced abortion described in this research should provoke discussion and inform policy. However, the identical objective information will likely be used to make contrasting arguments related to the motivation for and outcomes of induced abortion; for example, that induced abortion is both a major method of government cost savings and the principal instrument of racial genocide [23,24].
The YPLL method has certain limitations. The cutoff age, 75 in our case, is somewhat arbitrary and does not acknowledge lives lived beyond a certain point nor include them in the calculation of years lost. YPLL also tends to undervalue lives lost from chronic diseases since
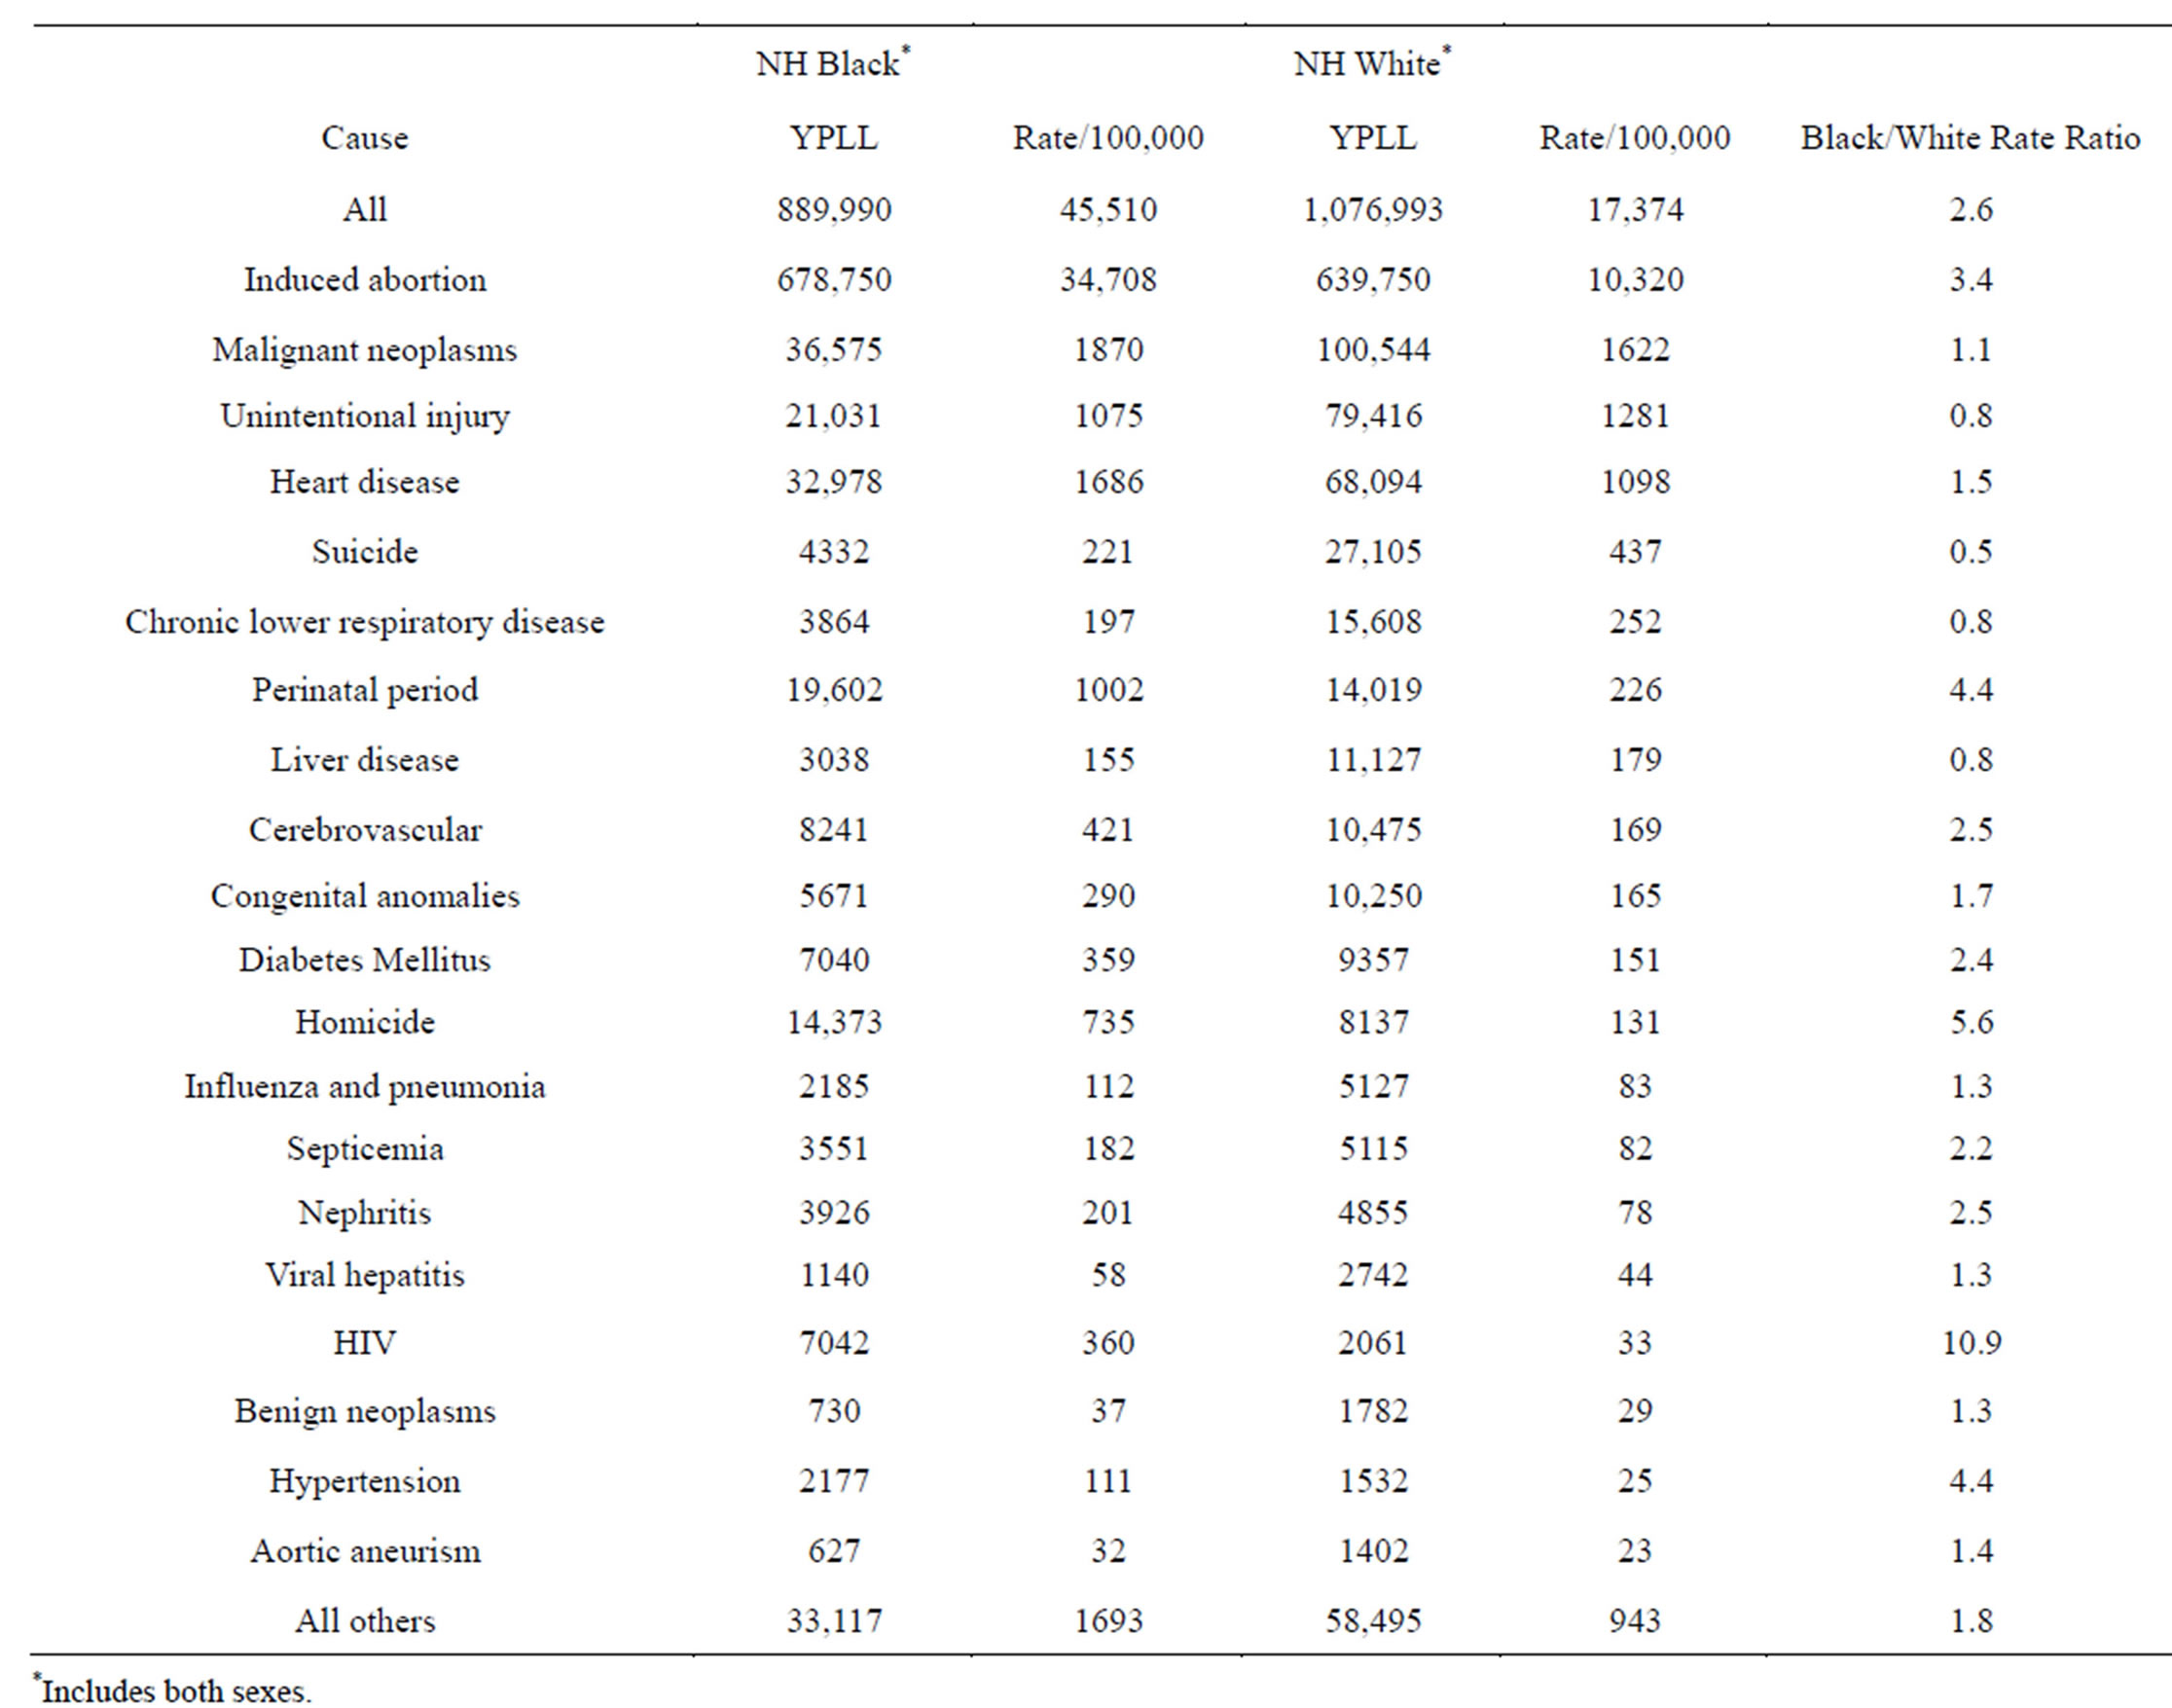
Table 3. Years of potential life lost before age 75 (YPLL 75), all causes, 2008, NH Whites and NH Blacks, North Carolina.
they typically occur at older ages. Since NH black life expectancy was 3.8 years lower than NH whites in 2010, application of a race-specific life expectancy value could be used for each race so as not to inflate NH black YPLL however that would be an atypical application with only a marginal effect on the results [25]. Finally, results derived from the North Carolina NH white and NH black induced abortion data in 2008 should not be generalized to any other specifically defined population-although the data does suggest that the North Carolina experience conforms closely to national (US) trends [3].
ACKNOWLEDGEMENTS
There is no conflict of interest of any parties contributing to this study.
REFERENCES
- Ventura, S.J., Mosher, W.D., Curtin, S.C., Abma, J.C. and Henshaw, S. (2000) Trends in pregnancies and pregnancy rates by outcome: Estimates for the United States, National Center for Health Statistics. Vital and Health Statistics, Series 21, 56, 1976-1996.
- Ventura, S.J., Abma, J.C., Mosher, W.D. and Henshaw, S.K. (2009) Estimated pregnancy rates for the United States, 1990-2005: An update. National Vital Statistics Reports, 58, 1-14.
- Ventura, S.J., Curtin, S.C, Abma, J.C. and Henshaw, S.K. (2012) Estimated pregnancy rates and rates of pregnancy outcomes for the United States, 1990-2008. National Vital Statistics Reports, 60, 1-21.
- Gardner, J.W. and Sanborn, J.S. (1990) Years of potential life lost (YPLL)—What does it measure? Epidemiology, 1, 322-329. http://dx.doi.org/10.1097/00001648-199007000-00012
- McDonnell, S., Vossberg, K., Hopkins, R.S. and Mittan, B. (1998) Using YPLL in health planning. Public Health Reports, 113, 55-61.
- Peppard, P.E., Kindig, D., Riemer, A., Dranger, E. and Remington, P.L. (2003) Wisconsin county health rankings, 2003. Wisconsin Public Health Policy Institute, Madison.
- United Heath Foundation. (2013) America’s health: United Health Foundation state health rankings 2012 Edition. http://www.americashealthrankings.org/All/YPLL/2012
- Organization for Economic Co-Operation and Development (OECD). (2013) Potential years of life lost. http://stats.oecd.org/glossary/detail.asp?ID=2095
- CDC, National Center for Health Statistics (1988) Trends in years of potential life Lost due to infant mortality and perinatal conditions, 1980-1983 and 1984-1985. Morbidity and Mortality Weekly Report (MMWR), 37, 249-256.
- Kelley, M. (2011) Counting stillbirths: Women’s health and reproductive rights. Comment. Lancet, 377, 249-256.
- Kliman, H.J., McSweet, J.C. and Levin, Y.A. (2005) Fetal death: Etiology and pathological findings. Up To Date.
- Kost, K. and Henshaw, S. (2012) US teenage pregnancies, births, and abortions, 2008: National trends by age, race and ethnicity. The Guttmacher Institute, New York.
- Miller, J.F., Williamson, E., Glue, J., Gordon, Y.B., Grudzinskas, J.G. and Sykes, A. (1980) Fetal loss after implantation: A prospective study. Lancet, 2, 554-556. http://dx.doi.org/10.1016/S0140-6736(80)91991-1
- Wang X, Chen C, Wang L, et al. (2003) Conception, early pregnancy loss, and time to clinical pregnancy: A population based prospective study. Fertility and Sterility, 79, 577-584. http://dx.doi.org/10.1016/S0015-0282(02)04694-0
- Zinaman, M.D., Clegg, E.D., Brown, C.C., O’Connor, J. and Selevan, S.G. (1996) Estimates of human fertility and pregnancy loss. Fertility and Sterility, 65, 503-509.
- Wilcox, A.J., Treloar, A.E. and Sandler, D.P. (1981) Spontaneous abortion over time: Comparing occurrence in two cohorts of women a generation apart. American Journal of Epidemiology, 114, 548-553.
- National Center for Health Statistics, CDC. (2013) User guide to the 2008 natality public use file. http://ftp.cdc.gov./pub/Health_Statistics/NCHS/Dataset_Documentation/DVS/natality/UserGuide2008.pdf
- Martin, J.A., Hamilton, B.E., Sutton, P.D., Ventura, S.J., Mathews, T.J. and Osterman, M.J. (2010). Births: Final data for 2008. National Vital Statistics Reports, 59, 3-71.
- Pazol, K., Zane, S.B., Parker, W.Y., Hall, L.R., Berg, C. and Cook, D.A. (2011) Abortion surveillance—United States, 2008. MMWR Surveillance Summaries, 60, 1-41.
- Jones, R.K. and Kooistra, K. (2011) Abortion incidence and access to services in the United States, 2008. Perspectives on Sexual and Reproductive Health, 43, 41-50. http://dx.doi.org/10.1363/4304111
- Giubilini, A. and Minerva, F. (2012) After-birth abortion: Why should the baby live? Journal of Medical Ethics, 39, 261-263. http://dx.doi.org/10.1136/medethics-2011-100411
- Hammerslough, C.R. (1992) Estimating the probability of spontaneous abortion in the presence of induced abortion and vice versa. Public Health Reports, 107, 269-277.
- Covert, B. (2013) How denying woman access to reproductive choices costs taxpayers. http://thinkprogress.org/economy/2013/07/01/2239101/abortion-contraception-budget/
- Weisbord, R.G. (1973) Birth control and the Black American: A matter of genocide? Demography, 10, 571-590. http://dx.doi.org/10.2307/2060884
- Kochanek, K.D., Arias, E. and Anderson, R.N (2013) How did cause of death contribute to racial differences in life expectancy in the United States in 2010? NCHS Data Brief, 125, 1-8.