Open Journal of Physical Chemistry
Vol. 2 No. 3 (2012) , Article ID: 22100 , 6 pages DOI:10.4236/ojpc.2012.23019
Thermodynamic Properties of Li-LiH (LiD, LiT) Systems. The Phase Diagram
1Joint Institute for High Temperatures Russian Academy of Sciences, Moscow, Russia
2The Institute of Informatics Problems, Russian Academy of Sciences, Moscow, Russia
Email: teplo1930@mail.ru, yukonta@mail.ru
Received June 5, 2012; revised July 4, 2012; accepted August 8, 2012
Keywords: Diagram; Phase equilibrium; Lithium hydride; Deuteride
ABSTRACT
The paper presents a comprehensive critical review and detailed analysis of the literature, published in the field of the phase diagram solution Li-LiH (LiD, LiT). Special attention is paid to the completeness of the source information on the paper’s topic resulting in an extended reference list. Particularly, paper reviews rarely used sources including littleknown publications from research centers, proceedings of the international scientific meetings and dissertations. These publications were more thoroughly analyzed in order to make the information available to the scientific society.
1. Introduction
The phase diagram of the Li-LiH system is complex. Many investigators have studied its individual parts by different methods such as plotting thermograms, analysis of the electrical resistance as a function of temperature and composition of the solution, and measurement of the partial pressure of hydrogen or of its isotopes when the condensed phase is in equilibrium with the vapor. These studies have identified several systematic features in the phase diagram of the Li-LiH system.
2. The Phase Diagram
The temperature-composition diagram for the systems under consideration is shown schematically in Figure 1 (x is the mole fraction of lithium hydride in the condensed phase). The α-phase (on the left-hand side), which is enriched with lithium, is arbitrarily distinguished from the β-phase (on the right-hand side), which is enriched with hydride. The subscript l or s denotes the liquid or the solid phase, respectively. This system has eutectic properties at point с as well as monotectic properties (the line dfg).
Above the monotectic temperature, the liquid phase has a broad immiscibility zone. Experimental data show that the boundaries of the immiscibility zone (the curve dkf) are essentially the same for the Li-LiH and Li-LiD systems. At the same time, the experiment shows that the position of point с with respect to temperature and concentration is slightly different in these systems.
The characteristic points in the diagram for a Li-LiH system according to [1-3] are given in Table 1 (the concentrations at points f and g are rough estimates).
Figure 2 shows the behavior of the isotherms in the pressure-composition diagram of the Li-LiH system above the temperature of the monotectic. The concentration
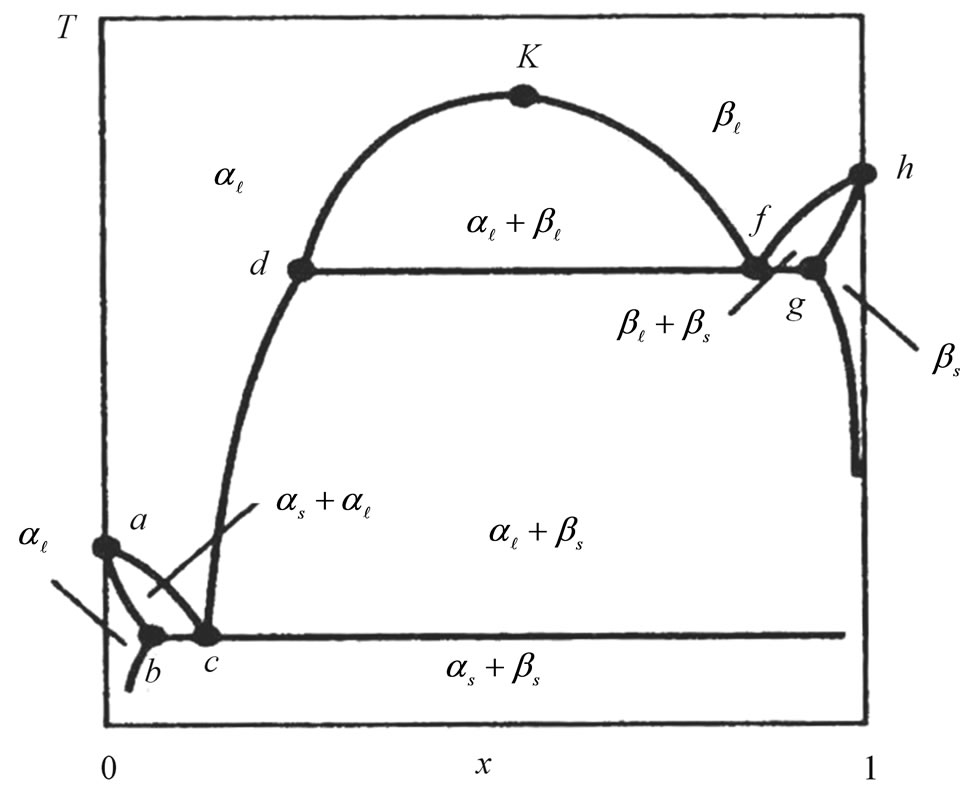
Figure 1. The phase diagram solution type Li-LiH (schematic).
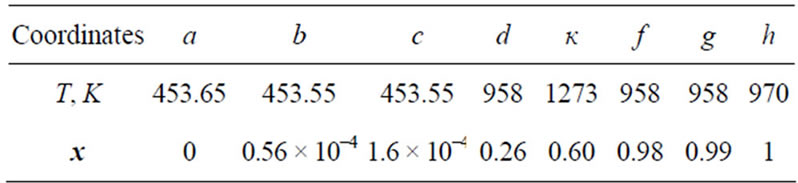
Table 1. Characteristic points of the temperature composition diagram for the Li-LiH system.
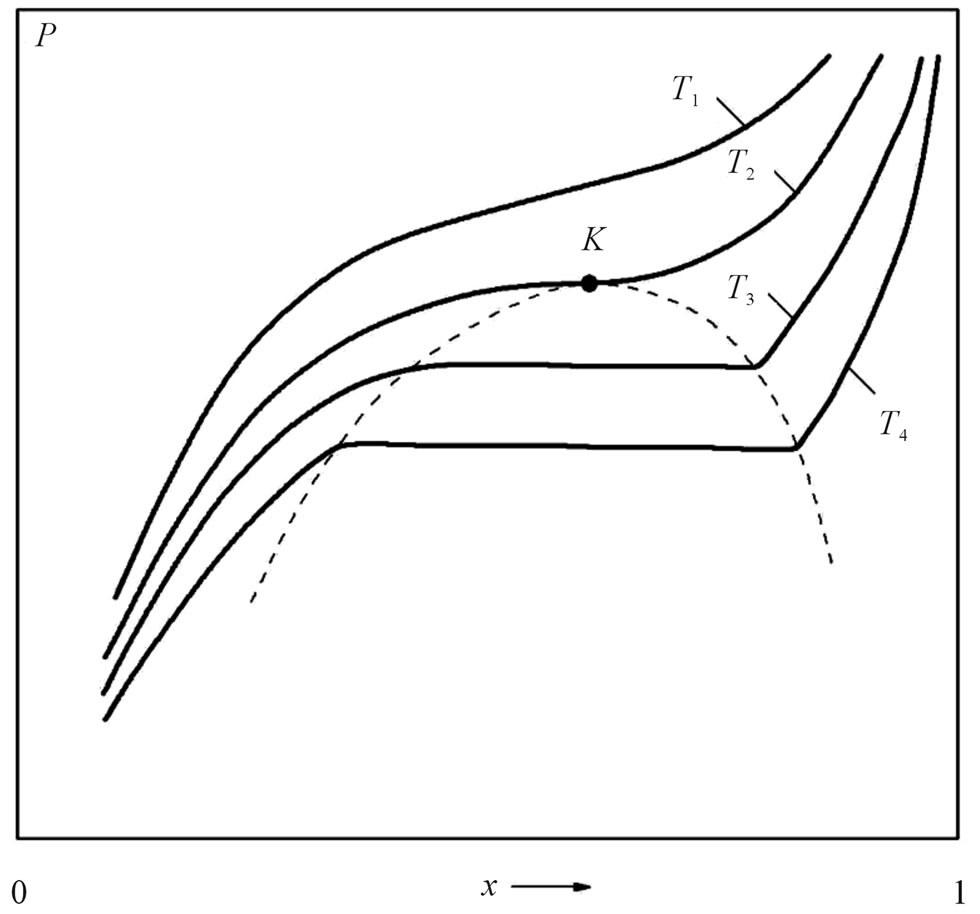
Figure 2. The pressure-composition phase diagram of the Li-LiH system (schematic); T1 > T2 > T3 > T4.
interval inside the immiscibility zone (the dashed curve), in which the vapor pressure remains constant, is called a “plane” region, and the vapor pressure in this region is called a plane pressure.
It is interesting to note the behavior of the isotherms as the condensed-phase composition approaches the stoichiometric composition of lithium hydride. The fact that P goes to infinity as x→1 means that the stoichiometric composition of lithium hydride is actually an unattainable hypothetical state. This isotherm behavior applies not only to the Li-LiH system but also to many other systems containing metal hydrides.
3. Behavior of Isotherm
Analysis of the phase diagram of the Li-LiH system (Figure 1) showed that in a certain temperature region there is an immiscibility zone, in which the vapor pressure and, in particular, the partial hydrogen pressure remain constant as the concentration of the components in the condensed phase changes. At the same time, the hydrogen pressure increases sharply beyond the immiscibility zone as the concentration of the components in the condensed phase approaches the stoichiometric composition of LiH.
The following conventional line of reasoning can be used to explain this phenomenon. Let us assume that the closed system in the liquid phase originally contained a pure lithium hydride of stoichiometric composition which evaporates in the first stage of the process. If there were no chemical reaction in the vapor phase, the amount of evaporated lithium hydride would be such that the vapor pressure would correspond to the saturation vapor pressure of LiH at the temperature T. In the vapor phase, however, there is a dissociation reaction
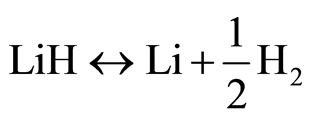 . (1)
. (1)
As a result, the number of LiH molecules in the vapor decreases, causing the partial pressure of the LiH vapor to drop (if it is assumed that the degree to which the vapor deviates from the ideal vapor before the dissociation is the same as the degree to which it deviates after the dissociation). At the same time, the partial pressure of one of the products of the dissociation reaction—atomic lithium—is higher than the saturation pressure of lithium at the temperature T under consideration (if all the produced lithium remains in the vapor state). Since we are dealing with a closed system, the excess lithium must condense. If there were no mixing of lithium with condensed lithium hydride, a new portion of lithium hydride would have to be converted to the vapor phase in order to restore the initial vapor pressure of LiH, which would be contingent in this case solely upon the temperature being kept constant. The evaporation and decomposition would evidently continue until all condensed lithium hydride would be converted to vapor and only pure lithium would remain in the condensed phase.
This situation, in fact, does not exist, which suggests that condensed lithium hydride in a pure form cannot coexist in equilibrium with the vapor. Coexistence can occur only if a certain amount of lithium dissolves in the lithium hydride. The partial vapor pressure of LiH drops to a value at which the condensed Li-LiH phase is in equilibrium with the vapor of a corresponding composition.
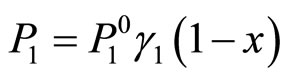
Since a solution of lithium in lithium hydride forms in the liquid phase, the partial pressure  of lithium is proportional to the concentration of lithium in the liquid phase if the liquid is in a phase equilibrium with the vapor:
 (2)
(2)
where  is the saturation pressure of pure lithium,
  is the activity coefficient of lithium in a binary Li-LiH solution, and x is the mole fraction of lithium hydride in the solution.
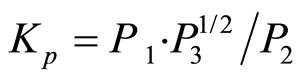
The equilibrium constant of dissociation reaction (1)
 (3)
(3)
is a function of only the temperature (here P2 is the partial pressure of lithium hydride, and P3 is the partial pressure of hydrogen). Since at T = const, the partial pressure of lithium P1 → 0 as x → 1, and since the pressure of lithium hydride, P2, cannot tend to zero in this case, the partial hydrogen pressure must tend to infinity in this process. Although these arguments are based on the assumption that the vapor phase is an ideal phase, a similar regularity observed experimentally confirms these conclusions and indicates that at thermodynamic equilibrium the purity of a lithium hydride sample (i.e., the admixture with lithium) is proportional to the equilibrium hydrogen pressure.
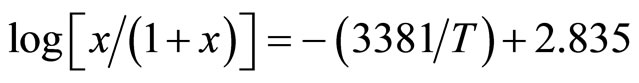
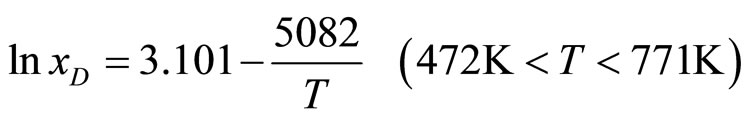
The curve acdfh (see Figure 1) is the solidification line of the Li-LiH system (the liquidus line). This curve was studied in detail for the first time by Messer et al. [4]. In analyzing the behavior of the Li-LiH system when the condensed phase is in equilibrium with the vapor, they found that upon the removal of hydrogen from the vapor phase, the solidification temperature of the melt falls to the monotectic temperature of 685˚C ± 1˚C, remains constant at the molar concentrations of LiH between 98% and 26%, and then falls to 624˚C at 13% LiH. This part of the curve is described by Messer et al. in terms of the functional dependence
 , (4)
, (4)
where x is the mole fraction of LiH in the solution. The heat of solution of solid lithium hydride in liquid lithium was found to be 64.72 kJ/mole from of this equation.
The first data on the liquidus line in Li-LiH and Li-LiD systems below 624˚C were published by a group of British scientists headed by Adams and Hubberstey [1,5-9]. The solubility was determined from the change in the electrical resistance during the dissolution of H2 or D2 in lithium and from the precipitation at the time of saturation.
This method is based on a strong increase in the resistance with increasing concentration of H2 (D2) in the solution and on the appearance of a discontinuity in the ρ —x diagram (ρ is the resistivity, and x is the composition of the solution) at the saturation point of the solution (the point the hydride precipitates out).
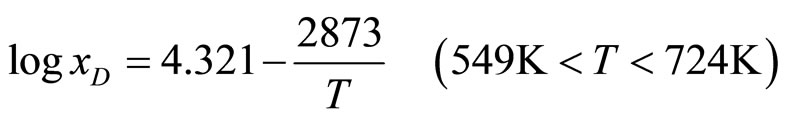
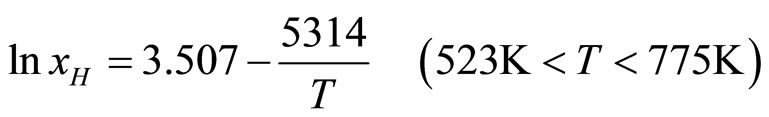
The typical isotherms in Figure 3 show that the resistivity of the solution increases linearly with increasing hydrogen concentration up to the saturation line and then remains nearly constant. The change in resistivity is clearly defined, which accounts for the high sensitivity in determining the solubility. The experimental data on the solubilities of LiH and LiD in lithium obtained in the studies underconsideration are presented in Table 2. These results were approximated by the authors of the cited studies in the form of the equations
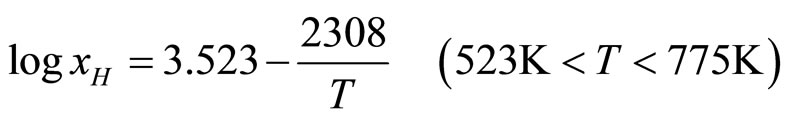 ; (5)
; (5)
 . (6)
. (6)
Later they published [10] a little other coefficients:
 ; (7)
; (7)
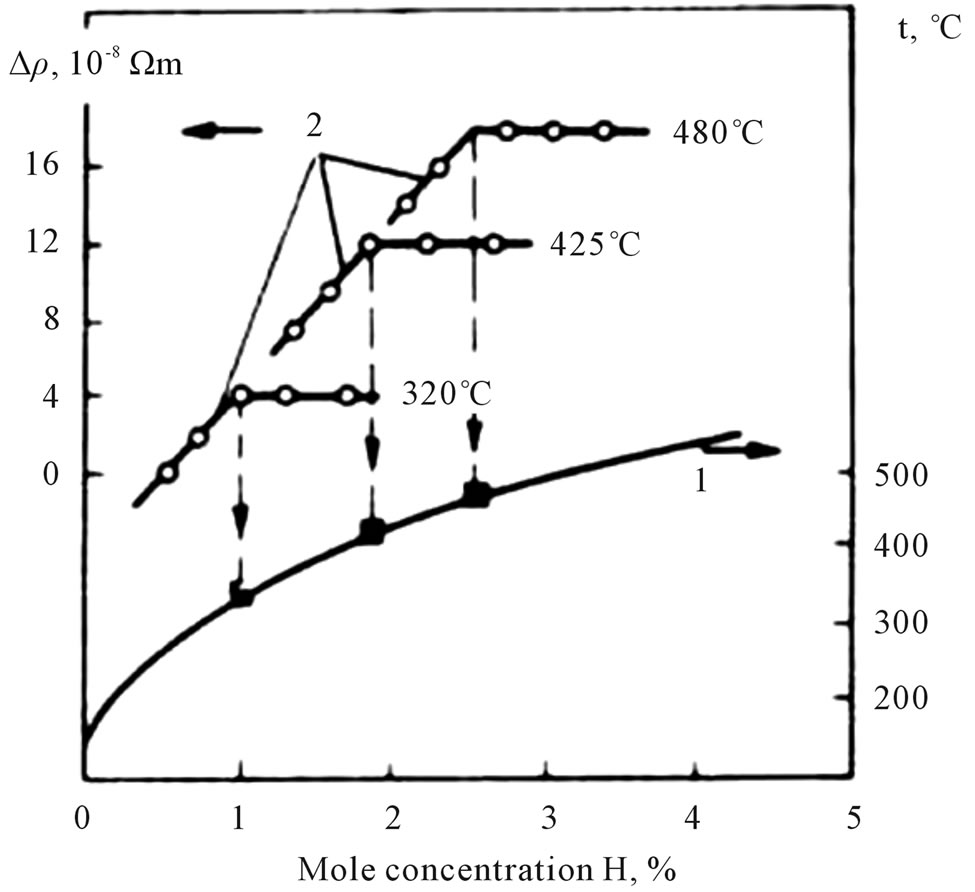
Figure 3. The curve for the solubility (curve 1) of the LiLiH system plotted according to the data on the change in the resistivity of the solution (curve 2).
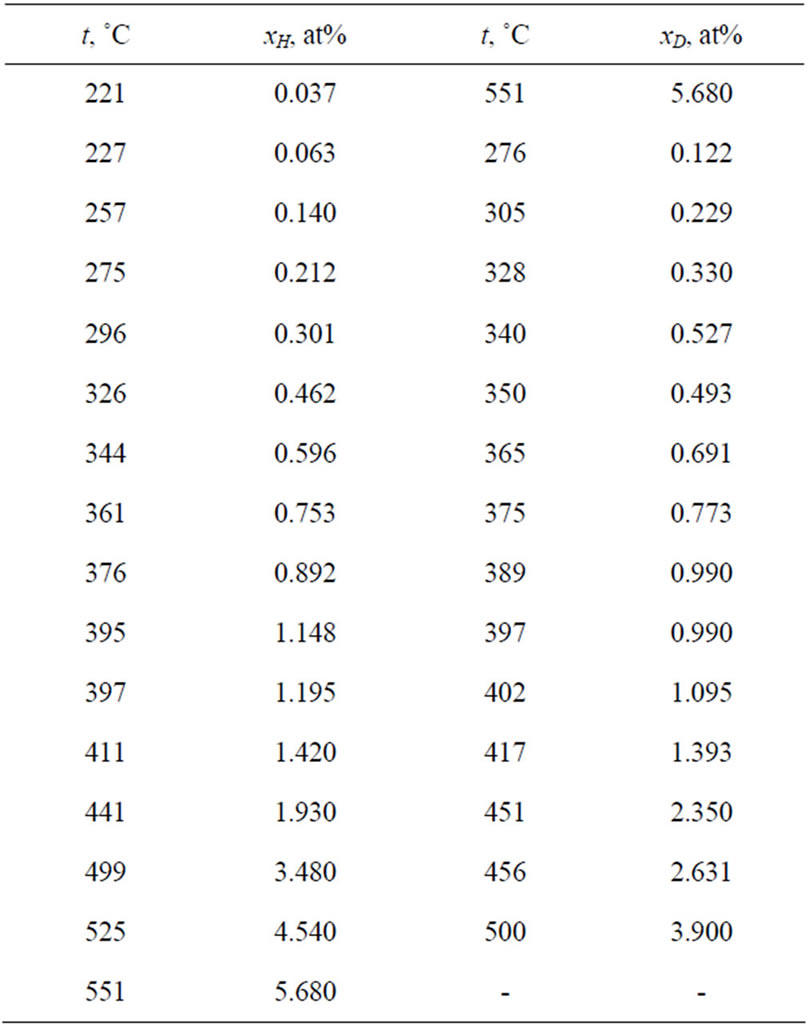
Table 2. Experimental data on the solubilities of hydrogen and deuterium in lithium (x is the atomic concentration of H or D, at%).
 . (8)
. (8)
In equations (5)-(8) x is the atomic concentration of H or D in the solution (%).
These equations yield the values 44.2 and 54.8 kJ/mole for the partial molar enthalpies and 29.2 and 44.2 J/(mole deg) for the partial molar entropies of LiH and LiD, respectively. A comparison of the hydrogen and deuterium solubilities led the authors to conclude that at low temperatures deuterium is less soluble than hydrogen, but at T = 435˚C and x = 1.83%, the situation changes.
The solubility of lithium deuteride in liquid lithium between the eutectic and monotectic temperatures was also determined experimentally by Veleckis et al. [3]. The experimental method used by them consisted of three stages: 1) preparation of the equilibrium solution of Li-LiD, 2) removal of the filtered solution into metallic tubes, and 3) analysis of the samples of the solution to determine whether they contain deuterium.
The deuterium content of the sample was determined by thermal decomposition. Each sealed tube containing the sample was inserted into a container made from silica and then heated to 840˚C for 10 days in order to completely remove the dissolved deuterium. The evolved gas was collected into a container of specified volume, and the deuterium content in it was determined by mass spectrometry. The data obtained by this method are given in Table 3.
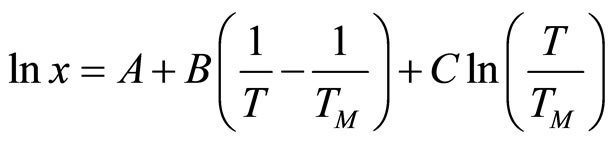
Analysis of the available experimental data on the solubility of hydrogen and deuterium in the temperature interval between the eutectic and monotectic temperatures, respectively, in Li-LiH and Li-LiD systems, and the additional evaluation of these data have shown that the experimental data are best described by an equation of the type
 (9)
(9)
where x is the mole fraction of LiH or LiD in a solution with lithium and TM is the temperature of the monotectic.
The coefficients in Equation (9) and the mean-square deviations of the experimental data, σ, are summarized in Table 4.
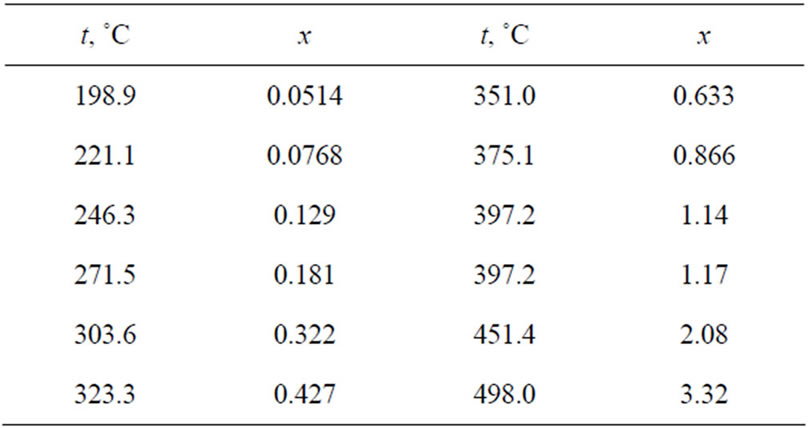
Table 3. Solubility of lithium deuteride in the Li-LiD system from the data of Ref. [3] (x is the molar concentration of LiD, %).
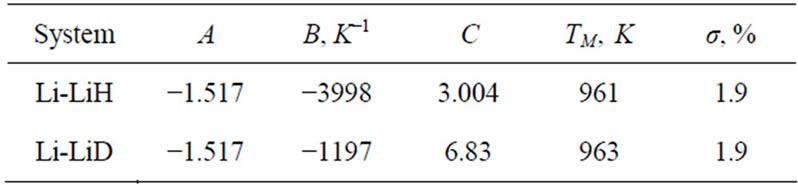
Table 4. Results of analysis of the experimental data on the solubility of hydrogen and deuterium in the Li-LiH and Li-LiD systems. Analysis of the data was based on equation (9).
Decrease in the solidification temperature of lithium due to the dissolution of hydrogen and deuterium in it (curve ac in Figure 1) was studied in Refs. [1,9,11]. The measurements were carried out by the thermal-analysis method (thermography).
Small portions (1 cm3 under normal conditions) of soluble gas were added to pure lithium (30 g of 99.98% pure lithium). The solution was cooled slowly at the rate of 10 deg/h, which made it possible to reliably determine the solidification temperature. Continuous mixing of the solution kept it homogeneous. The melting point of pure lithium was assumed to be 180.49˚C ± 0.02˚C. With increasing atomic concentration of hydrogen or deuterium, the depression of the solidification temperature, ∆T, increased to the maximum value of 0.082˚C at 0.016% H and to 0.075˚C at 0.013% D, which corresponded to the eutectic points of the Li-LiH and Li-LiD systems (Figure 4).
The solidus lines (curve ab in Figure 1) were described under the assumption that the solid and liquid phases in Ref. [11] are ideal phases:
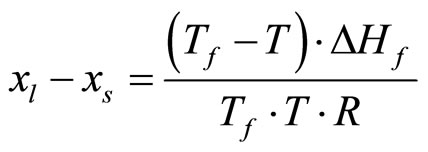 (10)
(10)
Here xt and xs, are the atomic concentrations of hydrogen or deuterium on the liquidus and solidus curves; Tf and ∆Hf are, respectively, the temperature and the heat of fusion of pure lithium; and R is the universal gas constant. The concentration at point b (see Figure 1) for the Li-H system (xb = 0.002%) and for the Li-D system (xb = 0.001%) was determined on the base [12].
4. The Monotectic
The temperature of the monotectic TM of the Li-LiH system was determined for the first time by Messer et al. [4] by the thermographic method. The value TM = 685˚C ± 1˚C obtained by them, however, turned out to be too low, as was indicated in the subsequent experiments, e.g., by Smith and Webb [13]. Analysis of the behavior of the pressure isotherm in the Li-LiH system, when the condensed phase is in equilibrium with the vapor, as a function of the composition of the condensed phase, shows that in the temperature region of the monotectic the isotherm plotted as  is horizontal (see Figure 2)
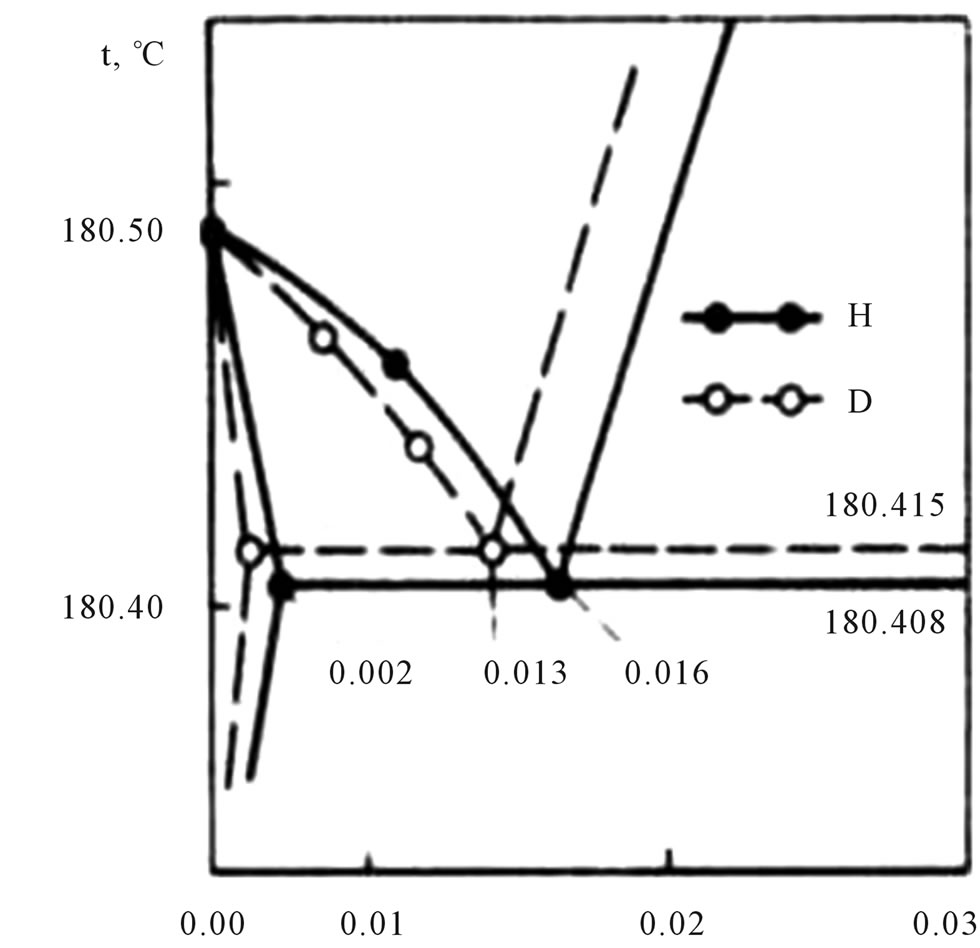
Figure 4. The decrease in the solidification temperature of lithium as a result of dissolution of hydrogen and deuterium.
in the region df (see Figure 1).
The temperature of the monotectic can therefore be determined from the point of intersection of the functions  measured above and below the temperature of the monotectic.
At the temperature of the monotectic, there are four phases in a thermodynamic equilibrium: the vapor phase, a liquid phase with the composition corresponding to point d (see Figure 1), a liquid phase with the composition at point f, and the solid phase with composition at pointy g.
In the temperature region slightly above TM, the vapor phase and the two liquid phases are in equilibrium, whereas in the temperature region slightly below TMy the vapor phase, the liquid phases and the solid phase are in equilibrium. The heat and entropy of dissociation in the reaction
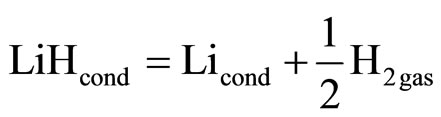 (11)
(11)
which determines the pressure of the vapor phase, at T > TM and T < TM will therefore differ from the heat and entropy of fusion of lithium hydride. This accounts for the discontinuity in the function  at the monotectic temperature.
A consistent analysis of Smith and Webb [13] data for the Li-LiH (LiD) systems near temperatures of ±100 K relative to TM in the form of the relation
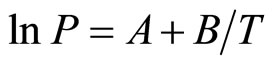 (12)
(12)
yields (the coefficients A and В are assumed to be constant because of the narrow temperature interval) the
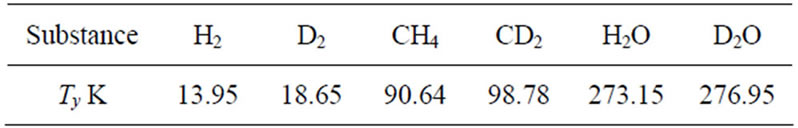
Table 5. Melting point of the isotopic compounds.
following values: TM = 961 ± 2 K for the Li-LiH system and TM = 963 ± 2 K for the Li-LiD system.
For the Li-LiT system, the analysis, which took into account the experimental data of Refs. [14,15] for the entire temperature interval studied (because of their limitation, all data were taken into account), yielded the value TM = 964 ± 3 K.
Smith and Webb [13] and Veleckis [15] also determined the temperatures of the monotectic in Li-LiH (LiD, LiT) systems by analyzing their data on the vapor pressure in the plane region over a broad temperature range. However, the values obtained by them (the data of Ref. 11 are enclosed in parentheses), TM = 694˚C (699.6˚C) for Li-LiH, TM = 690˚C (687.7˚C) for Li-LiD, and TM = 688˚C for Li-LiT, do not seem to be legitimate princeipally because of their isotopic sequence.
The data on the melting point of the isotopic compounds found in the literature show that the heavier isotopic modifications have a higher melting point. In table 5 are several melting points at 105 Pa, taken from the data presented in Refs. [16,17].
Although at the monotectic point the system is, strictly speaking, a solution rather than a pure substance, the isotopic dependence of the melting point (of the monotectic) must obviously reflect this trend.
The use by the authors of Refs. [13,15] of a linear approximation ln [see Equation (12)] over a broad temperature range clearly is a possible source of error in determining the monotectic temperature. The temperature dependence of the heat and entropy of dissociation of LiH (LiD, LiT) in this case could affect the calculation results.
REFERENCES
- P. Hubberstey, R. J. Pulham and A. F. Thunder, Transactions of the Faraday Society, Vol. 72, No. 12, 1973, pp. 432-436.
- E. Veleckis, E. H. Van Deventer and M. Blander, “Lithium-Lithium Hydride System,” The Journal of Physical Chemistry, Vol. 78, No. 19, 1974, pp. 1933-1940. doi:10.1021/j100612a013
- E. Veleckis, R. M. Yonco and V. A. Maroni, “Solubility of Lithium Deuteride in Liquid Lithium,” Journal of the Less Common Metals, Vol. 55, No. 1, 1977, pp. 85-92. doi:10.1016/0022-5088(77)90263-6
- C. E. Messer, E. B. Damon, P. C. Maybury, et al., “SolidLiquid Equilibrium in the Lithium Lithium Hydride System,” The Journal of Physical Chemistry, Vol. 62, No. 2, 1958, pp. 220-222. doi:10.1021/j150560a018
- P. F. Adams, P. Hubberstey and R. J. Pulham, “Review of the Solubility of Non-Metals in Liquid Lithium,” Journal of the Less Common Metals, Vol. 42, No. 1, 1975, pp. 1-11. doi:10.1016/0022-5088(75)90014-4
- P. F. Adams, M. G. Down, P. Hubberstey, et al., “Solubilities, and Solution and Solvation Enthalpies, for Nitrogen and Hydrogen in Liquid Lithium,” Journal of the Less Common Metals, Vol. 42, No. 3, 1975, pp. 325-334. doi:10.1016/0022-5088(75)90052-1
- P. Hubberstey, P. F. Adams, R. J. Pulham, In: Proc. Inter. Conf. on Radiation Effects and Tritium Technology, Oak Ridge National Lab., Oak Ridge, 1975, pp. 117-124.
- R. J. Pulham, P. F. Adams, P. Hubberstey, et al., In: Proc. Intern. Conf. Radiation Effects and Tritium Tech. Fusion Reactors, Vol. 4, Report CONF-750989, Oak Ridge National Lab., Oak Ridge, 1976, pp. 144-157.
- P. Hubberstey, P. F. Adams, R. J. Pulham, et al., “Hydrogen in Liquid Alkali Metals,” Journal of the Less Common Metals, Vol. 49, No. 3, 1976, pp. 253-269. doi:10.1016/0022-5088(76)90039-4
- P. Hubberstey, A. T. Dadd, P. G. Roberts, Proceedings of International Conference on Material Behavior and Physical Chemistry in Liquid Metal Systems, Plenum Press, New York, 1982. pp. 445-454. doi:10.1007/978-1-4684-8366-6_46
- P. F. Adams, P. Hubberstey, R. J. Pulham, et al., “Solubilities, and Solution and Solvation Enthalpies, for Nitrogen and Hydrogen in Liquid Lithium,” Journal of the Less Common Metals, Vol. 42, No. 3, 1975, pp. 285-289. doi:10.1016/0022-5088(75)90052-1
- E. Fromm and H. Jehn, “Bull,” Alloy Phase Diagrams, Vol. 5, No. 3, 1984, pp. 324-326.
- H. M. Smith and R. E. Webb, “Equilibrium Dissociation Pressures of Lithium Hydride and Lithium Deuteride,” Oak Ridge, 1977.
- F. K. Heuman and O. N. Salmon, “The Lithium Hydride, Deuteride and Tritide Systems,” Knolls Atomic Power Lab., Schenectady, 1956.
- E. Veleckis, Journal of Nuclear Materials, Vol. 79, No. 1, 1979, pp. 20-27.
- A. R. Ubbelohde, “Melting and Cristal Structure (Clarendon,” Oxford, 1965, 420 p.
- I. B. Rabinovich, V. Izotopii na Fiziko-Khimicheskie and S. Zhidkostei, “Effect of Isotopy on the Physicochemical Properties of Liquids,” Nauka, Moscow, 1968, p. 308.