Geomaterials
Vol. 2 No. 2 (2012) , Article ID: 18697 , 5 pages DOI:10.4236/gm.2012.22006
Kozeny-Carman Equation and Hydraulic Conductivity of Compacted Clayey Soils
Department of Mineral Resources Engineering, Technical University of Crete, Chania, Greece
Email: stiakaki@mred.tuc.gr
Received January 24, 2012; revised February 27, 2012; accepted March 10, 2012
Keywords: Hydraulic Conductivity; Kozeny-Carman Equation; Specific Surface; Clayey Soils
ABSTRACT
The saturated hydraulic conductivity of a soil is the main parameter for modeling the water flow through the soil and determination of seepage losses. In addition, hydraulic conductivity of compacted soil layers is critical component for designing liner and cover systems for waste landfills. Hydraulic conductivity can be predicted using empirical relationships, capillary models, statistical models and hydraulic radius theories [1]. In the current research work the reliability of Kozeny-Carman equation for the determination of the hydraulic conductivity of compacted clayey soils, is evaluated. The relationship between the liquid limit and the specific surface of the tested samples is also investigated. The resulting equation gives the ability for quick estimation of specific surface and hydraulic conductivity of the compacted clayey samples. The results presented here show that the Kozeny-Carman equation provides good predictions of the hydraulic conductivity of homogenized clayey soils compacted under given compactive effort, despite the consensus set out in the literature.
1. Introduction
As stated by Carrier [2], about a half-century ago Kozeny and Carman proposed the below expression for predicting the permeability of porous media:
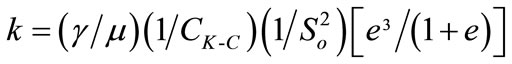 (1)
(1)
where γ = unit weight of permeant, μ = viscosity of permeant; CK-C = Kozeny-Carman empirical coefficient; So = specific surface area per unit volume of particles (1/cm); and e = void ratio. When the permeant is water at 20˚, γ/μ = 9.933 × 10⁴ l/cm·s.
The equation is based on uniform pore sizes and predicts a single value of hydraulic conductivity for a given dry density, [3].
Chapuis and Aubertin [1] expressed the formula (1) as follows:
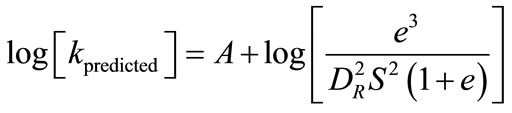 (2)
(2)
where k is in m/s, S is the specific surface of the soil in m2/kg, DR is the specific weight of grains, e the void ratio, and A is equal to 0.29 - 0.51 accordingly to the shape and tortuosity of channels developed in the porous media.
The main difficulty in using the Kozeny-Carman’s equation lies in the determination of the soil specific surface.
Chapuis and Aubertin [1] stated that for plastic - cohesive soils, the specific surface can be estimated from the liquid limit (LL), obtained by standard Casagrande’s method.
They suggested that the estimation of the specific surface can be based on the linear correlation between (1/S) and (1/LL), that is expressed by the equation:
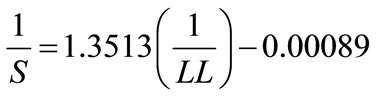 (3)
(3)
where S is in m2/g of solids and LL is in percent.
Equation (3) predicts a value of specific surface within +/– 25% of the measured value when l/LL > 0.167, (that means LL < 60%).
Despite the adoption of the Kozeny-Carman equation, classical soil mechanics textbooks [4,5] maintain that it is approximately valid for sands but it is not valid for clays.
The problem with the clays arises mainly with the clayey particles, because the formula assumes there no electrochemical reactions between the soil particles and the water [2].
In addition, there is a large consensus in the geotechnical literature that the hydraulic conductivity of compacted clays (clay liners and covers) cannot be well predicted by the Kozeny-Carman equation [1].
This work evaluates the validity of the Kozeny-Carman equation in compacted clayey soils, comparing the measured hydraulic conductivities and those predicted using the Kozeny-Carman’s equation.
The relatively thorough evaluation was performed using sand-kaolin mixtures, compacted 2% wet of optimum moisture content, in order to obtain the lower hydraulic conductivity [6,7].
2. Specimen Preparation
Kaolin in powdered form (with particle size less than 0.075 mm), was mixed with different amounts of fine graded sand to obtain various mixtures. Six samples were prepared and named K15S85, K30S70, K50S50, K70S30 K85S15 and K100S0. Each letter denotes the soil used in the mixture (K for kaolin, S for sand) while the following number denotes its percentage proportion.
Mineralogical analyses on representative samples were carried out using the X-ray diffraction (XRD) technique. The analysis revealed that the sand is composed of quartz (67%), calcite (24%), dolomite (6%) and some amount of hendenbergite (3%), while the clay consists mainly of kaolinite (80%) and some quantity of muscovite (20%).
Figure 1 shows the XRD patterns of the sample K30S70. The patterns show that quartz is the dominant mineral of the sample, while kaolinite, calcite, dolomite and muscovite are also present but they appear in a smaller quantity.
The geotechnical program performed in the samplesincluded grain size distribution analysis, specific gravity and Atterberg limits determination, compaction and hydraulic conductivity tests. All the geotechnical tests conducted according to ASTM standards [8,9].
Grain size analyses (using both sieve and hydrometer methods) showed that the sample K100S0 is classified as poorly graded soil, the samples K70S30, K85S15 as well graded, while the term poorly (gap) graded materials applies to samples K50S50, K30S70 and K15S85.
The specific gravity of soil solids was determined by using a water pycnometer, according to ASTM D 854 02 [8].
The liquid limit of the soil samples was determined by means of the flow curve method using the Casagrande device. The plastic limit of the samples was defined by measuring the lowest moisture content at which the soil can be rolled into threads 3 mm in diameter without the threads crumbling. Finally, the plasticity index (that indicates the range of the moisture contents over which the soil is in a plastic condition), was determined as the numerical difference between the liquid limit and the plastic limit.
A summary of the Atterberg limits and specific gravity of the samples, are given in Table 1.
The liquid limit of the mixtures decreases from 60% for soil without sand (K100S0) to 14% as the weight concentration of the sand reaches as high as 85% (K15S85). Moreover the addition of sand in the samples

Figure 1. XRD patterns of K30S70 sample.
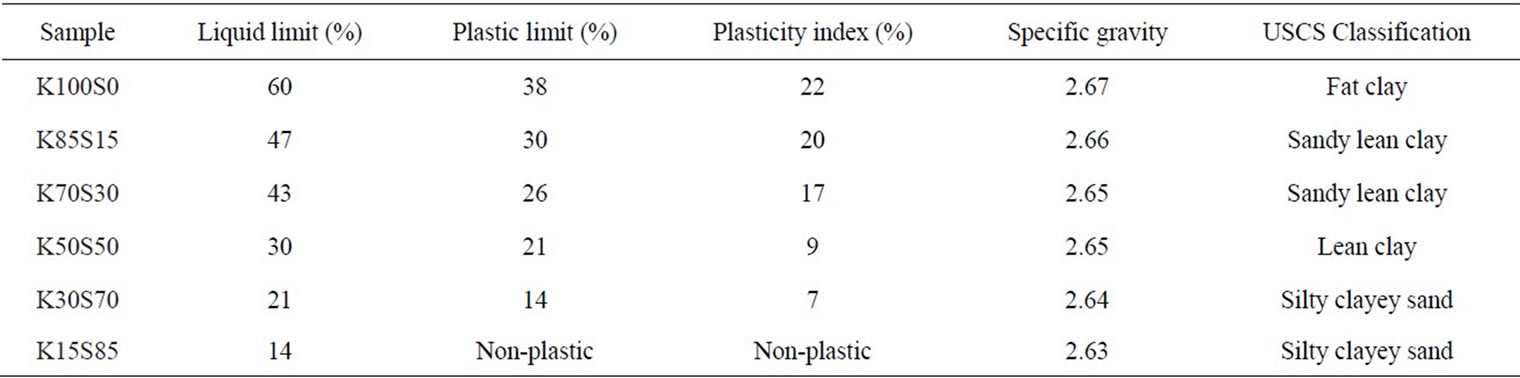
Table 1. Summary of the basic geotechnical results.
shows a reduction of the plasticity index.
The specific gravity of K100S0 (kaolin) was determined to be 2.67 g/cm3 and it does not show notable decrease with the addition of sand to the mixtures (Table 1).
Based on the particle size distribution analysis, Atterberg limits and the Unified Soil Classification System (USCS), the majority of the samples were classified as clay of medium plasticity; while the mixtures K30S70 and K15S85 were classified as silty clayey sand (Table 1).
Further geotechnical properties of the samples, such as particle size distribution, uniformity and concavity coefficients can be found in Gamvroudis [10].
The optimum moisture content (omc) of each sample was determined using the standard Proctor compaction test method.
Each sample was compacted in the compaction mould at selected water contents in order to determine the optimum moisture content and the higher density.
The samples were compacted in three equal layers in a 10.3 cm diameter × 12 cm high standard mould, by dropping a 24.5 Ν hammer through a distance of 30.5 cm, each layer being subjected to 25 blows (according to the recommended standard Proctor compactive effort).
The compaction curves for the different mixtures are shown in Figure 2.
The compaction curves clearly illustrate that the obtained density of the samples is a function of compaction water content. For each compactive effort at the dry side of optimum moisture content, the dry density increases with the increasing water content. This is due to the development of large water film around the particles, which tends to lubricate the particles and makes them easier to be moved about and reoriented into a denser configuration [11].
However, at the wet side of optimum moisture content, water starts to replace soil particles in the compaction mould; and since the unit weight of water is much less than the unit weight of soil, the dry density decreases with the increasing water content.
The optimum moisture content (omc) and the corresponding maximum dry density (ρdmax) for the kaolinite clay (sample K100S10) are equal to 23.7% and 1.49 g/cm3, respectively. Addition of sand decreases the optimum moisture content and increases the maximum dry density, resulting in reduced void ratio (Figure 2).
The standard Proctor compaction test for K30S70 gave an optimum moisture content of 10.2% and a maximum dry density of 1.97 g/cm3, while the K15S85 mixture has an optimum moisture content of 8.8% and a maximum dry density of 1.86 g/cm3 (Figure 2).
For the current research work, the tested samples were prepared in a compaction mould with a dry density about 95% of the maximum dry density and water content 2% wet of optimum, in order to obtain a fairly homogeneous distribution of voids within the material and the lower hydraulic conductivity [7].
3. Specific Surface Determination
The specific surface of the tested samples was measured using the solution absorption technique. The solution used in this study was nitrogen and the apparatus used was the NOVA 2200 of the Quantachrome. The measured specific surface of the samples (Table 2), ranges from 14 m2/g for K100S0 to 2.5 m2/g for K15S85, showing significant reduction with addition of sand to the samples.
Following, an attempt was made to correlate the spe-
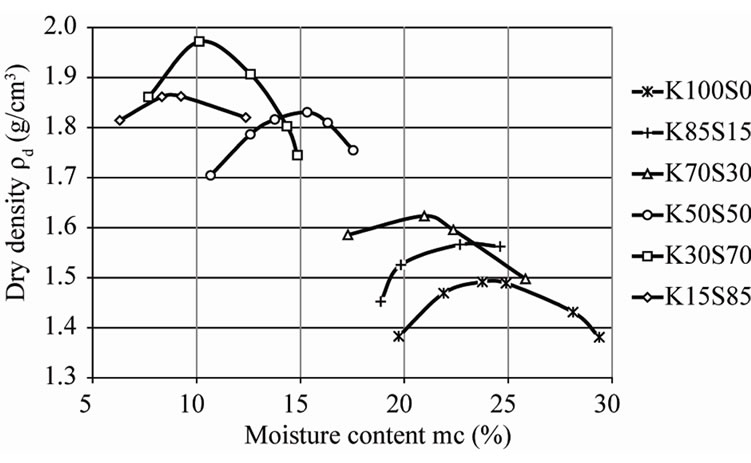
Figure 2. Compaction curves of the sand-clay mixtures.

Table 2. Summary of the basic geotechnical results.
cific surface of the tested soil samples with their liquid limits.
Considering reliable laboratory test data, the measured specific surface values of the samples were plotted against their liquid limit (Figure 3) and the validity of Equation (3) for the prediction of the specific surface of the samples was evaluated.
Based on Figure 3, it may conclude that Equation (3) is not accurate enough to give the values of specific surface for the samples tested.
Based on the measured values of the specific surface for the different samples and their liquid limits, Figure 3 was used to investigate the correlation of these parameters for the tested samples.
The equation that links the specific surface (S) with the liquid limit (LL) for the samples tested is as follows:
 (4)
(4)
4. Determination of Hydraulic Conductivity
Hydraulic conductivities of the samples were estimated using the empirical formula Kozeny-Carman (Equation (2)) taking into account the values of void ratio of each specimen and the specific surfaces determined. The results are presented in Table 3.
In addition, hydraulic conductivity tests were performed on the samples using a rigid wall compaction— mould permeameter under falling head condition, according to ASTM D5856 [9]. Soil was compacted in the compaction mould at water content 2% wet of optimum, using the standard Proctor compaction effort and following the sample was subjected to a falling head permeability test.
Since the hydraulic conductivity of any soil depends highly on the degree of saturation, considerable time was allowed to hydrate the samples.
Next, the soil sample column was connected to a standpipe, in which the water was introduced into the sample.
Measuring the change in head in the standpipe during

Figure 3. Correlation of specific surface with liquid limits.
a specified interval of time, the saturated hydraulic conductivity was determined as follows
 m/sec (5)
where
α the inside area of the standpipe (cm2)A the cross-sectional area of the sample (cm2)L the length of the sample (cm)ho the elevation (cm) of water in the standpipe above the discharge level at time t = 0, and hf the elevation of water in the standpipe above the discharge level at time t (cm).
The hydraulic conductivity tests were performed using tap water and hydraulic gradients of up to 10. The tests were repeated three to five times and the average hydraulic conductivity was corrected to that for 20˚C.
5. Results and Discussions
The values of hydraulic conductivities obtained with a falling head permeameter are 2.58 × 10⁻¹⁰, 3.06 × 10⁻¹⁰, 3.00 × 10⁻¹⁰, 1.30 × 10⁻⁹, and 3.57 × 10⁻⁹ for pure kaoline, 70, 50, 30 and 15% kaolinite-sand mixtures respectively (Table 3).
These values were compared to the values predicted using the Kozeny-Carman equation (Table 3).
Figure 4 shows the predicted against the measured values of the hydraulic conductivities. Few points diverge from the equality line and they represent clayey mixtures, in which the kaolin percent is 30 percent or more. However the deviation is small.
The density of these samples (K100S0, K70S30, K50S50) is higher than the rest (K30S70 and K15S85) and the particle structure is denser.
Therefore, the observed differences between predicted and measured values of the hydraulic conductivity may
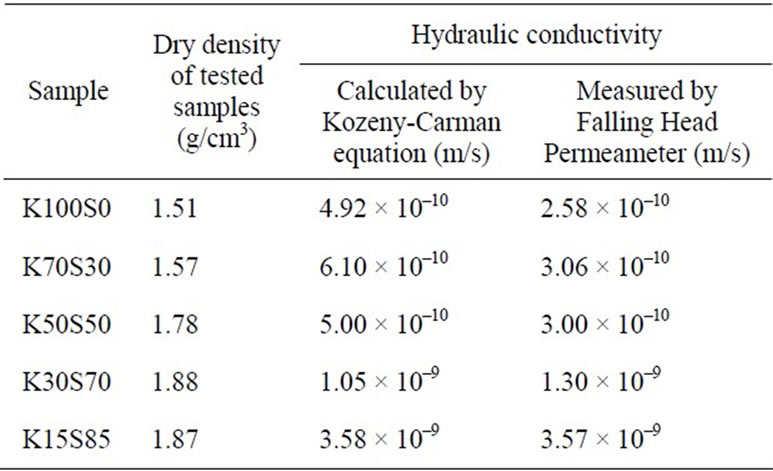
Table 3. Hydraulic conductivities measured and calculated using empirical formulae.
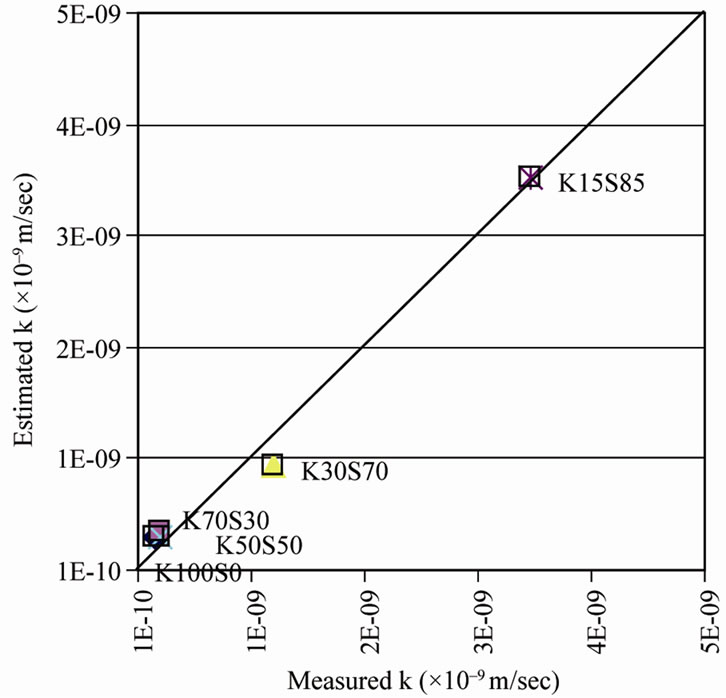
Figure 4. Predicted versus measured hydraulic conductivity of samples.
be attributed to the fact that a portion of the pore space of these samples is occupied by water that is normally non conductive (clay particles).
In addition, the differences may be due to incomplete sample saturation or to theoretical limitations of the equation. In any case, the Kozeny-Charman’s equation gives reasonably accurate estimate of hydraulic conductivity.
6. Conclusions
Based on the aforementioned analysis and results, the following conclusions can be drawn:
Kozeny-Carman’s formula provides good estimations of the hydraulic conductivity of homogenized sand-clay mixtures of low to medium plasticity, compacted under given (2% wet of optimum) moisture content using the standard Proctor compactive effort.
The main difficulty on using the Kozeny-Carman’s equation lies in the determination of the soil specific surface.
A modification of Chapuis-Aubertin equation regarding to the specific surface estimation of the tested samples, was attempted (Equation (4)). The use of the resulted relationship appears to be suitable for quick estimation of specific surface for medium to low plasticity clayey samples and the achievement of their hydraulic conductivity.
7. Acknowledgements
Thanks are due to Mrs. Olga Pantelaki, Scientific Staff of Ore Processing Laboratory, for assessment of the samples specific surface.
REFERENCES
- R. P. Chapuis and M. Aubertin, “On the Use of the Kozeny-Carman Equation to Predict the Hydraulic Conductivity of Soils,” Canadian Geotechnical Journal, Vol. 40, No. 3, 2003, pp. 616-628. doi:10.1139/t03-013
- W. D. Carrier, “Goodbye, Hazen; Hello, Kozeny-Carman,” Journal of Geotechnical and Geoenvironmental Engineering, Vol. 129, No. 11, 2003, pp. 1054-1056. doi:10.1061/(ASCE)1090-0241(2003)129:11(1054)
- D. A. Dixon, J. Graham and M. N. Gray, “Hydraulic Conductivity of Clays in Confined Tests under Low Hydraulic Gradients,” Canadian Geotechnical Journal, Vol. 36, No. 5, 1999, pp. 815-825. doi:10.1139/t99-057
- T. W. Lambe and R. V. Whitman, “Soil Mechanics,” John Wiley & Sons, New York, 1969.
- D. W. Taylor, “Fundamentals of Soil Mechanics,” John Wiley & Sons, New York, 1948.
- D. E. Daniel, “State-of-the-Art: Laboratory Hydraulic Conductivity Tests for Saturated Soils, Hydraulic Conductivity and Waste Contaminant Transport in Soil,” In: D. E Daniel and S. J. Trautwein, Eds., Hydraulic Conductivity and Waste Contaminant Transport in Soil, American Society for Testing and Materials, Philadelphia, 1994.
- B. R. Elsbury, D. E. Daniel, G. A. Sraders and D. C. Anderson, “Lessons Learned from Compacted Clay Liners,” The Journal of Geotechnical Engineering, Vol. 116, No. 11, 1990, pp. 1641-1660. doi:10.1061/(ASCE)0733-9410(1990)116:11(1641)
- ASTM, “Annual Book of ASTM Standards,” ASTM Publication V.04.08, 2004.
- ASTM, “Annual Book of ASTM Standards,” ASTM Publication V.04.09, 2005.
- C. Gamvroudis, “Hydraulic Conductivity of Fine Graded Compacted Geomaterials,” M.Sc. Thesis, Technical University of Crete, Chania, 2010.
- R. D. Holtz, and W. D. Kovacs, “An Introduction to Geotechnical Engineering,” Prentice-Hall, Englewood Cliffs, 1981.