International Journal of Organic Chemistry
Vol.3 No.1A(2013), Article ID:30698,9 pages DOI:10.4236/ijoc.2013.31A002
Evaluation of a Disc Tube Methodology for Nanoand Ultrafiltration of Natural Dissolved Organic Matter (DOM)
Center for Earth System Research and Sustainability, University of Hamburg, Hamburg, Germany
Email: berit.brockmeyer@zmaw.de
Copyright © 2013 Berit Brockmeyer, Alejandro Spitzy. This is an open access article distributed under the Creative Commons Attribution License, which permits unrestricted use, distribution, and reproduction in any medium, provided the original work is properly cited.
Received January 15, 2013; revised March 4, 2013; accepted April 7, 2013
Keywords: Ultrafiltration; Nanofiltration; Dissolved Organic Matter; Disc Tube Module
ABSTRACT
The performance of a disc tube (DT) methodology, originally designed for reverse osmosis (RO) in desalination, and applied here for ultrafiltration (UF) and nanofiltration (NF) of dissolved organic matter (DOM) in a set of fresh (0 ppt), brackish (10 ppt) and saline (30 ppt) waters at low (1 - 2 mg/L), medium (5 - 6 mg/L) and high (10 - 12 mg/L) dissolved organic carbon (DOC) content is presented. The DT module allows for time efficient processing of large volumes of sample and can be operated with RO, NF and UF membranes. We examined the performance of a NF membrane with nominal molecular weight cut-off (MWCO) of 500 Da and UF membranes with MWCO of 1 kDa and 10 kDa. Throughout the experiments we monitored DOM in terms of DOC, UV-absorption coefficient ratios (E2/E3) and the specific UV-absorbance at 254 nm (SUVA254). Detailed protocols for operating the disc tube modules are proposed. The membranes can be efficiently cleaned to provide low carbon blanks (<0.2 mg/L). Calibration confirmed separation of high and low molecular weight standards into the retentate and permeate fractions, respectively. DOC mass balance of fractionated DOM samples showed good recoveries (123% ± 32% at 500 Da, 95% ± 12% at 1 kDa and 99% ± 11% at 10 kDa) (n = 9). The actual retention rates for 500 Da and 1 kDA were close to those reported by the manufacturer (~200 Da and ~3 kDa, respectively). However, the manufacturer’s rated 10 kDa membrane actually retained only DOM > 35 kDa. Salt addition (up to 30 ppt) caused a significant reduction in the amount of high molecular weight (HMW) compounds isolated in the 1 and 10 kDa retentates, due to coiling of macromolecules with increasing ionic strength. These findings underline the importance of stringent operating protocols and the salinity dependence of HMW retention.
1. Introduction
Understanding the properties, fate, behaviour and effects of natural colloids and nanoparticles is crucially dependent on accurate measurements of their size distribution [1]. Ultrafiltration (UF), flow field flow fractionation (FlFFF) and size exclusion chromatography (SEC) have been widely used for separation and fractionation of natural colloids (see also review [1]). While the latter are continuous size fractionation techniques, UF is a discrete fractionation technique, providing limited information about the size spectrum of aquatic colloids heterogeneous in composition and size. UF techniques, however, have the advantage to allow the processing of large sample volumes (10 - 1000 L, depending on the system) for separation of a desired quantity of colloids with nearly 100% recovery (when operated under the right conditions), retaining the particles in the original medium and providing preparative amounts of individual size fractions for further analysis. Commonly used ultrafiltration devices include stirred-cell ultrafiltration units, centrifugal ultrafiltration tubes and cross flow ultrafiltration membranes, such as spiral-wound ultrafiltration and hollowfibre cartridges, flat sheets and tubes [2,3]. Although ultrafiltration techniques have been widely used for fractionation of dissolved organic matter (DOM), only a few controlled laboratory studies aiming at the implementation of stringent experimental protocols and operational procedures during ultrafiltration have been done [2,4]. The disagreement between reported data of size class separations of DOM may be due to varying operation conditions and types of ultrafiltration membranes as well as due to the substantial error in unknown membrane rejection [5], which depends on molecular size and shape, ionic strength, pH and concentration of components [6].
UF membranes do not retain “truly dissolved” (<1 kDa) components, which in natural waters may range from 15 - 90% of the dissolved organic matter [2,7]. This can be accomplished by nanofiltration (NF) or reverse osmosis (RO) membranes, which have pores small enough to retain molecules smaller than 1 kDa.
Common issues that require particular attention in environmental ultrafiltration techniques are 1) operating conditions, such as concentration factor (cf) and crossflow ratio (CFR); 2) integrity of ultrafiltration membranes; and 3) mass balance (recovery) of a specific chemical species. Therefore, we not only tested the applicability of the disc tube (DT) module to fractionate and concentrate natural DOM samples with varying dissolved organic carbon (DOC) and salt concentrations, but also established and controlled the above mentioned criteria 1)-3).
Only few studies using a set of membranes that differ in molecular weight cut-off (MWCO) have been performed upon natural samples, in particular as concerns different ionic strengths and organic matter contents (see review [2]).
DT modules were originally developed for seawater desalination, drinking water purification, and waste water treatment [8]. They efficiently process large volumes of water and can be operated with RO as well as with NF or UF membranes. The membrane area for filtration can be easily adjusted to the amount of sample to be processed, due to variable stacks of membrane cushions within the DT module.
The objective of this study was to investigate the separation characteristics of a DT nanoand ultrafiltration system operated with 3 different MWCO-membranes (500 Da, 1 kDa and 10 kDa) on natural DOM samples at varying salt and DOC concentration, representative of the gradients observed along the fresh to marine water transition. The data obtained will contribute to the pool of knowledge on performance of ultrafiltration systems.
2. Materials and Methods
2.1. Ultraand Nanofiltration System
The UF and NF system consists of a laboratory scale DT module (PALL), a pump, a sample reservoir and permeate flask. The DT module can be operated for high pressure RO, NF and UF applications. The membrane holder for the DT module is made of stainless steel. Pump, reservoir, permeate flask and membrane holder are connected either with tygon tubings (R 3603) or stainless steel pressure hoses. A cogwheel pump (GATHER) is used for UF and NF membranes. The transmembrane pressure of the system, which is the driving force of separation, was controlled by a needle valve and monitored by a pressure gauge (SWAGELOK) at the retentate port.
The separation of permeate and retentate takes place in the fully modular designed DT-module as described in detail in [8]. Briefly, the DT-module consists of the membrane cushions and hydraulic carrier disc (ABSAcrylnitril/Butadien/Styrol Copolymer) inside a stainless steel tubular pressure vessel, with internal O-ring gasket, end flanges with lip seals and a central rod with tailpiece and nut. Cushions and discs are stacked alternating over the central rod, thus open stream channels form and enable the separation of permeate and retentate at the O-ring gasket. Membrane cushions can be stacked to increase operating membrane area. We applied 6 - 7 cushions, providing a membrane are a of 0.65 - 0.75 m2.
For this study we selected two polyethersulfone UF membranes (Omega 1 kDa and 10 kDa, PALL) and one NF membrane (Desal DK 5, GE-OSMONICS). They are polymeric flat thin film composite membranes, in which a polyamide selective layer is supported on a polysulfone layer.
2.2. Sample Collection and Salinity Treatments
For the test of each membrane 150 L water samples were collected from the Outer Alster Lake, which is one of two artificial freshwater lakes with very high DOC (10 - 12 mg/L) within the city limits of Hamburg, Germany. Samples were taken in Nov 2011 for the UF runs (1 and 10 kDa membranes) and in Nov 2012 for the NF run (500 Da membrane). Sample water was filled into 20 L carboys and prefiltered in the laboratory within one hour of sampling with precombusted GFF filter (0.7 µm, Whatman).
From the filtrate, three subsamples A, B and C of varying DOC concentrations were prepared by dilution with ultrapure water (TKA, Germany): A) original DOC (10 - 12 mg/L), undiluted; B) moderate DOC (5 - 6 mg/L), diluted; C) low DOC (1 - 2 mg/L), diluted. A, B and C were further subdivided each into 3 subsamples of 0, 10 and 30 ppt by addition of precombusted seasalt (Tropic Marine, Germany). All subsamples were analysed for bulk DOC concentration and UV-VIS absorption before further processing with the DT module.
2.3. DOC and UV-VIS Analysis
DOM is a heterogeneous mixture present in natural waters with a wide range of molecular weights (MW) and functional groups [9,10], of which chromophoric DOM (CDOM) is a major fraction. Because of the complex nature of DOM, surrogate parameters such as dissolved organic carbon (DOC), absorbance of CDOM at 254 nm and specific (i.e. DOC normalised) absorbance at 254 nm (SUVA 254) are often used to describe its carbon content and aromaticity.
DOC concentrations of all water samples were measured using a high temperature catalytic oxidation analyser (Shimadzu TOC-V) with a Pt catalyst at 680˚C. All generated aqueous samples for DOC analysis were acidified to pH ~ 2 with 85% H3PO4 and purged for 5 min to remove inorganic carbon prior to analysis. Synthetic air was used as a carrier gas in the TOC analyser. Standards (potassium hydrogen phthalate) were analysed immediately prior to and after analysis of 10 samples and were prepared with ultrapure water from a Microlab-Genpure system (TKA, Germany). The detection limit was found at 0.02 mg/L. All samples were analysed in triplicate. Precision, in terms of the relative standard deviation, was better than 2%.
All samples collected for UV-VIS absorption were analysed on an Uvikon 930 Spectrophotometre (Kontron Instruments) in 10 mm cuvettes. Resulting spectra were referenced to a blank spectrum of ultrapure water. UVVIS absorbance coefficient values α(l) were calculated from Equation (1):
 (1)
(1)
where A(l) is the absorbance, λ the wavelength and l the optical pathlength in meters [11]. All absorbance data are expressed as α(l) in units of m−1. From these absorption coefficients we calculated two proxies for organic matter quality according to [10]: E2/E3 (a250:a365) ratio and SUVA254. E2/E3 has previously been related to the aromatic content and the molecular size of DOM, with increasing values indicating a decrease in aromaticiy and molecular size due to the decreased absorption by smaller molecules at longer wavelengths [10,12]. The specific UV absorbance (SUVA254), derived by dividing the absorption coefficient at 254nm by the DOC concentration, has been positively correlated to the percent aromaticity of DOM [13].
3. Experimental Section
3.1. Fractionation by UF and NF
Analogous to the operation of a PALL Centramate system [4] the following steps are involved in operating the DT module:
1) Rinsing the system before use to remove the storage agent.
2) Conditioning the system with the sample. This step helps to remove air from the system, to adjust the system temperature and to prevent possible precipitation or denaturation of biomolecules resulting from contact with flushing solution.
3) Sample processing (concentration/fractionation).
4) System cleaning and determining the cleaning efficiency.
5) Storing membranes.
The terms permeate and retentate used in this text are defined as followed: permeate is the fraction passing through the membrane while retentate is defined as the fraction rejected/concentrated by the membrane.
UF and NF can be carried out in two modes of operation: recirculation and concentration. During recirculation, both, permeate and retentate flow are directed back into the reservoir and thus the reservoir sample volume remains constant. This mode is used for cleaning the membrane and for preconditioning it with natural sample. In the concentration mode, however, the permeate flow is collected in the permeate flask, while the retentate flow is recycled back into the reservoir.
Each membrane type was tested individually to avoid carryover of contamination from or sample losses to former membranes.
3.2. UF and NF Process Variables
Important variables involved in membrane filtration are transmembrane pressure (TMP) and crossflow velocity (CFV) [2]. The TMP is the force that drives fluid through the membrane, carrying along the permeable molecules. The CFV is the rate of the solution flow through the feed channel and across the membrane. The crossflow sweeps away larger molecules and aggregates that are retained on the surface of the membrane, preventing the formation of a concentrated biomolecule layer on the membrane surface that can foul or plug the membrane.
Samples flowing through the narrow feed channel create a pressure drop between the feed and retentate ports. This pressure, which is applied to the membrane, can be further increased by increasing the CFV or by restricting the tubing at the retentate port valve. Using NF and UF effectively means to regulate both the TMP and the CFV to prevent membrane fouling and restricted filtrate flow.
Earlier studies indicate the importance of the cross flow ratio (CFR) for colloid recovery, as higher CFR resulted in increasing recoveries [14]. The CFR is the retentate to permeate flow ratio, calculated as in Equation (2):
 (2)
(2)
where ΨRet and ΨPerm are the flow rate (ml∙min−1) of the retentate and permeate, respectively. A CFR > 15 appears necessary to obtain good colloid recoveries [14]. The risk of concentration polarisation on the membrane (fouling) increases if the CFR is too low. We therefore established optimal membrane filtration parameters for each membrane used in this study by regulating the retentate flow at the needle valve which influenced the TMP, the CFR and the permeate flow rate. Optimized parameters to achieve CFR > 15 are shown in Table 1.
The concentration factor (cf), defined as the ratio of the initial sample volume to the retentate volume, plays a critical role in colloid studies as the concentration of organic carbon in the permeate changes with time or the concentration factor as a consequence of retention of LMW compounds by the membrane. Low cfs lead to overestimation of the concentration in the colloidal fraction when LMW molecules are retained in the retentate [14] and in contrast high cf could possibly cause breakthrough of HMW compounds into the permeate, even if this is reported to be minimal during ultrafiltration [2]. Thus, cfs in the range 10 to 20 have been widely used in recent studies [2].
In order to find the optimal cf for the DT modules we performed time series studies, where we systematically varied cfs for each membrane from 1 to 50. At cfs of 10 - 20, an underestimation of LMW compounds at lower cf can be avoided. No breakthrough of HMW in the LMW fraction was observed at high cfs. At cfs > 20 only marginal further improvement of membrane performance results and therefore we choose cf of 20 as reasonable trade off between optimum performance and minimum process time for the experiments. A cf of 20 was used in all experiments, as consistent cf and CFR are critical in order to ensure reproducible and comparable colloid data.
3.3. Cleaning Procedure and Preservation
Before each use, the membranes were cleaned with ultrapure water to remove NaOH from the system until neutral pH and constant low DOC concentration (system blank) was reached in the permeate and retentate flux. The microbiozid NaN3 was used as membrane storage solution to avoid biofouling and crystallisation on the membrane surface. The pH decreased linearly to constant neutral pH (R2 = 0.99) with increasing volume of distilled water for cleaning. After 30 L of flushing with ultrapure water, permeate and retentate were free of noticeable organic carbon residues. The cleaning step was followed by preconditioning of the membrane with natural prefiltered sample (2 - 10 L) in the recirculation mode, to reduce contamination from the system and to minimize sorptive losses to the membrane and other surfaces
[15]. At the end the sample was discarded. The sample (10 - 100 L) for colloid isolation was afterwards run in the concentration mode until at least 0.5 L were left in the retentate reservoir (depending on the initial feed volume and the used concentration factor).
The established cleaning procedure after filtration of a natural water sample was the same for each membrane:
1) 10 - 30 L of ultrapure water was passed in concentration mode to remove the sample from the system.
2) To remove inorganic salts—especially iron—from the membrane surface, the system was flushed with 4% citric acid and recirculated for 15 minutes afterwards.
3) Pure water was passed in concentration mode to remove the citric acid from the system (until neutral pH).
4) 0.2 N NaOH was used in the recirculation mode for at least 15 minutes to remove, e.g. biomolecules, fats, proteins, starches, polysaccharides, and organic colloids from the membrane surface.
5) NaOH was discarded and the system flushed with the microbiocide Na2S2O5 to prevent biofouling during storage, when the membrane cushions were kept in the DT module.
6) Outside the module, membrane cushions were stored in 0.02% NaN3 at 4˚C in an air and water tight box at manufacturer’s recommendation, as falling dry results in an irreparable loss of separation properties.
3.4. Membrane Retention Test
Damage to ultrafiltration membranes occurs readily by bacterial activity, improper preservation and operating conditions. Therefore, it is important to know the membranes integrity and whether the membranes meet the manufacture’s specifications before sampling. The choice of membrane is usually guided by its nominal molecular weight cut-off (NMWCO), which is typically defined as the equivalent molecular weight of the smallest molecule that would exhibit 90% rejection [2]. We examined the ability to retain standard molecules of known MW, in order to know the retention performance of the used membranes. The retention coefficient (RC) can be derived from Equation (3)
 (3)
(3)
where CPerm and CRet are the concentrations of a standard molecule in permeate and retentate, respectively.
To calibrate the membranes, the separation limit must
Table 1. Optimized transmembrane pressure (TMP), crossflow ratio (CFR), crossflow velocity (CFV) and permeate flow rate in dependence of the rotation speed of the pump for different membranes.

be determined for the individual membranes with defined standards. In the case of complex DOM (e.g. humic substances), no suitable standards with different molecular weights are available. For our calibration we used the following commercially available water-soluble standards: Polyethylene glycol (600, 1000, 1500, 3000, 4000, 6000, 10,000, 35,000 Da; Merck, Germany); sucrose (342 Da; Serva Feinbiochemica, Germany); L-glutamic acid (147 Da; Merck, Germany). All used standard organic colloids have shown wide stability and applicability in various size exclusion studies [2,4].
The membrane retention tests were carried out in the recirculation mode under sample operating conditions. Diluted standard molecules had a carbon concentration of 20 mg/L. These solutions were processed for 1 hour to establish steady-state conditions in both permeate and retentate. At the end, retentate and permeate samples were collected for further analysis of dissolved organic carbon (DOC).
3.5. Recovery of Organic Carbon in Natural Samples
The amount of a specific chemical species recovered from the permeate and retentate fractions should be equal or close to the amount of that chemical species in the initial solution. To address losses of substances during UF and NF, organic carbon recovery (Recov) was calculated from Equation (4) as:
 (4)
(4)
where CPerm and CRet are the organic carbon concentrations in permeate and retentate, respectively, and Cf0 is the initial organic carbon concentration of the prefiltered water in the sample feed.
This approach uses the OM in natural water itself and provides a useful initial indicator of gross contamination.
4. Results and Discussion
4.1. Membrane Retention
The rejection rates for 500 Da and 1 kDA were close to those reported by the manufacturer. A 90% rejection rate translated into a NMWCO of ~3 kDa for the 1 kDa membranes, and ~200 Da for the 500 Da membranes. The difference between observed and nominal MWCO was not unexpected since the used standard molecules were not ideal, i.e. globular. However, the manufacturer’s rated 10 kDa membranes showed an apparent MWCO of >35 kDa, even at 80% retention. One reason might be the mostly aliphatic nature of the chosen standard molecules. This, in turn, implies limits to the transferability to samples with high aromaticity, e.g. aquatic humic substances. Discrepancies between manufacturer’s specification and actual NMWCO have been frequently observed in other studies for new and altered membranes [2].
4.2. Effect of Concentration Factor on DOM and Permeation Model
If chemical species with sizes larger than the MWCO of a specific ultrafiltration membrane (HMW fractions) were quantitatively retained and those with MWs lower than the MWCO (LMW fractions) passed through the membrane with no retention, concentrations of LMW chemical species in the discrete permeate samples would be constant with time or cf [2]. However, concentrations of standard molecules in the permeate increased gradually as the concentration factor increased, as illustrated exemplarily for the 1 kDa membrane in Figure 1(a). The size fractionation during ultrafiltration can be further described using an ultrafiltration permeation model [5,6]. The relationship between the feed concentration (CRet) upstream of the membrane and the concentration factor (cf) at any point during the ultrafiltration process can be described as in Equation (5):
 (5)
(5)
where Cf0 is the initial feed concentration and PC is the permeation coefficient defined as the ratio of CPerm (OC concentration of permeate) to CRet. When PC is <1, log CPerm will increase linearly as log(cf) is increasing. Using time-series data from standard molecules, log(CPerm) was plotted as a function of log(cf) in Figure 1(b).
For the 1 kDa membrane (actual MWCO 3 kDa), PEG 3000 clearly shows a constant permeation coefficient during ultrafiltration with a PC value of 0.19.
The other membranes also clearly showed constant permeation behaviour with PC values < 1, 0.37 (PEG 600 for 500 Da) and 0.10 (PEG 10000 for 10 kDA). This is consistent with the observation that PC values of LMW compounds are always <1 during ultrafiltration [5,6].
4.3. Mass Balance and Recovery
Recoveries of <100% show that losses are greater than contamination, whereas for recoveries of >100% contamination is greater than losses to the system [16]. Overall, organic carbon recoveries of natural samples using the disc tube module were 66% to 202% for all experiments (Figure 2). Organic carbon recoveries were 123% ± 32% for 500 Da, 95% ± 12% for 1 kDa and 99% ± 11% for 10 kDa membranes. Losses and gains of DOC are most pronounced for the nanofiltration membrane with a DOC loss with unsalted samples and a DOC gain with salt treatment (Figure 2). The mass balance in other ultrafiltration studies showed a similar range of recoveries [7,17].

Figure 1. (a) DOC concentrations in Permeate in response to the concentration factor and (b) Permeation behaviour of PEG 3000 for 1 kDa membranes.
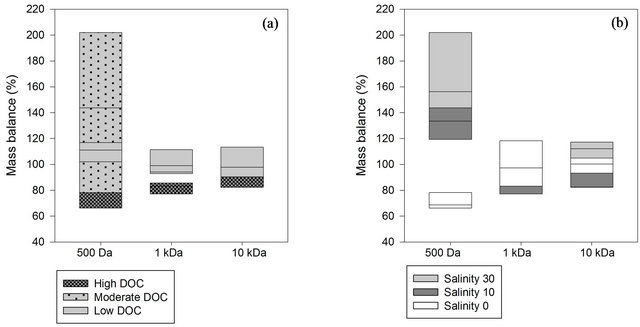
Figure 2. Mass balance box plots of different nanoand ultrafiltration membranes (500 Da, 1 kDa and 10 kDa) according to (a) DOC (high: 10 - 12 mg/L, moderate: 5 - 6 mg/L, and low: 1 - 2 mg/L) and (b) Salinity (0, 10 and 30 ppt).
For the unsalted samples recoveries were 71% ± 5% for 500 Da, 100% ± 14% for 1 kDa and 99% ± 5% for 10 kDa membranes. DOC mass balance values indicate no major loss or contamination of DOC in permeate and retentate fractions as a result of ultrafiltration in the 10 kDa membrane. The 1 kDa membrane with smaller pore sizes showed a loss of DOC at high DOC concentration whereas at low DOC concentration contamination of the system can be seen, with a linear correlation between recovery and initial OC content (R2 = 0.95). The 500 Da membrane showed losses independent of the DOC concentration.
The loss of DOC onto the 1 kDa membrane with high DOC waters can also be seen in the salted treatments. High DOC waters seem to enhance material adsorption to ultrafiltration membranes with small pore sizes, whereas there was no linear correlation of recovery with salinity (R2 = 0.22 and 0.68 for DOC low and DOC moderate).
In principle, losses of colloids to the ultrafiltration system could occur either through concentration polarisation or through sorptive losses. Thus, a high CFR is a preferable mode of operation to enable a substantial tangential flow “self-cleaning”, as higher CFR imply lower laminar permeate flow velocity against which colloids needs to diffuse [14]. The CFR was higher than the recommended minimum CFR of 15 [14], and resulted in acceptable recoveries.
Differences between salted and unsalted sample recoveries were found at the 500 Da membrane where salted samples had OC recoveries >100 %, with a clear correlation between recovery and salinity (R2 = 0.86).
Membrane interaction obviously depended on the samples ionic strength: samples with high ionic strength led to poorer efficiencies, as also found in the study by [7]. In particular the buildup of polyvalent cations such as Ca(II), Al(III), and Fe(III) is known to enhance fouling of nanofiltration membranes by precipitation of calcium carbonate and iron(III) hydroxide [18].
Membrane fouling and cake formation occur, especially at high colloid concentration and high cf, when retained particles build up on the membrane surface and pores clog. Indicators are a relation between recovery and organic carbon in the retentate fractions and a decreasing permeate flow. In our experiments with natural samples, the permeate flow was relatively constant during processing, suggesting the proper functioning of the membranes. Hence, the established process variables and cleaning protocol for the DT module (though time consuming—60 minutes for the 10 kDa, 90 min for the 500 Da and 1 kDa membranes) are efficient (low blank) and provide good separation and low contamination.
4.4. DOM Isolation Efficiency without Salt Addition
Recovery of HMW compounds consistently decreased with increasing MWCO of the membranes from 56% (500 Da) to 13% (10 kDa). The spectral MW proxy E2/E3 declined in the HMW fractions (5.7 - 4.6) compared to initial sample (5.9 ± 0.3) and permeate (7.4 - 6.2), reflecting an increasing proportion of large molecules that absorb at the longer wavelength (E3). Additionally, SUVA254 of all HMW fractions was elevated compared to initial sample (7.2 ± 0.7 L/mg m) and permeates (5.4 - 7.3 L/mg m). Within retentates of different MWCO, SUVA254 increases with MWCO from 7.8 L/mg m (500 Da) to 9.1 L/mg m (10 kDa), reflecting an increased proportion of aromatics along with high molecular weight. These trends in molecular weight and aromaticity were consistent in the low, moderate and high DOC concentration samples.
4.5. Salinity Effects on DOM Isolation
Salt addition to prefiltered samples prior to ultrafiltration substantially affected DOC isolation. Salt addition consistently decreased the proportion of DOC recovered in the retentate fraction. DOC recovery in the retentate fractions of the 1 kDa and 10 kDa membranes dropped from approximately 34% (Sal = 0) to 13% (Sal = 30) and from 12% (Sal = 0) to 6% (Sal = 30), respectively (Figure 3).
A concurrent increase in DOC recoveries with increasing ionic strength (salt addition) occurred in the permeate fractions. These trends were independent of DOC concentration.
Given the satisfactory mass balance of the 1 and 10
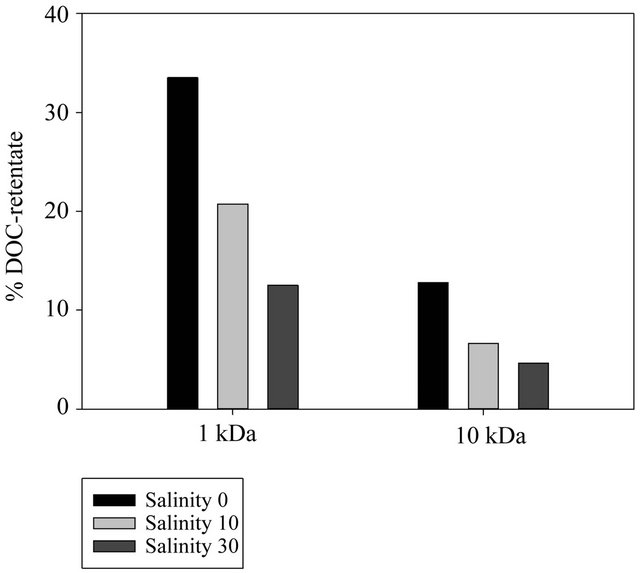
Figure 3. Distribution of HMW compounds.
kDa membranes (Figure 2), it can be assumed that the decrease of DOC in the HMW fraction and subsequent increase in LMW fraction with increasing salinity is the result of elevated DOM molecule throughput across the ultrafiltration membranes.
The spectral characteristics of the retentate fractions responded to salt additions with increasing SUVA254 and decreasing E2/E3 ratio (Figure 4), reflecting a higher proportion of large and aromatic molecules within the slightly reduced amount of DOM in the retentate. The SUVA254 value and E2/E3 in the permeate samples did not change significantly with salt addition. SUVA254 for the 30 ppt retentates (980 L/mg m and 180 L/mg m for 1 kDa and 10 kDa, respectively) were way beyond plausible results for natural DOM according to [13]. The retentate had precipitate, which we redissolved with ultrapure water prior to UV-VIS analysis. Apparently, UVVIS data were compromised by the redissolved precipitate which we identified as epsomite (MgSO4∙7H2O) (data not shown), thus leading to implausibly high SUVAvalues.
For the 500 Da membrane the opposite trend was observed, but in this case the mass balance is correlated linearly with the recovery of HMW compounds (R2 = 0.99) and hence not further discussed here.
A similar effect was also observed in other studies [5,10] that explained this phenomenon with coiling of charged macromolecules upon increasing ionic strength in the background solution and hence their facilitated passage through a given membrane.
5. Conclusions
Actual MW cut-off of ultrafiltration membranes does not necessarily conform to the nominal MW cut-off provided by the manufacturers. Testing the membranes for integrity and rejection rate with standard compounds is a nec-
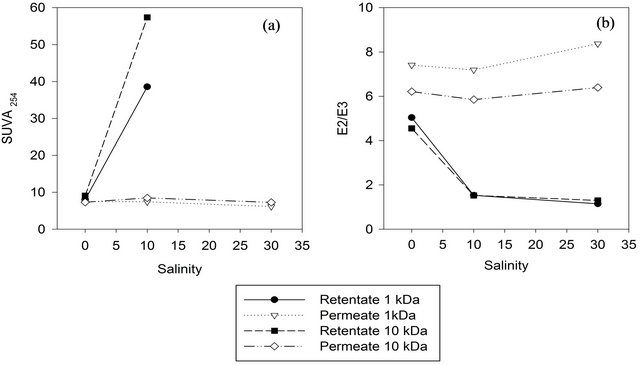
Figure 4. SUVA254 and E2/E3 (250 nm: 365 nm) values for retentate and permeate when isolated with different salinities and MWCO.
essary procedure to verify the actual MWCO and thus make DOM separation results comparable between different studies.
Here, we present a detailed, successfully tested operating protocol (cleaning, conditioning, concentration factor, cross flow rate) for a specific separation technology: the disc tube RO module and a given set of nanoand ultrafiltration membranes, applied to a set of water samples covering a wide range of DOC (1 - 12 mg/L) and salinities(0 - 30 ppt).
Increasing salinity significantly reduced DOM recovery within the retentate fraction, suggesting potential alteration of the original MW distribution in a sample as salts accumulate in the retentate during filtration. Optimum DOC mass balances (reflecting procedural gains and losses of DOC during filtration) close to 100% were obtained with the low DOC samples, recommending dilution of high DOC samples prior to filtration as a means to improve separation performance.
From variation of concentration factors up to 50 we recommend 20 as the cf of choice to assure no underestimation of the LMW permeate DOC, with no significant improvements in performance at cfs above.
REFERENCES
- M. Baalousha, B. Stolpe and J. R. Lead, “Flow FieldFlow Fractionation for the Analysis and Characterization of Natural Colloids and Manufactured Nanoparticles in Environmental Systems: A Critical Review,” Journal of Chromatography A, Vol. 1218, No. 27, 2011, pp. 4078- 4103. doi:10.1016/j.chroma.2011.04.063
- L. Guo and P. H. Santschi, “Ultrafiltration and Its Applications to Sampling and Characterisation of Aquatic Colloids,” In: K. J. Wilkinson and J. R. Lead, Eds., Environmental Colloids and Particles, IUPAC Series on Analytical and Physical Chemistry of Environmental Systems, Vol. 10, John Wileys & Sons, Hoboken, 2006, pp. 159- 221.
- A. G. Fane, C. Y. Wang and R. Wang, “Membrane Technology for Water: Microfiltration, Ultrafiltration, and Reverse Osmosis,” In: K. Hanaki and T. Vereijken, Eds., Treatise on Water Science: Water Quality Engineering, Vol. 4, Elsevier, Amsterdam, 2011, pp. 301-335. doi:10.1016/B978-0-444-53199-5.00091-9
- B. Schwalger and A. Spitzy, “Separation of Natural Organic Colloids with a PALL Tangential Flow Filtration System,” Water Science and Technology, Water Supply, Vol. 9, No. 5, 2009, pp. 583-590. doi:10.2166/ws.2009.574
- L. Guo and P. H. Santschi, “A Critical Evaluation of the Cross-Flow Ultrafiltration Technique for Sampling Colloidal Organic Carbon in Seawater,” Marine Chemistry, Vol. 55, No. 1-2, 1996, pp. 113-127. doi:10.1016/S0304-4203(96)00051-5
- J. Kilduff and W. J. Weber, “Transport and Separation of Organic Macromolecules in Ultrafiltration Processes,” Environmental Science and Technology, Vol. 26, No. 3, 1992, pp. 569-577. doi:10.1021/es00027a021
- C. Guéguen, C. Belin and J. Dominik, “Organic Colloid Separation in Contrasting Aquatic Environments with Tangential Flow Filtration,” Water Research, Vol. 36, No. 7, 2002, pp. 1677-1684. doi:10.1016/S0043-1354(01)00374-8
- T. A. Peters, “Desalination and Industrial Waste Water Treatment with the ROCHEM Disc Tube Module DT,” Desalination, Vol. 83, No. 1-3, 1991, pp. 159-172. doi:10.1016/0011-9164(91)85092-9
- E. E. Chang, Y.-W. Chen, Y.-L. Lin and P.-C. Chiang, “Reduction of Natural Organic Matter by Nanofiltration Process,” Chemosphere, Vol. 76, No. 9, 2009, pp. 1265- 1272. doi:10.1016/j.chemosphere.2009.04.053
- B. R. Kruger, B. J. Dalzell and E. C. Minor, “Effect of Organic Matter Source and Salinity on Dissolved Organic Matter Isolation via Ultrafiltration and Solid Phase Extraction,” Aquatic Science, Vol. 73, No. 3, 2011, pp. 405- 417. doi:10.1007/s00027-011-0189-4
- C. M. Hu, F. E. Muller-Karger and R. G. Zepp, “Absorbance, Absorption Coefficient, and Apparent Quantum Yield: A Comment on Common Ambiguity in the Use of These Optical Concepts,” Limnology and Oceanography, Vol. 47, No. 4, 2002, pp. 1261-1267.
- J. Peuravuori and K. Pihlaja, “Molecular Size Distribution and Spectroscopic Properties of Aquatic Humic Substances,” Analytica Chimica Acta, Vol. 337, No. 2, 1997, pp. 133-149. doi:10.1016/S0003-2670(96)00412-6
- J. L. Weishaar, G. R. Aiken, B. A. Bergamschi, M. S. Fram, R. Fugii and K. Mopper, “Evaluation of Specific Ultraviolet Absorbance as an Indicator of the Chemical Composition and Reactivity of Dissolved Organic Carbon,” Environmental Science and Technology, Vol. 37, No. 20, 2003, pp. 4702-4708. doi:10.1021/es030360x
- J. Larsson, O. Gustafsson and J. Ingri, “Evaluation and Optimization of Two Complementary Cross-Flow Ultrafiltration Systems toward Isolation of Coastal Surface Water Colloids,” Environmental Science and Technology, Vol. 36, No. 10, 2002, pp. 2236-2241. doi:10.1021/es010325v
- K. O. Buesseler, J. E. Bauer, R. F. Chen, T. I. Eglinton, O. Gustafsson, W. Landing, K. Mopper, S. B. Moran, P. H. Santschi, R. VernonClark and M. L. Wells, “An Intercomparison of Cross-Flow Filtration Techniques Used for Sampling Marine Colloids: Overview and Organic Carbon Results,” Marine Chemistry, Vol. 55, No. 1-2, 1996, pp. 1-31. doi:10.1016/S0304-4203(96)00046-1
- O. Gustafsson, K. O. Buesseler and P. M. Gschwend, “On the Integrity of Cross-Flow Filtration for Collecting Marine Organic Colloids,” Marine Chemistry, Vol. 55, No. 1-2, 1996, pp. 93-111. doi:10.1016/S0304-4203(96)00050-3
- A. Wilding, R. Liu and J. L. Zhou, “Dynamic Behaviour of River Colloidal and Dissolved Organic Matter through Cross-Flow Ultrafiltration System,” Journal of Colloid and Interface Science, Vol. 287, No. 1, 2005, pp. 152-158. doi:10.1016/j.jcis.2005.01.114
- M. Serkiz and M. Perdue, “Isolation of Dissolved Organic Matter from the Suwannee River Using Reverse Osmosis,” Water Research, Vol. 24, No. 7, 1990, pp. 911-916. doi:10.1016/0043-1354(90)90142-S