J. Biomedical Science and Engineering, 2010, 3, 618-624
doi:10.4236/jbise.2010.36084 Published Online June 2010 (http://www.SciRP.org/journal/jbise/
JBiSE
).
Published Online June 2010 in SciRes. http://www.scirp.org/journal/jbise
Automated neurosurgical video segmentation and
retrieval system
Engin Mendi1, Songul Cecen2, Emre Ermisoglu2, Coskun Bayrak2
1Department of Applied Science, University of Arkansas at Little Rock, Little Rock, USA;
2Department of Computer Science, University of Arkansas at Little Rock, Little Rock, USA.
Email: esmendi@ualr.edu; sxcecen@ualr.edu; exermisoglu@ualr.edu; cxbayrak@ualr.edu
Received 18 January 2010; revised 25 February 2010; accepted 6 March 2010.
ABSTRACT
Medical video repositories play important roles for
many health-related issues such as medical imaging,
medical research and education, medical diagnostics
and training of medical professionals. Due to the in-
creasing availability of the digital video data, index-
ing, annotating and the retrieval of the information
are crucial. Since performing these processes are
both computationally expensive and time consuming,
automated systems are needed. In this paper, we pre-
sent a medical video segmentation and retrieval re-
search initiative. We describe the key components of
the system including video segmentation engine, im-
age retrieval engine and image quality assessment
module. The aim of this research is to provide an
online tool for indexing, browsing and retrieving the
neurosurgical videotapes. This tool will allow people
to retrieve the specific information in a long video
tape they are interested in instead of looking through
the entire content.
Keywords: Video Processing; Video Summarization;
Video Segmentation; Image Retrieval; Image Quality
Assessment
1. INTRODUCTION
Developing countries suffer from lack of access to the
medical expertise. Due to the inadequacy of trained medi-
cal professionals, the health maintenance system of the
country may face variety of problems which will directly
affect individual’s quality of life and also entire well-
being of society. Limitations in accessing to the medical
expertise may also exist in small regional hospitals &
health-care centers in rural places in developed countries.
Therefore, connecting as many hospitals as possible to a
medical information system from regional level to the
state and national levels and ultimately to the global
level, which is simply illustrated in Figure 1, would be
very beneficial in terms of improved standard of medical
practice and educational aspects for medical students
and staff who can not reach to the medical resources, due
to resource, geographical, and time constraints.
Our research is to show not only the importance of the
accommodation of the massive amount of data for edu-
cational use but also the preservation of a life long ex-
perience of pioneers in the field of neurosurgery for fur-
ther use via automatically defining a logical structure of
the video content. Since only a few fortunate ones get a
chance to be with these experts to see how they perform
such complex operations. Therefore, with this service
the boundaries can be expended so that [1].
The educational needs of residents can be comple-
mented by allowing access in a timely efficient manner.
The educational needs of medical students can be
provided by allowing access.
The knowledge enhancement needs of Neurosur-
geons around the world with special benefits to devel-
oping countries can be supported by allowing access.
The help in teaching of operating room (OR) nurses
and physician assistants can be provided.
The foundation for future research related to simu-
lation technology can be constructed.
The goal of this system is summarized in Figure 2.
The system has 3 main components which are video seg-
mentation engine, image retrieval engine and image qual-
ity assessment module.
2. VIDEO SEGMENTATION ENGINE
Medical video libraries are dedicated to many health-
related applications such as medical imaging, medical
research and education, medical diagnostics and training
of medical professionals. Due to the rapid development
in production, storage and distribution of multimedia con-
tent, the video data of these medical repositories can be
directly transmitted to the people via internet. However,
due to the huge size of the videos, very large bandwidth
will be required. Additionally, it will be very difficult
reaching a certain portion of the video. For instance, when
a medical surgeon or student wants to look through a spe-
E. Mendi et al. / J. Biomedical Science and Engineering 3 (2010) 618-624
Copyright © 2010 SciRes.
619
JBiSE
Figure 1. Work-flow of the system.
Figure 2. System architecture.
cific part of a 15-hour neurosurgery videotape, they will
have to browse the entire content of the video in order to
find the right part they want to see. Our video segmenta-
tion engine generates a concise summary of the seman-
tics in the neurosurgical videotape to help them browse
and search the large amount of video data. The architec-
ture of the engine is depicted in Figure 3. As shown in
Figure 3, an MPEG video source comprises a group of
video shots, and a video shot is an unbroken sequence of
frames captured from one perspective. The engine parti-
tions a video sequence into a set of shots, and some key
frames are extracted to represent each shot. Finally key
frames are collected in the video abstract database.
Video segmentation is the central process for auto-
matic video indexing, browsing and retrieval systems. It
aims partitioning a video sequence into meaningful seg-
ments and extracting a sequence of key frames, that each
key represents the content of corresponding video seg-
ment. The video sequence is divided into meaningful
segments (shots) which are the basic elements of index-
ing, and then each shot is represented by key frames.
These frames are indexed by extracting spatial and tem-
poral features.
Video segmentation includes two major steps: 1) Shot
boundary detection and 2) Key frame extraction. Shot
boundary detection targets breaking up the video into
meaningful sub-segments. Key frame extraction involves
selecting one or multiple frames that will represent the
content of each shot.
In our work, we segmented the shots by detecting the
boundaries via color histogram differences and self-
similarity analysis. In color histogram differences, RGB
color space is converted to HSV space, and then color-
quantization is applied to HSV color space. Finally the
differences of HSV histograms between consecutive fra-
mes are computed to determine the peaks representing
the shot boundaries [1,2]. In self-similarity analysis, HSV
feature vectors of the frames within the video data are
visualized with a two-dimensional matrix by applying a
similarity metric [2].
Key frame extraction is the second major process of
video segmentation. We used four approaches in order to
select the key frames:
1) The first is the traditional k-means clustering, de-
termining video summaries with a specific number of
frames, which will represent the entire video content.
The number of the key frames is specified by the user.
The frames closest to the cluster centroids are selected as
key frames [2].
2) The second is the dominant set clustering that auto-
matically decide the number of key frames according to
the similarity of the data without any initial decision of
cluster number. The clustering is based on dominant sets
which are the representation of an edge-weighted graph
as a similarity matrix [2-4].
3) The third is based on salient region detection and
structural similarity. Saliency maps representing the at-
tended regions are produced from the color and lumi-
nance features of the video frames. Introducing a novel
signal fidelity measurement-saliency based structural si-
milarity index, the similarity of the maps is measured.
Figure 3. The architecture of the video segmentation engine.
620 E. Mendi et al. / J. Biomedical Science and Engineering 3 (2010) 618-624
Copyright © 2010 SciRes.
Based on the similarities, shot boundaries and key frames
are determined [5].
4) The fourth approach, called “index-based retrieval
(i-Base)”, is based on Discrete Cosine Transform (DCT)
and Self Organizing Map (SOM). It allows user to
quickly find a particular point within a certain domain
and/or determine if the domain is relevant to the need.
i-Base forms a hierarchy from the uniquely represented
shots by using frames. User then can map only the rele-
vant section in the source with the request issued. The
idea of 'just request-to-response mapping' prevents not
only the unwanted information retrieval but also saves
time and bandwidth [1].
Figure 4. User interface of the tool.
more than 1,000 lung CT images [6].
Our image retrieval engine delivers the image results
from our video abstract database, taking advantage of
visual features of the images. Figure 6 shows the archi-
tecture of our image retrieval engine. Several image fea-
tures representing the visual content of the images in
video abstract database and query image are extracted.
The images in video abstract database are the key frames
of the neurosurgical videotapes previously extracted by
the video segmentation engine.
Figure 4 shows the user interfaces of the video seg-
mentation system, allowing the user to set the parame-
ters. Currently, we are in the process of transferring our
tool over the WEB environment. A sample of key frame
set of a neurosurgical training video data, presented to
the user is depicted in Figure 5.
3. IMAGE RETRIEVAL ENGINE
Based on the similarity metric, how close query image
and key frames are measured. Retrieval results are then
ranked according to the similarity score and delivered to
make available to receivers over broadband network.
Currently, all web-browser based image search engines
are based on textual data, that images are associated by
annotations and then searched using keywords. In terms
of medical images, the most of the medical image in-
formation is not accessible or limited to one or two da-
tabases that can be searched with key words. As medical
images can not be fully described by textual information,
keywords are not sufficient enough to retrieve relevant
medical images from large databases. For instance, for
the “lung CT” key term, Google is able to retrieve only
130 image results. However, only Health Education As
sets Library (HEAL, http://ww w.healcentral.org/) contains
Content-based image retrieval (CBIR) is a technique
using visual descriptors to search images from image
databases according to users’ needs. It aims effectively
searching and browsing of large image digital libraries
based on automatically extracted image features. In a
typical CBIR system, features of every image in the da-
tabase have been extracted and then compared with the
query image. We have conducted a preliminary evalu-
Frame 174 Frame 224 Frame 324 Frame 474 Frame 599 Frame 654
Frame 680 Frame 724 Frame 899 Frame 974 Frame 1049 Frame 1174
Frame 1324 Frame 1342 Frame 1374 Frame 1524 Frame 1649 Frame 1974
Figure 5. The 18 key frames of a neurosurgical (right frontal craniotomy) video sequence of 2500 frames presented to the user.
JBiSE
E. Mendi et al. / J. Biomedical Science and Engineering 3 (2010) 618-624
Copyright © 2010 SciRes.
621
JBiSE
Figure 6. The architecture of the image retrieval engine.
ation on the precision performance of following two ap-
proaches:
1) The first is comparing images using color histo-
grams. Color is one of the most important image features
for CBIR. A color histogram is the representation of fre-
quency distribution of color bins in an image. Color his-
tograms are widely used in comparison of images, since
they are robust to change in translation, rotation and an-
gle of view. We have used two different color spaces,
RGB and HSV. We quantized the RGB color space as
well as HSV space to reduce the number of bins, using
256 colors (16 levels for each R, G and B channels in
RGB space;16 levels for H channel, 4 levels for S chan-
nel and 4 levels for V channel in HSV space). Finally, to
evaluate the similarity between query image and the im-
age in the video abstract database, we have computed the
Euclidean distance between corresponding color histo-
grams [7].
2) The second is comparing images using two image
fidelity measurements. We have used mean squared error
(MSE) and structural similarity (SSIM) index [8] to quan-
tify the similarity of images [7]. MSE compares two
images on a pixel-by-pixel basis, whereas SSIM consid-
ers structural information.
We have conducted a preliminary evaluation on the
precision performance of above four approaches. We
have used a subset of COREL Image Database [9,10]
which is available at http://wang.ist.p su.edu/docs/related.
shtml. The database contains 10 image classes with 100
images each (1000 images in total). The classes are: Af-
rica, Beach, Buildings, Buses, Dinosaurs, Flowers, Ele-
phants, Horses, Food and Mountains.
We measured the retrieval effectiveness on the preci-
sion performance of each approach. The detailed preci-
sion results are shown in Table 1. Average precisions are
computed by taking every image in a class as query im-
age. As can be seen, the precision performances of the
algorithms change with different classes. According to
the overall results, HSV histogram is the most effective
approach among others.
4. IMAGE QUALITY ASSESSMENT
MODULE
Image quality assessment is an important part of content
delivery over networks since network conditions vary
for individual users and also digital images are subject to
a wide variety of distortions during processing, storage
and transmission, any of which may result in a degrada-
tion of visual quality [8,11]. Therefore quantifying the
image quality degradation occurring in a system would
be very beneficial, so that the quality of the images and
videos produced can be controlled and adjusted. For in-
stance, a system can examine the quality of videos and
images being transmitted in order to control and allocate
streaming or downloading resources. Moreover, a qual-
ity assessment module can assist in the optimal design of
pre-filtering and bit assignment algorithms at the en-
coder and of optimal reconstruction, error concealment,
and post-filtering algorithms at the decoder [8].
On the other hand, according to a recent research of
Microsoft [12]; due to the difficulty of the image quality
assessment problem, current web-browser based image
search engines lack of user requirements, because there
is no effective and practical solution to allow an under-
standing of image content, which fits the user needs.
Image quality assessment research would greatly help
improve users’ browsing experiences.
Therefore we have been designing a quality assess-
ment module automatically predicting perceived image
quality. This problem is more competitive in medical
imagery, because medical imagery may play crucial role
in many health-related issues such as diagnostic design,
patient-care, training and education of medical profes-
sionals and students. The framework of the module is
depicted in Figure 7. We have already developed a novel
objective image quality metric which is superior to the
existing metrics in the literature. We have also validated
our metric against a large set of subjective ratings gathered
Table 1. Precision of 10 image categories for top 30 matches.
Histogram-based Similarity-based
Image Class RGB HSV SSIM MSE
African People 23.03 40.57 8.33 0.33
Beach 13.4 22.63 33 33.33
Buildings 18.6 24.73 14.33 3.67
Buses 31 47.03 25.33 3.67
Dinosaurs 34.83 44.6 95.33 97.67
Elephants 18.8 19.57 25.33 35
Flowers 33.3 32.7 67 90
Horses 16.83 81.93 21.33 43.67
Mountains and
glaciers 13.9 38 19 31
Food 55.03 31.3 10.33 1.67
AVERAGE 25.87 38.31 31.93 34.00
622 E. Mendi et al. / J. Biomedical Science and Engineering 3 (2010) 618-624
Copyright © 2010 SciRes. JBiSE
Figure 7. The framework of the image quality assessment
module.
for a public image database. Currently we have been
working on a subjective image quality assessment for
neurosurgery imagery. This assessment will be based on
expert opinions of a group of neurosurgeons from UAMS,
by determining fixation points on the images while track-
ing their eye movements.
Image quality assessment has a great importance in sev-
eral image and video processing applications such as filter
design, image compression, restoration, denoising, recon-
struction, and classification. The goal of image quality
assessment is predicting image quality of display output
perceived by the end user. Multimedia contents are sub-
jected to the variety of artifacts during acquisition, proc-
essing, storage and delivering, which may lead to reduc-
tions in the quality. Our image quality assessment module
dynamically monitor and adjust the image quality, so that
the output quality of the image or video presented to the
user can be maximized for available resources such as
network conditions and bandwidth requirements.
Image quality metrics can be classified into 2 catego-
ries: Subjective and objective metrics. The most reliable
way to measure of image quality is to look at it because
human eyes are the ultimate viewer and images are eva-
luated by humans. Subjective evaluation by orienting on
human visual system is determined by Mean Opinion
Score (MOS) which relies on human perception. On the
other hand, objective metrics are also very valuable to
(a) (b)
(c) (d)
Figure 8. Scatter plots of subjective/objective scores on LIVE Database. Red points (+) and blue points (x) denote JPEG and
PEG2000 images, respectively. (a) SSIM; (b) S-SSIM; (c) VIF in pixel domain; (d) S-VIF in pixel domain. J
E. Mendi et al. / J. Biomedical Science and Engineering 3 (2010) 618-624
Copyright © 2010 SciRes.
623
JBiSE
predict perceived image quality. They are based on mathe-
matical models that approximate results of subjective
quality assessment. Amongst the objective quality met-
rics, full reference metrics require complete availability
of original non-distorted reference image which will be
compared with the corresponding distorted image, while
reduced reference and no reference metrics require lim-
ited and no availability of this, respectively.
We developed a new image quality metrics, S-SSIM
(saliency-based structural similarity index) and S-VIF
(saliency-based visual information fidelity), based on
frequency-tuned salient region detection introduced by
[13]. Saliency maps are produced from the color and
luminance features of the image. SSIM [8] index and
visual information fidelity (VIF) in pixel domain [14]
are modified by the weighting factors of the saliency
maps.
We validated our approach using LIVE Image Data-
base [15] as test bed. The database contains 29 original
images and 460 distorted images (227 JPEG2000 images
and 233 JPEG images) with subjective scores for each
image. Non-linear regression analysis has been performed
to fit the data. The Pearson correlation coefficient is used
to measure the association between subjective and ob-
jective scores. Our results showed that our technique is
more correlated with human subjective perception.
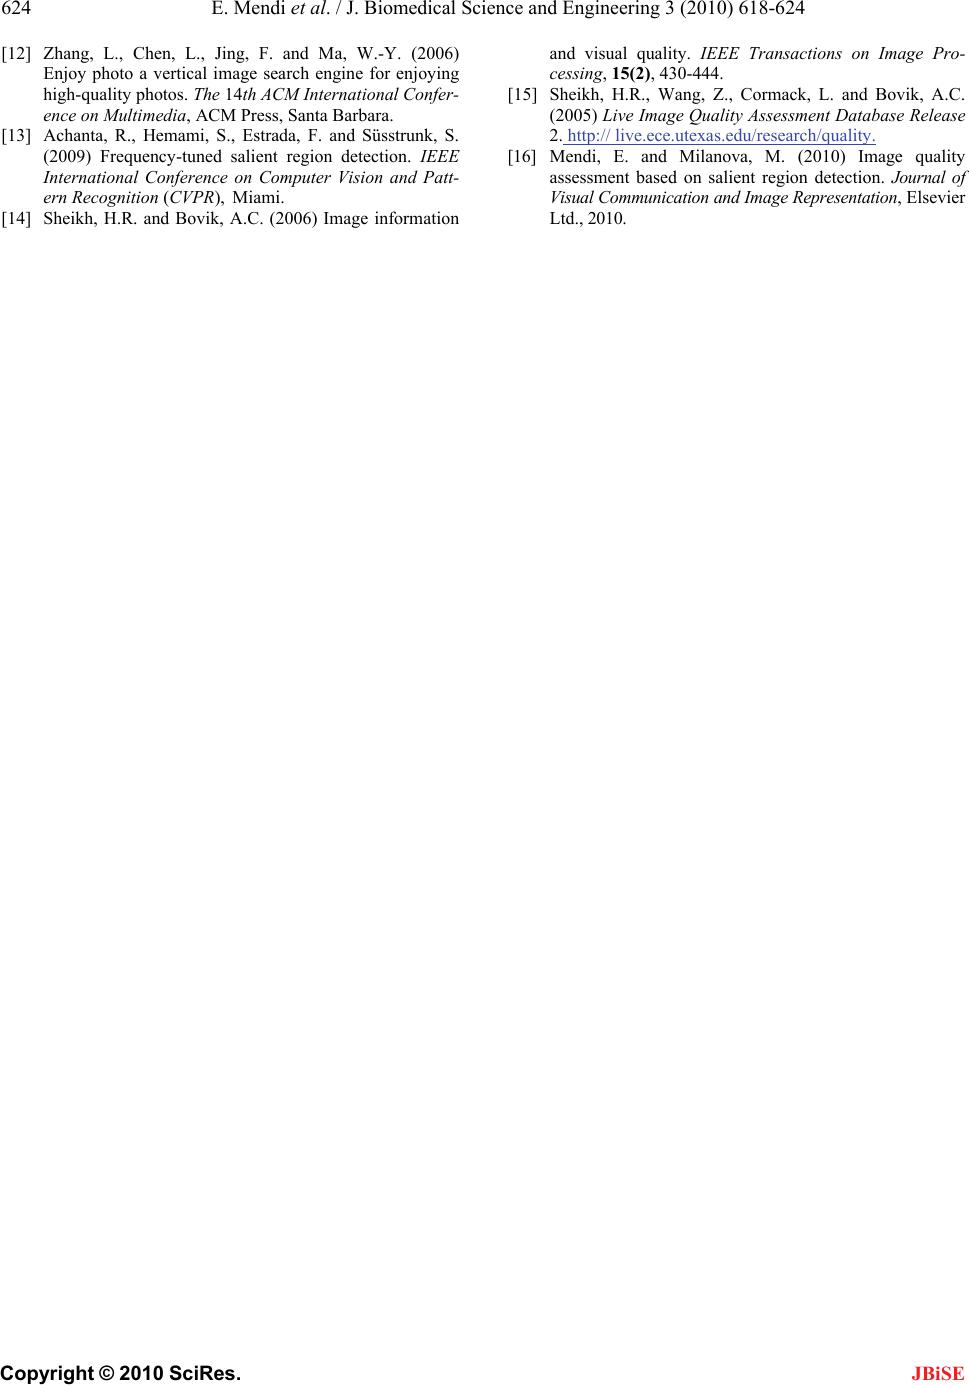
Figure 8 shows the results for the database. Each
sample point represents the subjective/objective scores
of one test image. The y axis in the figure denotes the
subjective scores in the database. The x axis denotes the
predicted quality of images after a nonlinear regression
toward above 4 objective scores, which are SSIM, S-
SSIM, VIF in pixel domain and S-VIF in pixel domain,
respectively. The Pearson validation scores between as-
sessment metrics are depicted in Table 2 [16].
The Pearson correlation coefficient varying from 1 to
1 is widely used to measure the association between two
variables. High absolute values mean that the two vari-
ables being evaluated have high correlation. As shown in
Table 2, our metric is more correlated with human sub-
jective perception.
5. CONCLUSIONS
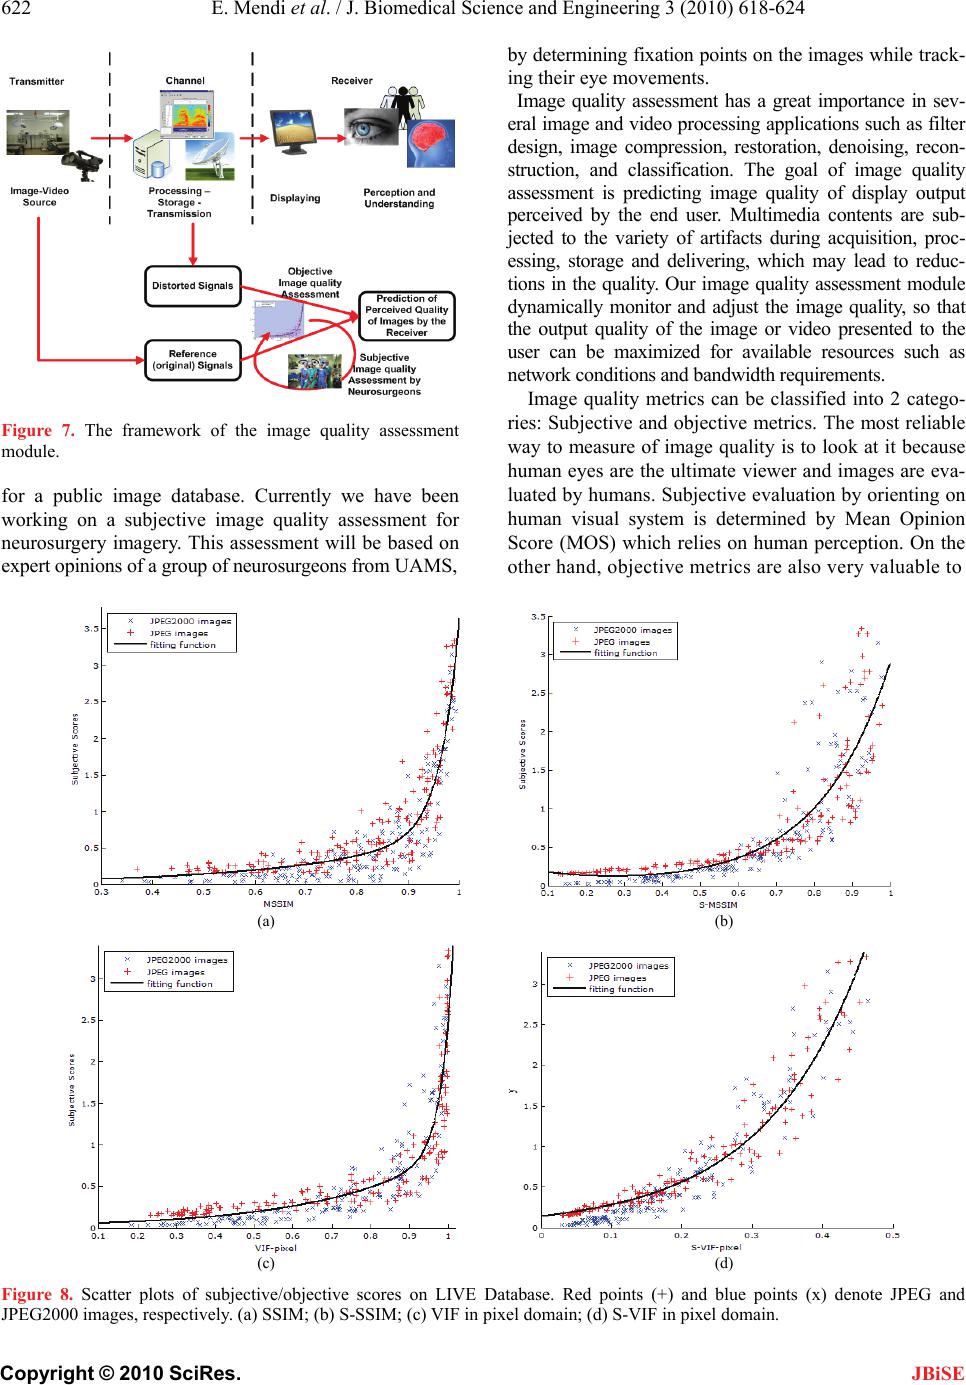
We presented a medical video segmentation and retrieval
research initiative. We introduced the key components of
the framework including video segmentation engine, im-
age retrieval engine and image quality assessment module.
We are currently in the process of transferring our frame
Table 2. Pearson correlation coefficients.
SSIM S-SSIMVIF-pixel S-VIF-pixel
LIVE Image
Database 0.6823 0.7475 0.7126 0.9083
work and software tool over the WEB environment. This
will allow people to access the specific information that
they are interested in among entire video. Multimedia
information system, digital library, and movie industry
are some of the applications work on videos. Since they
are widely used, it brings out the need of processing and
saving the digital video. These processes are mainly the
compressing, segmenting, and indexing of the video.
The neurosurgical data which is initially compressed
will pass through the segmentation and indexing. Then
receiver will be able to retrieve the specific section of
the video that he/she is interested in with maximum qual-
ity for the available network, bandwidth and hardware
resources. The overall objective is to provide convenience
and easiness in accessing the relevant data without going
over the whole data.
REFERENCES
[1] Cecen, S. (2009) Histogram based video segmentation
and key frame extraction on SOM and DFT. Master’s
Thesis, University of Arkansas, Little Rock.
[2] Mendi, E. and Bayrak, C. (2010) Shot boundary detection
and key frame extraction from video sequences. Elsevier
Information Sciences, 2010.
[3] Pavan, M. and Pelillo, M. (2003) Dominant sets and
hiera-rchical clustering. Proceedings of the 9th European
Conference on Computer Vision, 362-369.
[4] Pavan, M. and Pelillo, M. (2005) Efficient out-of-sample
extension of dominant-set clusters. Advances in Neural
Information Processing Systems, 17, 1057-1064.
[5] Mendi, E. and Bayrak, C. (2010) Shot boundary de-
tection and key frame extraction using salient region
detection and structural similarity. The 48th ACM Sou-
theast Conference, Oxford, Mississippi, 15-17 April,
2010.
[6] Lehmann, T. M., Mller, H., Tian, Q., Galatsanos, N.P.
and Mlynek, D. (2005) Augmented medical image
management for integrated healthcare solutions.
[7] Mendi, E. and Bayrak, C. (2010) Performance analysis of
color image retrieval. The 3rd International Congress on
Image and Signal Processing (CISP'10), Yantai, 2010.
[8] Wang, Z. Bovik, A.C. Sheikh, H.R. and Simoncelli, E.P.
(2004) Image quality assessment: From error visibility to
structural similarity. IEEE Transactions on Image Pro-
cessing, 13(4), 600-612.
[9] Li J. and Wang, J.Z. (2003) Automatic linguistic
indexing of pictures by a statistical modeling approach.
IEEE Transactions on Pattern Analysis and Machine
Intelligence, 25(9), 1075-1088.
[10] Wang J.Z., Li, J. and Wiederhold G. (2001) SIMPLIcity:
Semantics-sensitive integrated matching for picture
libraries. The IEEE Transactions on Pattern Analysis and
Machine Intelligence, 23(9), 947-963.
[11] Chono, K., Lin, Y.-C., Varodayan, D., Miyamoto, Y. and
Girod, B. (2008) Reduced-reference image quality ass-
essment using distributed source coding. IEEE Inter-
national Conference on Multimedia and Expo, 2008.
624 E. Mendi et al. / J. Biomedical Science and Engineering 3 (2010) 618-624
Copyright © 2010 SciRes. JBiSE
[12] Zhang, L., Chen, L., Jing, F. and Ma, W.-Y. (2006)
Enjoy photo a vertical image search engine for enjoying
high-quality photos. The 14th ACM International Confer-
ence on Multimedia, ACM Press, Santa Barbara.
[13] Achanta, R., Hemami, S., Estrada, F. and Süsstrunk, S.
(2009) Frequency-tuned salient region detection. IEEE
International Conference on Computer Vision and Patt-
ern Recognition (CVPR), Miami.
[14] Sheikh, H.R. and Bovik, A.C. (2006) Image information
and visual quality. IEEE Transactions on Image Pro-
cessing, 15(2), 430-444.
[15] Sheikh, H.R., Wang, Z., Cormack, L. and Bovik, A.C.
(2005) Live Image Quality Assessment Database Release
2. http:// live.ece.utexas.edu/research/quality.
[16] Mendi, E. and Milanova, M. (2010) Image quality
assessment based on salient region detection. Journal of
Visual Communication and Image Representation, Elsevier
Ltd., 2010.