Paper Menu >>
Journal Menu >>
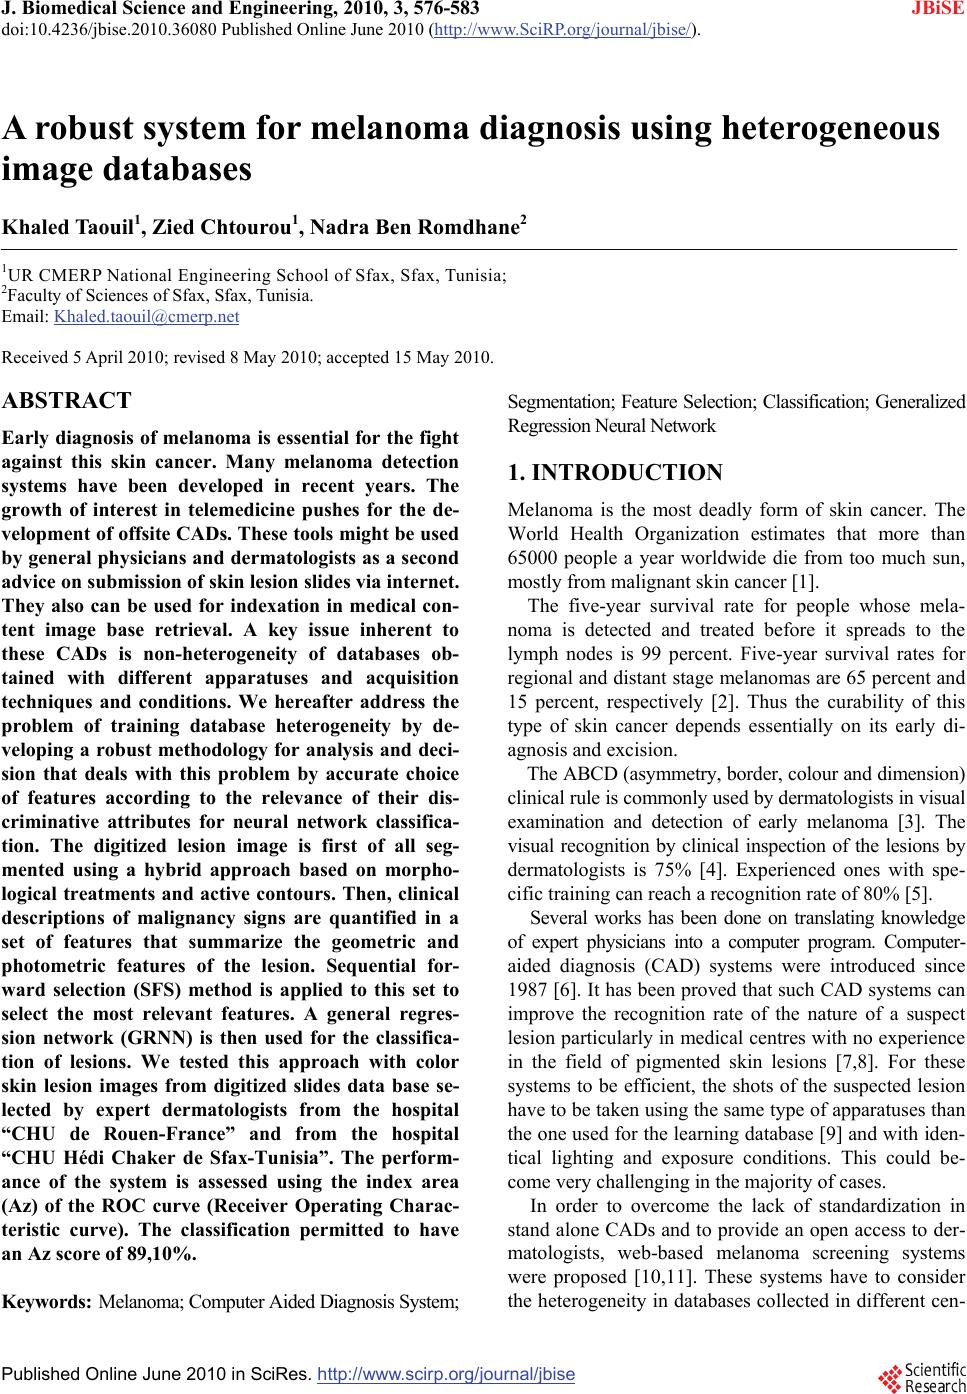 J. Biomedical Science and Engineering, 2010, 3, 576-583 doi:10.4236/jbise.2010.36080 Published Online June 2010 (http://www.SciRP.org/journal/jbise/ JBiSE ). Published Online June 2010 in SciRes. http://www.scirp.org/journal/jbise A robust system for melanoma diagnosis using heterogeneous image databases Khaled Taouil1, Zied Chtourou1, Nadra Ben Romdhane2 1UR CMERP National Engineering School of Sfax, Sfax, Tunisia; 2Faculty of Sciences of Sfax, Sfax, Tunisia. Email: Khaled.taouil@cmerp.net Received 5 April 2010; revised 8 May 2010; accepted 15 May 2010. ABSTRACT Early diagnosis of melanoma is essential for the fight against this skin cancer. Many melanoma detection systems have been developed in recent years. The growth of interest in telemedicine pushes for the de- velopment of offsite CADs. These tools might be used by general physicians and dermatologists as a second advice on submission of skin lesion slides via internet. They also can be used for indexation in medical con- tent image base retrieval. A key issue inherent to these CADs is non-heterogeneity of databases ob- tained with different apparatuses and acquisition techniques and conditions. We hereafter address the problem of training database heterogeneity by de- veloping a robust methodology for analysis and deci- sion that deals with this problem by accurate choice of features according to the relevance of their dis- criminative attributes for neural network classifica- tion. The digitized lesion image is first of all seg- mented using a hybrid approach based on morpho- logical treatments and active contours. Then, clinical descriptions of malignancy signs are quantified in a set of features that summarize the geometric and photometric features of the lesion. Sequential for- ward selection (SFS) method is applied to this set to select the most relevant features. A general regres- sion network (GRNN) is then used for the classifica- tion of lesions. We tested this approach with color skin lesion images from digitized slides data base se- lected by expert dermatologists from the hospital “CHU de Rouen-France” and from the hospital “CHU Hédi Chaker de Sfax-Tunisia”. The perform- ance of the system is assessed using the index area (Az) of the ROC curve (Receiver Operating Charac- teristic curve). The classification permitted to have an Az score of 89,10%. Keywords: Melanoma; Computer Aided Diagnosis System; Segmentation; Feature Selection; Classification; Generalized Regression Neural Network 1. INTRODUCTION Melanoma is the most deadly form of skin cancer. The World Health Organization estimates that more than 65000 people a year worldwide die from too much sun, mostly from malignant skin cancer [1]. The five-year survival rate for people whose mela- noma is detected and treated before it spreads to the lymph nodes is 99 percent. Five-year survival rates for regional and distant stage melanomas are 65 percent and 15 percent, respectively [2]. Thus the curability of this type of skin cancer depends essentially on its early di- agnosis and excision. The ABCD (asymmetry, border, colour and dimension) clinical rule is commonly used by dermatologists in visual examination and detection of early melanoma [3]. The visual recognition by clinical inspection of the lesions by dermatologists is 75% [4]. Experienced ones with spe- cific training can reach a recognition rate of 80% [5]. Several works has been done on translating knowledge of expert physicians into a computer program. Computer- aided diagnosis (CAD) systems were introduced since 1987 [6]. It has been proved that such CAD systems can improve the recognition rate of the nature of a suspect lesion particularly in medical centres with no experience in the field of pigmented skin lesions [7,8]. For these systems to be efficient, the shots of the suspected lesion have to be taken using the same type of apparatuses than the one used for the learning database [9] and with iden- tical lighting and exposure conditions. This could be- come very challenging in the majority of cases. In order to overcome the lack of standardization in stand alone CADs and to provide an open access to der- matologists, web-based melanoma screening systems were proposed [10,11]. These systems have to consider the heterogeneity in databases collected in different cen- 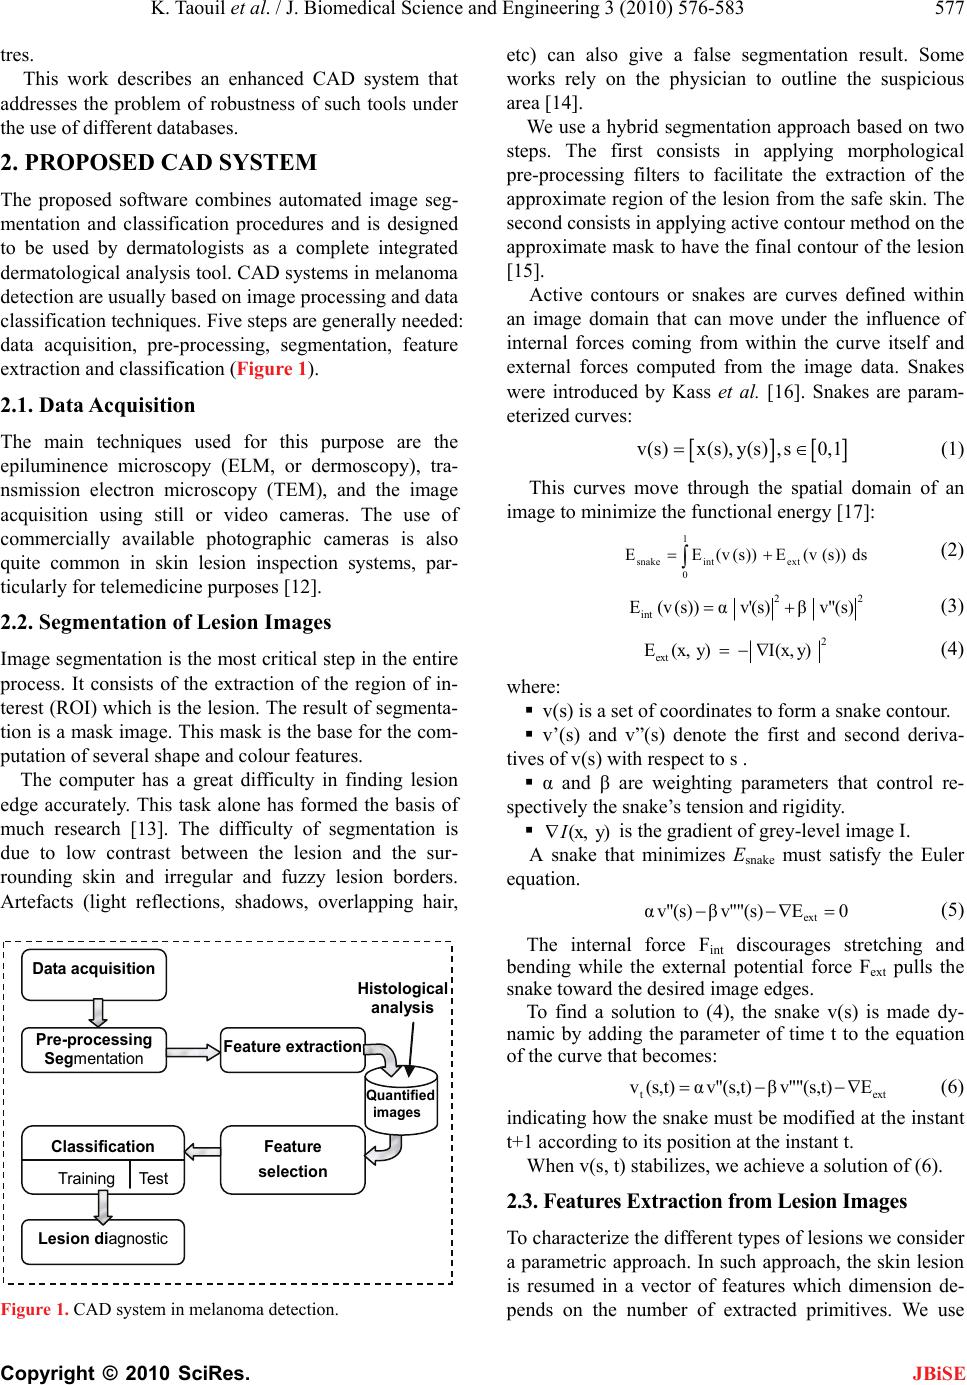 K. Taouil et al. / J. Biomedical Science and Engineering 3 (2010) 576-583 577 Copyright © 2010 SciRes. JBiSE tres. This work describes an enhanced CAD system that addresses the problem of robustness of such tools under the use of different databases. 2. PROPOSED CAD SYSTEM The proposed software combines automated image seg- mentation and classification procedures and is designed to be used by dermatologists as a complete integrated dermatological analysis tool. CAD systems in melanoma detection are usually based on image processing and data classification techniques. Five steps are generally needed: data acquisition, pre-processing, segmentation, feature extraction and classification (Figure 1). 2.1. Data Acquisition The main techniques used for this purpose are the epiluminence microscopy (ELM, or dermoscopy), tra- nsmission electron microscopy (TEM), and the image acquisition using still or video cameras. The use of commercially available photographic cameras is also quite common in skin lesion inspection systems, par- ticularly for telemedicine purposes [12]. 2.2. Segmentation of Lesion Images Image segmentation is the most critical step in the entire process. It consists of the extraction of the region of in- terest (ROI) which is the lesion. The result of segmenta- tion is a mask image. This mask is the base for the com- putation of several shape and colour features. The computer has a great difficulty in finding lesion edge accurately. This task alone has formed the basis of much research [13]. The difficulty of segmentation is due to low contrast between the lesion and the sur- rounding skin and irregular and fuzzy lesion borders. Artefacts (light reflections, shadows, overlapping hair, Data acquisition Pre-processing Segmentation Feature extraction Histological analysis Feature selection Classification Training Test Lesion diagnostic Quantified images Figure 1. CAD system in melanoma detection. etc) can also give a false segmentation result. Some works rely on the physician to outline the suspicious area [14]. We use a hybrid segmentation approach based on two steps. The first consists in applying morphological pre-processing filters to facilitate the extraction of the approximate region of the lesion from the safe skin. The second consists in applying active contour method on the approximate mask to have the final contour of the lesion [15]. Active contours or snakes are curves defined within an image domain that can move under the influence of internal forces coming from within the curve itself and external forces computed from the image data. Snakes were introduced by Kass et al. [16]. Snakes are param- eterized curves: v(s)x(s), y(s),s0,1 (1) This curves move through the spatial domain of an image to minimize the functional energy [17]: 1 snake intext 0 EE(v(s))E(v (s))ds (2) 2 int E(v(s))αv'(s) βv"(s) 2 (3) 2 ext E(x,y)I(x, y) (4) where: v(s) is a set of coordinates to form a snake contour. v’(s) and v”(s) denote the first and second deriva- tives of v(s) with respect to s . α and β are weighting parameters that control re- spectively the snake’s tension and rigidity. (x,y)I is the gradient of grey-level image I. A snake that minimizes Esnake must satisfy the Euler equation. ext αv"(s) βv""(s) E0 (5) The internal force Fint discourages stretching and bending while the external potential force Fext pulls the snake toward the desired image edges. To find a solution to (4), the snake v(s) is made dy- namic by adding the parameter of time t to the equation of the curve that becomes: te v(s,t)αv"(s,t) βv""(s,t)E xt (6) indicating how the snake must be modified at the instant t+1 according to its position at the instant t. When v(s, t) stabilizes, we achieve a solution of (6). 2.3. Features Extraction from Lesion Images To characterize the different types of lesions we consider a parametric approach. In such approach, the skin lesion is resumed in a vector of features which dimension de- pends on the number of extracted primitives. We use  578 K. Taouil et al. / J. Biomedical Science and Engineering 3 (2010) 576-583 Copyright © 2010 SciRes. JBiSE The SFS [21] is an ascending research method (bot- tom-up) of the set of most discriminative parameters from an initial set of parameters (Ei) with: quantitative parameters from the descriptions of derma- tologists based on the ABCD rule to model clinical signs of malignancy. The preliminary developed set of parameters under- went a series of tests to evaluate their robustness when quantifying multiple shots of the same lesion acquired under different lighting conditions with different appa- ratuses as is the case when using different slides from heterogeneous databases [18]. Our set of parameters was besides used by [19] to develop an automatic recognition of melanoma which reached a correct classification rate of 79.1%. The most important clinic signs that were kept to characterize melanoma and the different lesions are the irregularity of the contour, the asymmetry of colour and shape, as well as the heterogeneity of the colour. We classify parameters in two categories: geometric and photometric parameters. 2.3.1. Geometric Parameters Geometric parameters are extracted from the binary shapes obtained after image segmentation. These pa- rameters permit to characterize the shape of the lesion, its elongation and the regularity of its contour. All these parameters are standardized and independent of transla- tion, zoom and rotation effects and therefore compensate for rigid transformations introduced by the optics condi- tions and the scene selection and framing. 2.3.2. Photometric Parameters Photometric parameters are calculated from true colour and binary images. These parameters permit to describe homogeneity and symmetry of the colour as well as the deviation between the mean colour of the lesion and the mean colour of the surrounding safe skin. We tested dif- ferent colour spaces representations calculated from the red green blue components. We reflect the correlation between the level of a colour component of a pixel and its position on the digital image witch is supposed to be independent of lighting conditions and spectral ٛensiti- veity of the camera sensor. 2.4. Feature Selection Feature selection allows choosing the most relevant pa- rameter subset to perform the classification step. This subset must contain the more robust and the most dis- criminative primitives [20]. Three criteria’s must be fixed: the assessment method of the variables set rele- vance, the research procedure to follow and the stopping criteria of the selection. In this work we report the use of a sequential forward selection with a stopping criteria based on the minimum error generated by the classifier. 2.4.1. Sequential Forward Selection Ei p j, j1,2, , N SFSn EEi , nN For this method one parameter pj is added at a time to the ESFS subset. If the assessment criterion is an artificial neural network, for each step, we insert one by one re- maining parameters pj of Ei in ESFS and we calculate the corresponding classification error (Err) with: q 2 ii i1 1 Err(da ) q (7) with q: total image number of the training database. di: desired output. ai: real output. Initially, the subset = SFS0 E ; For every step, parameter pj that will be selected is the one for which the new ESFS subset permits to minimize the classification error: p j SFS SFS Err(E U)Err(E U')pj (8) Thus, the first selected parameter is the most dis- criminative one of the initial set of parameters. The se- lection of parameters stops when while adding a new parameter to ESFS, the classification error increases. 2.5. Classification of Lesion Images After having summarized information contained in the different images of our databases in vectors of parame- ters we use a classifier based on a general regression network (GRNN) [22]. GRNN network is much faster to train than a multilayer perceptron network (MPN). GRNN gave better recognition rates than MPN for melanoma classification [23]. The architecture of this network is illustrated on Figure 2. The GRNN is com- posed of four layers: the input layer, the first intermediate Output Inputs Output layer Hidden layer Summarized Layer Input layer Figure 2. Architecture of the used GRNN.  K. Taouil et al. / J. Biomedical Science and Engineering 3 (2010) 576-583 579 Copyright © 2010 SciRes. JBiSE layer constituted of radial units, the second intermediate layer constituted of summarized units and the output layer. 3. ASSESSMENT OF THE CLASSIFICATION The performance of our CAD system is evaluated in term of sensitivity and specificity. These measures are defined as follow: # True Positives Sensitivity = #True Positives +#False Negatives (9) # TrueNegatives Specificity = #TrueNegatives +#False Positives (10) With #true-Positive and #False-Negative corresponds respectively to the number of malign lesions well classi- fied and badly classified. #True-Negative and #False- Positive corresponds respectively to the number of be- nign lesions well classified and badly classified. A ROC curve consists in representing the value of the sensitivity according to (1-specificity) [24]. The area under the ROC curve or area index (Az) represents the probability to correctly identify the image with anomaly when an image with anomaly and an image without are presented simultaneously to the observer. We use two databases of image lesions whose malign or benign nature is perfectly known after histological analysis. The first one has been collected in CHU Rouen France with the collaboration of the research laboratory PSI-INSA Rouen and has been supported by the French National League against Cancer. This database was digi- tized in true colours by a 35 mms slides Nikon LS- 1000S scanner. It was used in previous works [19,25] and [26,27]. We divide this database in a training (B0) and test (B1) sets used in the first assessment of classifi- cation. The second image database has been collected in Tu- nisia from the dermatology service of CHU Hédi CHAKER in Sfax. Images were digitized in true colours with a HP Scanjet 3570c scanner (cf. Table 1). Our approach for efficiency assessment of the devel- oped tool has been achieved in three steps: 3.1. First Assessment of the System For the first step, we evaluate the diagnosis results of our system while using two sets of images (B0 for training and B1 for test) from the same CHU Rouen image data- base. Table 1. Distribution of images databases. Data- base Set Class Nbr of BL Nbr of ML Total B0 Training59 27 86 CHU Rouen B1 Test 34 15 49 CHU Sfax B2 Test 31 20 51 Total 124 62 186 3.2. Comparison of Our System’s Diagnosis with Dermatologist’s Visual Diagnosis This step consists in comparing diagnostic results of our system with the opinion of four expert dermatologists for the same test database (B1). Dermatologists are part of the dermatology service of the CHU Sfax. We asked every dermatologist to give his diagnosis for each lesion. 3.3. Third Assessment of the System For this step, we evaluate our system while using the second image database (B2) collected at CHU Sfax. This test has been done while using the artificial neural net- work having the best recognition rate according to the first assessment. 4. RESULTS AND DISCUSSION 4.1. Results of the Segmentation Step For image lesion segmentation, we propose a hybrid method that combines the advantages of morphological treatments, histogram thresholding and active contours techniques. First the contrast of the gray level original image is en- hanced using top-hat and bottom-up filtering (Figure 3). The extraction of the image mask is based on the de- tection of regional minima of the complementary image of the contrast enhanced image. The detection of these regions requires the application of a threshold. This threshold is obtained with histogram thresholding using Otsu method [28]. We apply then a morphological ope- ning on the obtained image. Lakes of the resulting image are eliminated by filling holes. The approximate zone or approximate mask of the lesion is finally obtained fol- lowing a labelling, conservation of the biggest element. We initialize a snake at the approximate boundary of the safe skin (cf. Figure 4). The snake begins with the calculation of a field of external forces over the image domain. The forces drive it toward the boundary of the lesion. The process is iterated until it matches the con- tour of the lesion. We superpose the obtained contour on the original color image. Figures 5 and 6 show some examples of segmentation results of lesions collected from both CHU Rouen and HU Sfax databases. C  580 K. Taouil et al. / J. Biomedical Science and Engineering 3 (2010) 576-583 Copyright © 2010 SciRes. (a) original image (b) contrast enhancement (c) Approximate mask of the safe skin Figure 3. Extracting the approximate mask of the safe skin. (a) Snake initialization (b) Snake progression (c) segmented image Figure 4. Application of the active contour on the approximate mask. ferent subsets of selected variables. The chosen set of variables is the one that generates the minimal error. We pursued research until the selec- tion of all parameters. Then we chose the smallest subset gotten with the minimal error. The result of this selection method is illustrated on Figure 7. It illustrates the variation of the classification’s mean square error (MSE) according to the number of included parameters, during trainings and tests of the GRNN. According to the test curve, we note that the set of the Figure 5. Segmentation results of lesions collected from CHU Rouen database. 4.2. Results of Features Selection For features extraction, a set of 68 parameters are ex- tracted for every lesion. Through correlation and ro- bustness study, a set of 42 parameters have been kept. To find the most discriminative ones for the classification step, we apply the sequential forward selection (SFS) method. Training and test databases of images have been randomly selected. For the SFS method, the assessment of parameter selection is based on the comparison of the error generated by the general regression neural network (GRNN) for the dif- Figure 6. Segmentation results of lesions collected from CHU Sfax database. JBiSE  K. Taouil et al. / J. Biomedical Science and Engineering 3 (2010) 576-583 581 Copyright © 2010 SciRes. JBiSE Figure 7. Parameter selection using SFS method. Figure 8. The ROC curve obtained using GRNN classifier and the selected parameters. Table 2. Order of the selected parameters using SFS method. Rg N° Description 01 24 scG symmetry of the green component 02 09 rmoyr mean of the normalized red in the lesion 03 03 DeltaD expanse of the distance to the center 04 35 Beta spherical coordinate beta 05 23 scR symmetry of the red component 06 01 comp compactness of the shape 07 39 RB Ratio between lesion and safe skin for the red 08 29 gamma1B Fisher coefficient for the blue 09 16 sigmamoyLb Standard deviation of normalized bleu in the safe skin 10 06 scB symmetry of the blue component most discriminative parameters permitting to minimize the MSE of test database are gotten after the insertion of the first ten parameters (MSE = 0.1434). The selection by the SFS method permitted a reduc- tion of 76.19% of the total number of parameters. The list of parameters selected is presented in Table 2. 4.3. Results of the Classification Step The classification is based on parameters kept in features selection. Figure 8 illustrates results of the classification while using the 10 most discriminative parameters se- lected by the SFS method. The performances of classification using B1 set of images extracted from CHU Rouen database are based on the comparison of the value of the area index (Az) of the ROC curve. We obtain a value of Az equal to 89.1%. The recognition rate of the system is 92.05%. To validate the efficiency of our system, we compare the obtained classification results with the diagnosis of four dermatologists from CHU Sfax. We asked every dermatologist to give his diagnosis for every lesion of the same test set B1. Results of their diagnoses are given in Table 3. According to these results, we notice that the mean value of sensitivity provided by dermatologists is equal to the mean percentage of visual recognition of the true positives by dermatologists that is 75% [4]. The recognition rate of our CAD system (92.05%) ex- ceeds that obtained by dermatologists. It even exceeds that of experimented trained ones which is about 80% [5]. Results of the second assessment of the system are given in Table 4. We note that even when using a test set of image lesions selected randomly from a different da- tabase the recognition rate our system is 90.15%. It re- mains better than the one of the visual diagnosis of ex- perimented dermatologists. 5. CONCLUSIONS In this paper we have described the different steps used in the CAD system that we propose for melanoma detection. To make this tool useful by the dermatologist commu- nity outside specialized centres, each stage of processing had to be automatic and robust to different conditions of acquisition and apparatus. The system segments and extracts parameters of description of the lesion. These parameters are normalized and used as inputs for the neural network classifier which decides if the lesion is suspicious. We have also described the different steps used for the evaluation of our system. This evaluation had proved the robustness of our system when using different databases in training and test. This property makes it a suitable and an efficient candidate for use in a context of a telemedicine dermatological application.  582 K. Taouil et al. / J. Biomedical Science and Engineering 3 (2010) 576-583 Copyright © 2010 SciRes. JBiSE Table 3. Recognition rate dermatologists (D). RR / D D A D B D C D D FP VP FN VN 12 9 6 22 0 8 7 34 12 14 1 22 8 14 1 26 mean Sensitivity 60 53,3 93,3 93,3 74,9 Specificity 64,7 100 6 4,7 76,5 76,4 RR 62,3 76,6 79,0 84,9 75,7 - FP (False Positive) - TP (True Positive) - FN (False Negative) - TN (True Negative) - RR: Recognition Rate Table 4. Assessment of the system with database B2. TR Base2 FP VP FN VN 03 18 02 28 Sensitivity 90 Specificity 90,3 Recognition rate 90,15 6. ACKNOWLEDGEMENTS We sincerely thank: - Dermatology Services of CHU Rouen, France and CHU Hédi Chaker, sfax, Tunisia. - Laboratory PSI (Perseption Systems Information), INSA Rouen, France. - Research Unit: Sciences and Technologies of Image and Tele- communications, High Institute of Biotechnology, Sfax. REFERENCES [1] (2006) Solar ultraviolet radiation: Global burden of disease from solar ultraviolet radiation. Environmental Burden of Disease Series, World Health Organization, 13. [2] (2009) Cancer Facts and Figures. American Cancer So- ciety, Atlanta. [3] Friedman, R.J. (1985) Early detection of malignant mela- noma: the role of the physician examination and self examination of the skin. Cancer Journal for Clinicians, 35, 130-151. [4] Schmid-Saugeon, P., Guillod, J. and Thiran, J.P. (2003) Towards a computer-aided diagnosis system for pig- mented skin lesions. Computerized Medical Imaging and Graphics, 27, 65-78. [5] Blanzieri, E. (2000) Exploiting classifier combination for early melanoma diagnosis support. Proceedings of the 11th European Conference on Machine Learning, Bar- celona, 31 May-2 June 2000, 55-62. [6] Cascinelli, N., Ferrario, M., Tonelli, T., et al. (1987) A possible new tool for clinical diagnosis of melanoma. Journal of the American Academy of Dermatology, 16, 361-367. [7] Ercal, F., Chawla, A., Stoecker, W.V., Lee, H.C. and Moss, R.H. (1994) Neural network diagnosis of malig- nant melanoma from color images. IEEE Transactions on Biomedical Engineering, 41(9), 837-845. [8] Ganster, H., Pinz, A., Röhrer, R., et al. (2001) Auto- mated melanoma recognition. IEEE Transactions on Medical Imaging, 20(3), 233-238. [9] Burroni, M. (2004) Melanoma computer-aided diagnosis: Reliability and feasibility study. Clinical Cancer Re- search, 10, 1881-1886. [10] Guillod, J., Schmid-Saugeon, P., Déccaillet, F., et al. (2003) An open internet platform to distributed image processing applied to dermoscopy. Studies in Health Technology and Informatics, 95, 107-112. [11] Oka, H., Hashimoto, M., Iyatomi, H. and Tanaka, M. (2004) Internet-based program for automatic discrimina- tion of dermoscopic images between melanoma and Clark nevi. British Journal of Dermatology, 150(5), 1041. [12] Maglogiannis, I. and Charalampos, N.D. (2003) Overview of advanced computer vision systems for skin lesions characterization. IEEE Transaction on Information Tech- nology in Biomedicine, 13(5), 721-733. [13] Hall, P.N., Claridge, E. and Morris Smith, J.D. (1995) Computer screening for early detection of melanoma- Is there a future? British Journal of Dermatology, 132, 325-338. [14] White, R., Rigel, D.S. and Friedman, R.J. (1991) Com- puter applications in the diagnosis and prognosis of ma- lignant melanoma. Dermatologic Clinics, 9, 695-702. [15] Taouil, K. and Romdhane, N.B. (2006) A new automatic approach for edge detection of skin lesion images. Inter- national Conference on Information & Communication Technologies: From Theory to Applications, Damascus. [16] Kass, M., Witkin, A. and Terzopoulos, D. (1987) Snakes: Active contour models. International Journal of Com- puter Vision, 1, 321-331. [17] Xu, C.Y. and Prince, J.L. (1998) Snakes, shapes, and gradient vector flow. IEEE Transactions on Image Proc- essing, 7(3), 359. [18] Taouil, K., Bouhlel, M.S., Elloumi, M. and Kamoun, L. (2002) Quantification des caractéristiques de mélanomes en vue d'une classification. JTEA'2002, Sousse, 179-185. [19] Zagrouba, E. and Barhoumi, W. (2004) A prelimary ap- proach for the automated recognition of malignant mela- noma. Image Analysis and Stereology Journal, 23(2), 121-135. [20] Taouil, K. and Romdhane, N.B. (2006) Automatic seg- mentation and classification of skin lesion images. The 2nd International Conferences on Distributed Frame- works for Multimedica Applications, Pulau Pinang. [21] Pudil, P., Novoviovca, J. and Kittler, J. (1994) Floating search methods in feature selection. Pattern Recognition Letters, 15, 1119-1125. [22] Specht, D.F. (1991) A general regression neural network. IEEE Transactions on Neural Networks, 2, 568-576. [23] Romdhane, N.B., Taouil, K., Boudaya, S. Turki, H. and Bouhlel, M.S. (2007) Sélection des Variables et Classi- fication par Réseaux de Neurones des Lésions Derma-  K. Taouil et al. / J. Biomedical Science and Engineering 3 (2010) 576-583 583 Copyright © 2010 SciRes. JBiSE tologiques. 4th International Conference: Sciences of Electronic, Technologies of Information and Telecom- munications, Tunisia. [24] Tokan, F., Türker, N. and Yıldırım, T. (2006) ROC analysis as a useful tool for performance evaluation of artificial neural networks. Artificial Neural Networks - ICANN 2006, 4132, 923-931. [25] Zagrouba, E. and Barhoumi, W. (2005) An accelerated system for melanoma diagnosis based on subset feature selection. Journal of Computing and Information Tech- nology, 13(1), 69-82. [26] Vannoorenberghe, P., Colot, O. and de Brucq, D. (1999) Dempster-shafer’s theory as an aid to color information processing application to melanoma detection in derma- tology. Proceedings of the 10th International Conference on Image Analysis and Processing, Venice, 774-779. [27] Lefevre, E., Colot, O., Vannoorenberghe, P. and de Brucq, D. (2000) Knowledge modeling methods in the frame- work of evidence theory: An experimental comparison for melanoma detection Systems. 2000 IEEE Interna- tional Conference on Man and Cybernetics, Nashville, 4, 2806- 2811. [28] Sezgin, M. and Sankur, B. (2004) Survey over image thresholding techniques and quantitative performance evaluation. Journal of Electronic Imaging, 13(1), 146- 165. |