A. M. AENAB ET AL.
526
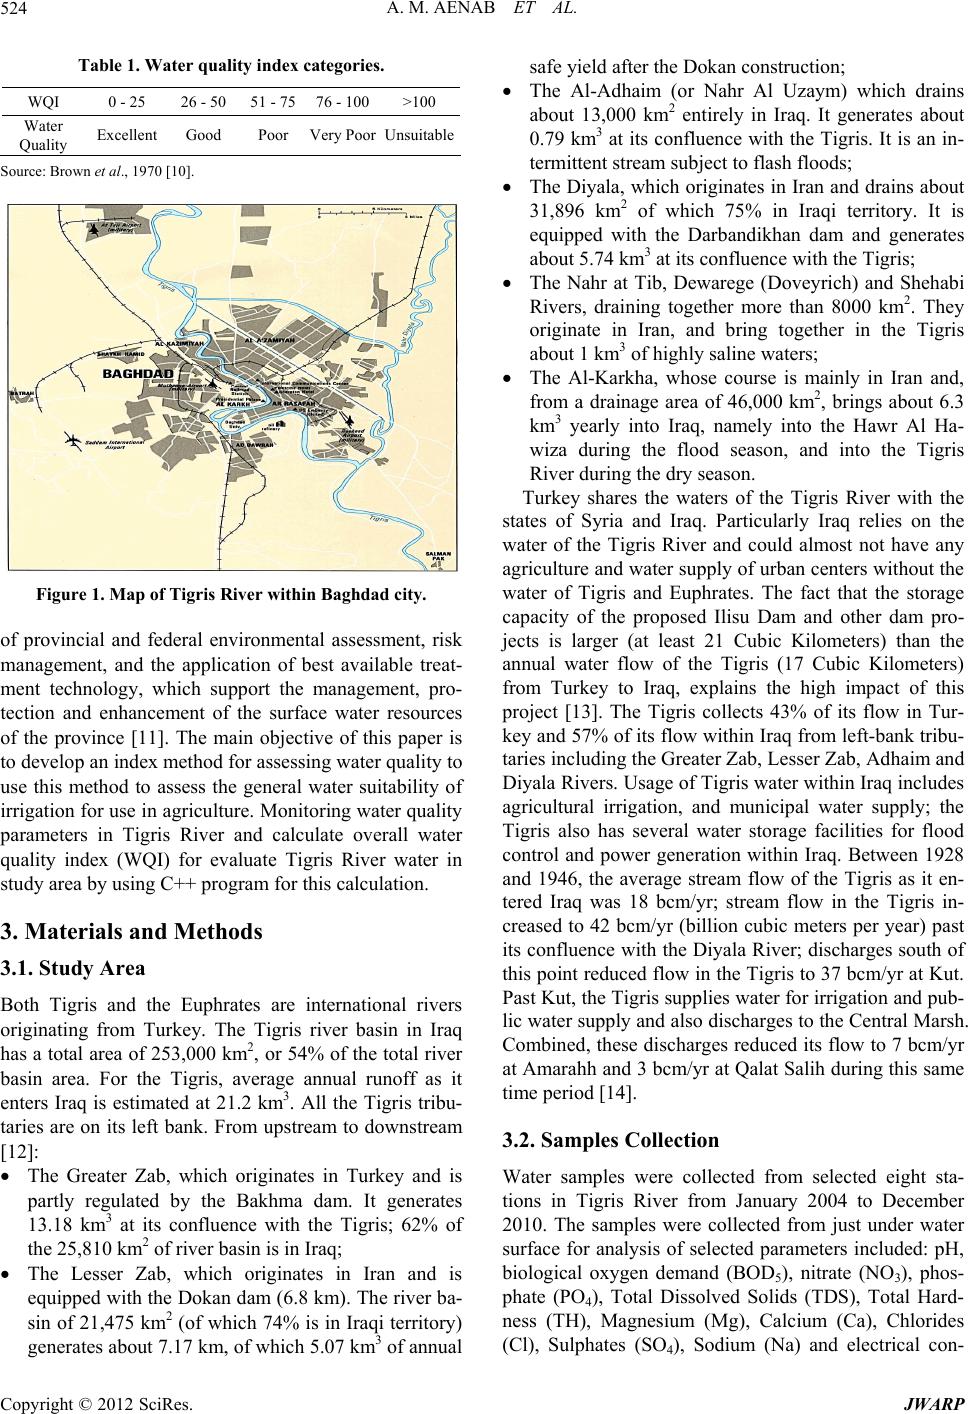
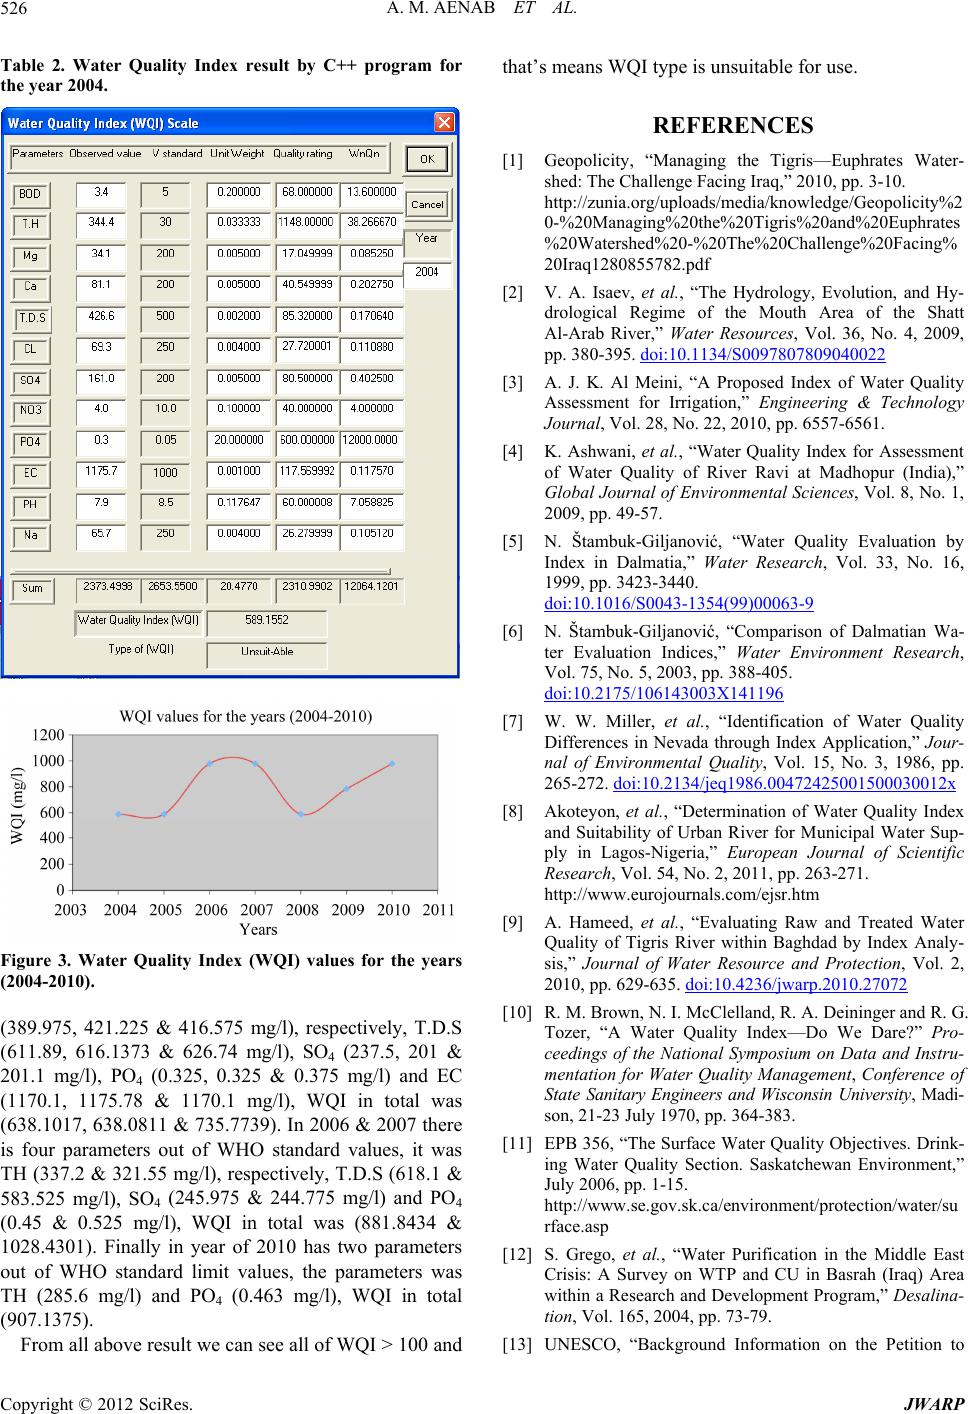
Table 2. Water Quality Index result by C++ program for
the year 2004.
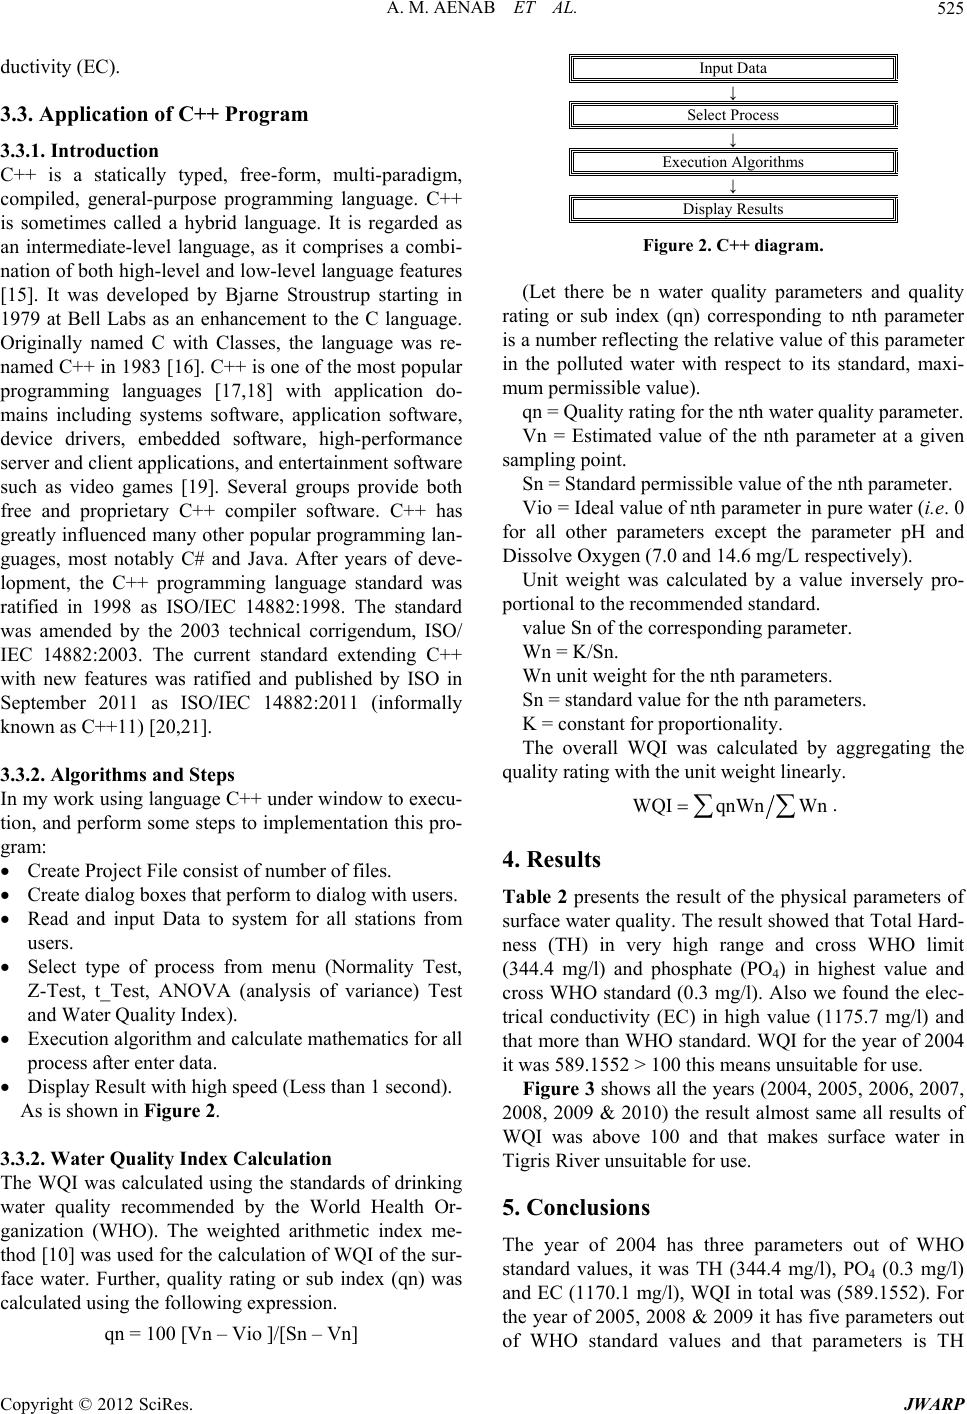
Figure 3. Water Quality Index (WQI) values for the years
(2004-2010).
(389.975, 421.225 & 416.575 mg/l), respectively, T.D.S
(611.89, 616.1373 & 626.74 mg/l), SO4 (237.5, 201 &
201.1 mg/l), PO4 (0.325, 0.325 & 0.375 mg/l) and EC
(1170.1, 1175.78 & 1170.1 mg/l), WQI in total was
(638.1017, 638.0811 & 735.7739). In 2006 & 2007 there
is four parameters out of WHO standard values, it was
TH (337.2 & 321.55 mg/l), respectively, T.D.S (618.1 &
583.525 mg/l), SO4 (245.975 & 244.775 mg/l) and PO4
(0.45 & 0.525 mg/l), WQI in total was (881.8434 &
1028.4301). Finally in year of 2010 has two parameters
out of WHO standard limit values, the parameters was
TH (285.6 mg/l) and PO4 (0.463 mg/l), WQI in total
(907.1375).
From all above result we can see all of WQI > 100 and
that’s means WQI type is unsuitable for use.
REFERENCES
[1] Geopolicity, “Managing the Tigris—Euphrates Water-
shed: The Challenge Facing Iraq,” 2010, pp. 3-10.
http://zunia.org/uploads/media/knowledge/Geopolicity%2
0-%20Managing%20the%20Tigris%20and%20Euphrates
%20Watershed%20-%20The%20Challenge%20Facing%
20Iraq1280855782.pdf
[2] V. A. Isaev, et al., “The Hydrology, Evolution, and Hy-
drological Regime of the Mouth Area of the Shatt
Al-Arab River,” Water Resources, Vol. 36, No. 4, 2009,
pp. 380-395. doi:10.1134/S0097807809040022
[3] A. J. K. Al Meini, “A Proposed Index of Water Quality
Assessment for Irrigation,” Engineering & Technology
Journal, Vol. 28, No. 22, 2010, pp. 6557-6561.
[4] K. Ashwani, et al., “Water Quality Index for Assessment
of Water Quality of River Ravi at Madhopur (India),”
Global Journal of Environmental Sciences, Vol. 8, No. 1,
2009, pp. 49-57.
[5] N. Štambuk-Giljanović, “Water Quality Evaluation by
Index in Dalmatia,” Water Research, Vol. 33, No. 16,
1999, pp. 3423-3440.
doi:10.1016/S0043-1354(99)00063-9
[6] N. Štambuk-Giljanović, “Comparison of Dalmatian Wa-
ter Evaluation Indices,” Water Environment Research,
Vol. 75, No. 5, 2003, pp. 388-405.
doi:10.2175/106143003X141196
[7] W. W. Miller, et al., “Identification of Water Quality
Differences in Nevada through Index Application,” Jour-
nal of Environmental Quality, Vol. 15, No. 3, 1986, pp.
265-272. doi:10.2134/jeq1986.00472425001500030012x
[8] Akoteyon, et al., “Determination of Water Quality Index
and Suitability of Urban River for Municipal Water Sup-
ply in Lagos-Nigeria,” European Journal of Scientific
Research, Vol. 54, No. 2, 2011, pp. 263-271.
http://www.eurojournals.com/ejsr.htm
[9] A. Hameed, et al., “Evaluating Raw and Treated Water
Quality of Tigris River within Baghdad by Index Analy-
sis,” Journal of Water Resource and Protection, Vol. 2,
2010, pp. 629-635. doi:10.4236/jwarp.2010.27072
[10] R. M. Brown, N. I. McClelland, R. A. Deininger and R. G.
Tozer, “A Water Quality Index—Do We Dare?” Pro-
ceedings of the National Symposium on Data and Instru-
mentation for Water Quality Management, Conference of
State Sanitary Engineers and Wisconsin University, Madi-
son, 21-23 July 1970, pp. 364-383.
[11] EPB 356, “The Surface Water Quality Objectives. Drink-
ing Water Quality Section. Saskatchewan Environment,”
July 2006, pp. 1-15.
http://www.se.gov.sk.ca/environment/protection/water/su
rface.asp
[12] S. Grego, et al., “Water Purification in the Middle East
Crisis: A Survey on WTP and CU in Basrah (Iraq) Area
within a Research and Development Program,” Desalina-
tion, Vol. 165, 2004, pp. 73-79.
[13] UNESCO, “Background Information on the Petition to
Copyright © 2012 SciRes. JWARP