Paper Menu >>
Journal Menu >>
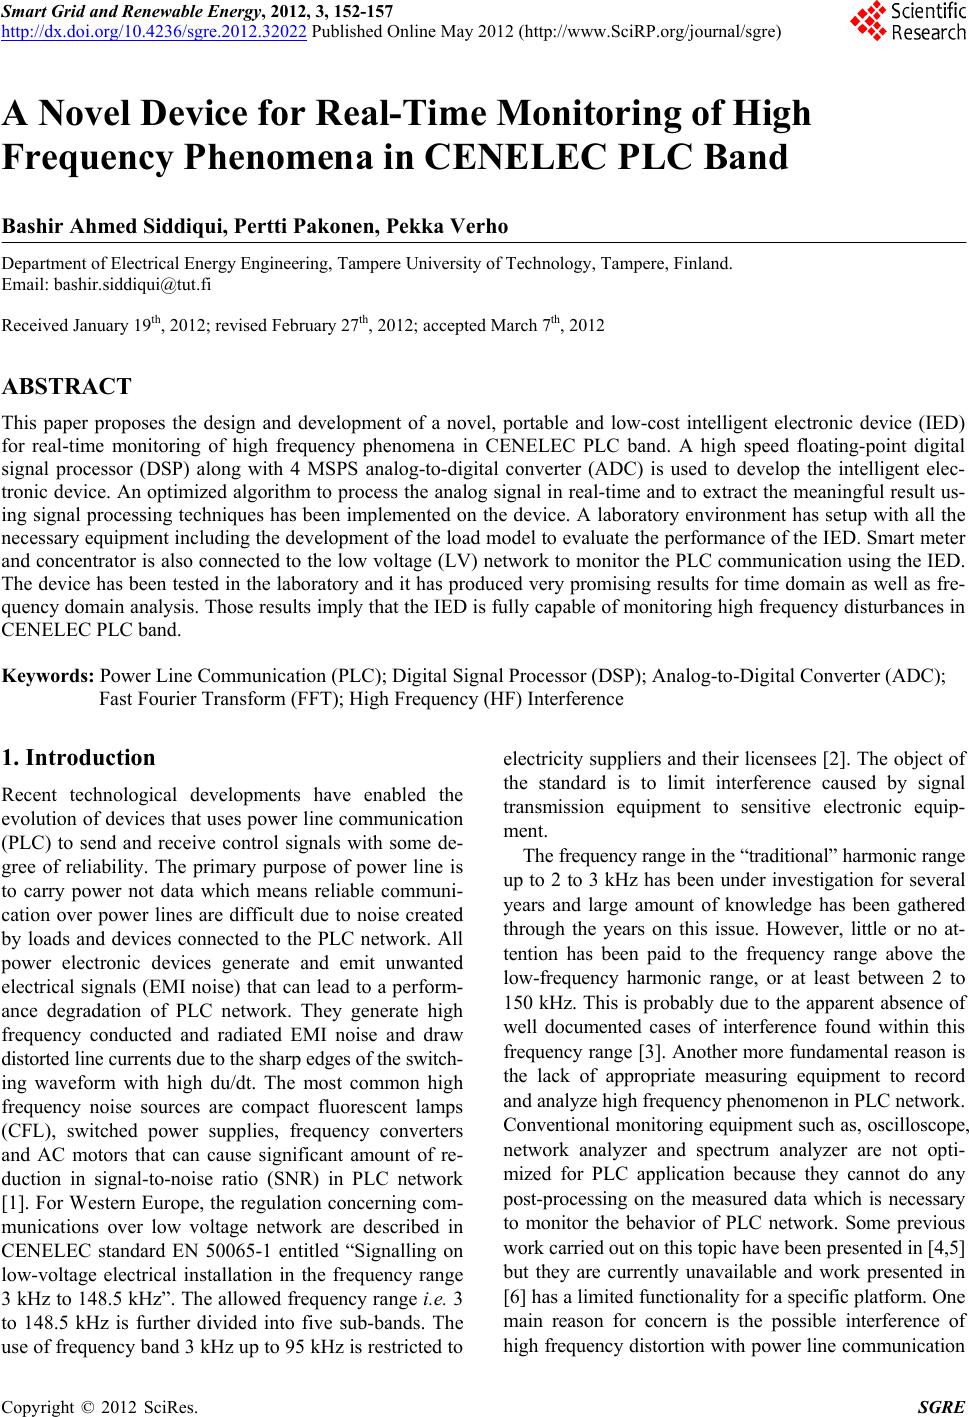 Smart Grid and Renewable Energy, 2012, 3, 152-157 http://dx.doi.org/10.4236/sgre.2012.32022 Published Online May 2012 (http://www.SciRP.org/journal/sgre) 1 A Novel Device for Real-Time Monitoring of High Frequency Phenomena in CENELEC PLC Band Bashir Ahmed Siddiqui, Pertti Pakonen, Pekka Verho Department of Electrical Energy Engineering, Tampere University of Technology, Tampere, Finland. Email: bashir.siddiqui@tut.fi Received January 19th, 2012; revised February 27th, 2012; accepted March 7th, 2012 ABSTRACT This paper proposes the design and development of a novel, portable and low-cost intelligent electronic device (IED) for real-time monitoring of high frequency phenomena in CENELEC PLC band. A high speed floating-point digital signal processor (DSP) along with 4 MSPS analog-to-digital converter (ADC) is used to develop the intelligent elec- tronic device. An optimized algorithm to process the analog signal in real-time and to extract the meaningful result us - ing signal processing techniques has been implemented on the device. A laboratory environment has setup with all the necessary equipment including the development of the load model to evaluate the performance of the IED. Smart meter and concentrator is also connected to the low voltage (LV) network to monitor the PLC communication using the IED. The device has been tested in the laboratory and it has produced very promising results for time domain as well as fre- quency domain analysis. Those results imply that the IED is fully cap able of monitoring high frequ ency disturbances in CENELEC PLC band. Keywords: Power Line Communication (PLC); Digital Signal Process or (DSP); Analog-to-Digital Converter (ADC); Fast Fourier Transform (FFT); High Frequency (HF) Interference 1. Introduction Recent technological developments have enabled the evolution of devices that uses power line communication (PLC) to send and receive control signals with some de- gree of reliability. The primary purpose of power line is to carry power not data which means reliable communi- cation over power lines are difficult due to noise created by loads and devices connected to the PLC network. All power electronic devices generate and emit unwanted electrical signals (EMI noise) that can lead to a perform- ance degradation of PLC network. They generate high frequency conducted and radiated EMI noise and draw distorted line currents due to the sharp edges of the switch- ing waveform with high du/dt. The most common high frequency noise sources are compact fluorescent lamps (CFL), switched power supplies, frequency converters and AC motors that can cause significant amount of re- duction in signal-to-noise ratio (SNR) in PLC network [1]. For Western Europe, the regulation concerning com- munications over low voltage network are described in CENELEC standard EN 50065-1 entitled “Signalling on low-voltage electrical installation in the frequency range 3 kHz to 148.5 kHz”. Th e allowed frequency rang e i.e. 3 to 148.5 kHz is further divided into five sub-bands. The use of frequency band 3 kHz up to 95 kHz is restricted to electricity suppliers and their licensees [2]. The object of the standard is to limit interference caused by signal transmission equipment to sensitive electronic equip- ment. The frequency range in the “traditional” harmonic range up to 2 to 3 kHz has been under investigation for several years and large amount of knowledge has been gathered through the years on this issue. However, little or no at- tention has been paid to the frequency range above the low-frequency harmonic range, or at least between 2 to 150 kHz. This is probably due to the apparent absence of well documented cases of interference found within this frequency range [3]. Another more fundamental reason is the lack of appropriate measuring equipment to record and analyze high frequency phenomenon in PLC network. Conventional monitoring equipment such as, oscilloscope, network analyzer and spectrum analyzer are not opti- mized for PLC application because they cannot do any post-processing on the measured data which is necessary to monitor the behavior of PLC network. Some previous work carried out on this topic have been presented in [4,5] but they are currently unavailable and work presented in [6] has a limited functionality fo r a specific platfor m. One main reason for concern is the possible interference of high frequency distortion with power line communication Copyright © 2012 SciRes. SGRE 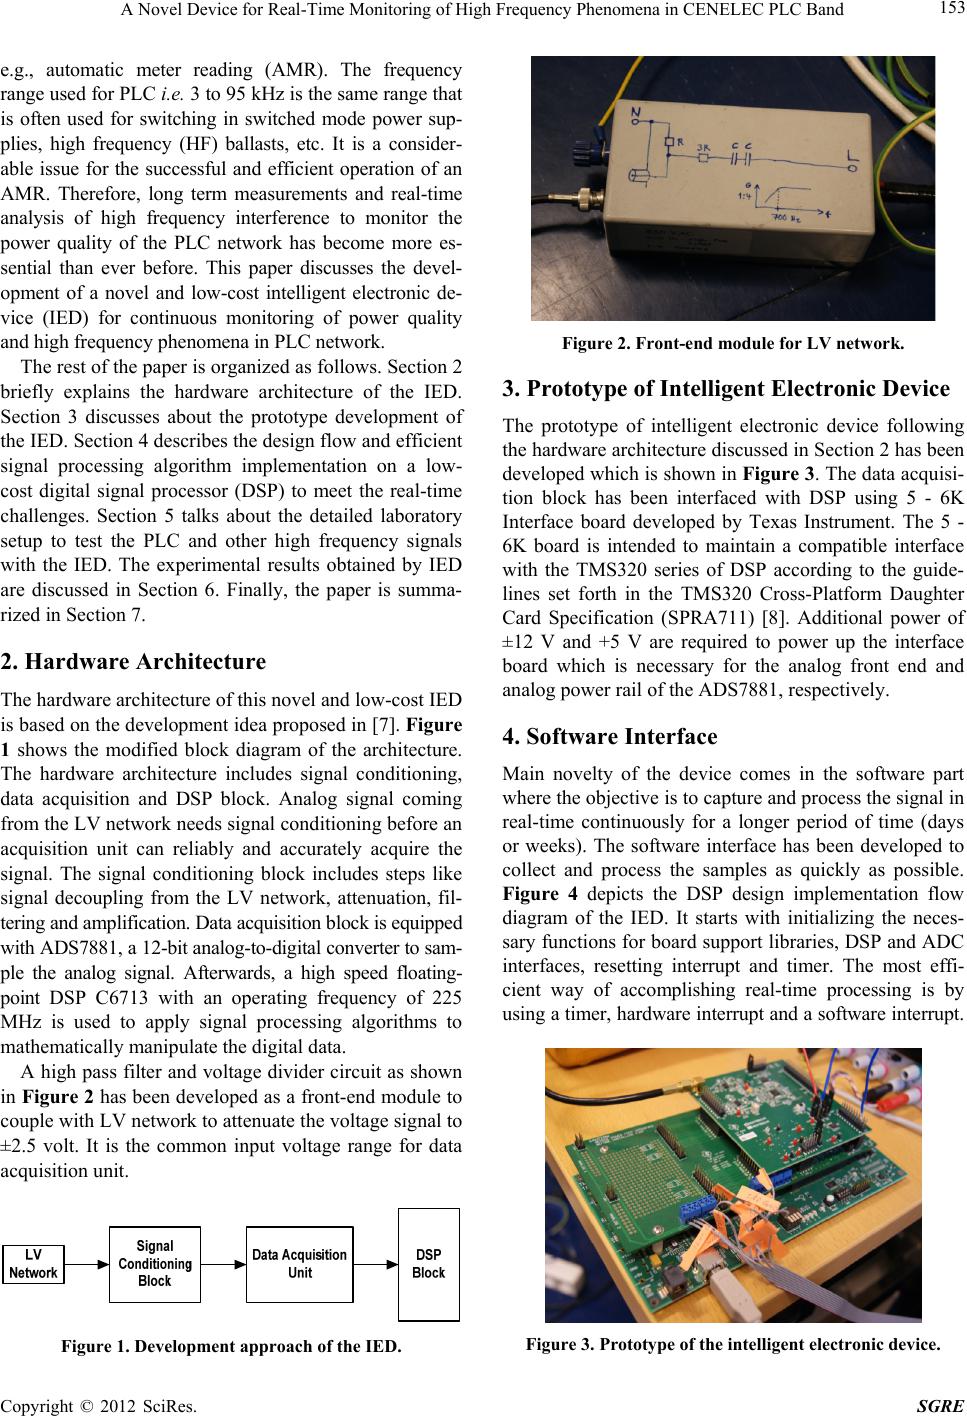 A Novel Device for Real-Time Monitoring of High Frequency Phenomena in CENELEC PLC Band 153 e.g., automatic meter reading (AMR). The frequency range used for PLC i.e. 3 to 95 kHz is the same range that is often used for switching in switched mode power sup- plies, high frequency (HF) ballasts, etc. It is a consider- able issue for the successful and efficient operation of an AMR. Therefore, long term measurements and real-time analysis of high frequency interference to monitor the power quality of the PLC network has become more es- sential than ever before. This paper discusses the devel- opment of a novel and low-cost intelligent electronic de- vice (IED) for continuous monitoring of power quality and high frequ ency phenomena in PLC network. The rest of the paper is organized as follows. Section 2 briefly explains the hardware architecture of the IED. Section 3 discusses about the prototype development of the IED. Section 4 describes the design flow and efficient signal processing algorithm implementation on a low- cost digital signal processor (DSP) to meet the real-time challenges. Section 5 talks about the detailed laboratory setup to test the PLC and other high frequency signals with the IED. The experimental results obtained by IED are discussed in Section 6. Finally, the paper is summa- rized in Section 7. 2. Hardware Architecture The hardware architecture of this novel and low-cost IED is based on the development idea proposed in [7]. Figure 1 shows the modified block diagram of the architecture. The hardware architecture includes signal conditioning, data acquisition and DSP block. Analog signal coming from the LV network needs signal cond itioning before an acquisition unit can reliably and accurately acquire the signal. The signal conditioning block includes steps like signal decoupling from the LV network, attenuation, fil- tering and amplification. Data acquisition block is equipped with ADS7881, a 12-bit analog-to-digital converter to sam- ple the analog signal. Afterwards, a high speed floating- point DSP C6713 with an operating frequency of 225 MHz is used to apply signal processing algorithms to mathematically manipulate the digital data. A high pass filter and voltage divider circuit as shown in Figure 2 has been developed as a front-end module to couple with LV network to attenu ate the voltag e sig nal to ±2.5 volt. It is the common input voltage range for data acquisition unit. Figure 1. Development approach of the IED. Figure 2. Front-end module for LV network. 3. Prototype of Intelligent Electronic Device The prototype of intelligent electronic device following the hardware architecture discussed in Section 2 has been developed which is shown in Figure 3. The data acquisi- tion block has been interfaced with DSP using 5 - 6K Interface board developed by Texas Instrument. The 5 - 6K board is intended to maintain a compatible interface with the TMS320 series of DSP according to the guide- lines set forth in the TMS320 Cross-Platform Daughter Card Specification (SPRA711) [8]. Additional power of ±12 V and +5 V are required to power up the interface board which is necessary for the analog front end and analog power rail of the ADS7881, respectively. 4. Software Interface Main novelty of the device comes in the software part where the objective is to capture and process the signal in real-time continuously for a longer period of time (days or weeks). The software interface has been developed to collect and process the samples as quickly as possible. Figure 4 depicts the DSP design implementation flow diagram of the IED. It starts with initializing the neces- sary functions for bo ard support libraries, DSP and ADC interfaces, resetting interrupt and timer. The most effi- cient way of accomplishing real-time processing is by using a timer, hardware interrupt and a software interrupt. Figure 3. Prototype of the intelligent electronic device. Copyright © 2012 SciRes. SGRE 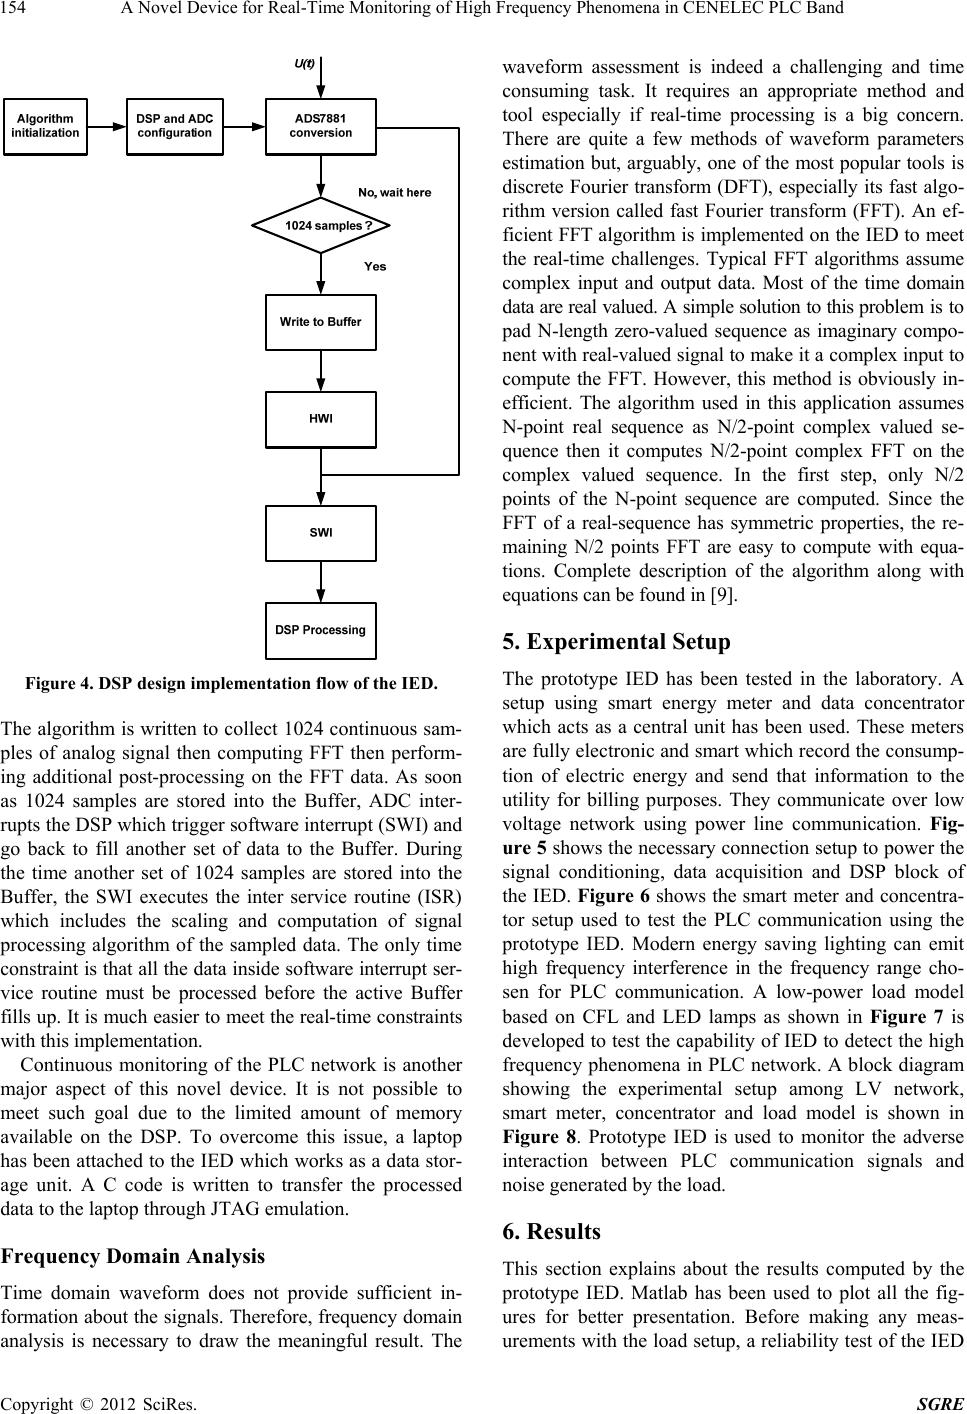 A Novel Device for Real-Time Monitoring of High Frequency Phenomena in CENELEC PLC Band 154 Figure 4. DSP design implementation flow of the IED. The algorithm is written to collect 1024 continuous sam- ples of analog signal then computing FFT then perform- ing additional post-processing on the FFT data. As soon as 1024 samples are stored into the Buffer, ADC inter- rupts the DSP which trigger software interrupt (SWI) and go back to fill another set of data to the Buffer. During the time another set of 1024 samples are stored into the Buffer, the SWI executes the inter service routine (ISR) which includes the scaling and computation of signal processing algorithm of the sampled data. The only time constraint is that all the d ata inside software interrupt ser- vice routine must be processed before the active Buffer fills up. It is much easier to meet the real-time constrain ts with this implementation. Continuous monitoring of the PLC network is another major aspect of this novel device. It is not possible to meet such goal due to the limited amount of memory available on the DSP. To overcome this issue, a laptop has been attached to the IED which works as a data stor- age unit. A C code is written to transfer the processed data to the laptop through JTAG emulation. Frequency Domain Analysis Time domain waveform does not provide sufficient in- formation about the signals. Therefore, frequency domain analysis is necessary to draw the meaningful result. The waveform assessment is indeed a challenging and time consuming task. It requires an appropriate method and tool especially if real-time processing is a big concern. There are quite a few methods of waveform parameters estimation but, arguably, one of the most popular tools is discrete Fourier transform (DFT), especially its fast algo- rithm version called fast Fourier transform (FFT). An ef- ficient FFT algorithm is implemented on the IED to meet the real-time challenges. Typical FFT algorithms assume complex input and output data. Most of the time domain data ar e real valued. A s imple solu tion to th is probl em i s to pad N-length zero-valued sequence as imaginary compo- nent with real-valued signal to make it a complex input to compute the FFT. However, this method is obviously in- efficient. The algorithm used in this application assumes N-point real sequence as N/2-point complex valued se- quence then it computes N/2-point complex FFT on the complex valued sequence. In the first step, only N/2 points of the N-point sequence are computed. Since the FFT of a real-sequence has symmetric properties, the re- maining N/2 points FFT are easy to compute with equa- tions. Complete description of the algorithm along with equations can be found i n [9]. 5. Experimental Setup The prototype IED has been tested in the laboratory. A setup using smart energy meter and data concentrator which acts as a central unit has been used. These meters are fully electronic and smart which record the consump- tion of electric energy and send that information to the utility for billing purposes. They communicate over low voltage network using power line communication. Fig- ure 5 shows the necessary connection setup to power the signal conditioning, data acquisition and DSP block of the IED. Figure 6 shows the smart meter and concentra- tor setup used to test the PLC communication using the prototype IED. Modern energy saving lighting can emit high frequency interference in the frequency range cho- sen for PLC communication. A low-power load model based on CFL and LED lamps as shown in Figure 7 is developed to test the capab ility of IED to detect the high frequency phenomena in PLC network. A block diagram showing the experimental setup among LV network, smart meter, concentrator and load model is shown in Figure 8. Prototype IED is used to monitor the adverse interaction between PLC communication signals and noise generated by the load. 6. Results This section explains about the results computed by the prototype IED. Matlab has been used to plot all the fig- ures for better presentation. Before making any meas- urements with the load setup, a reliability test of the IED Copyright © 2012 SciRes. SGRE 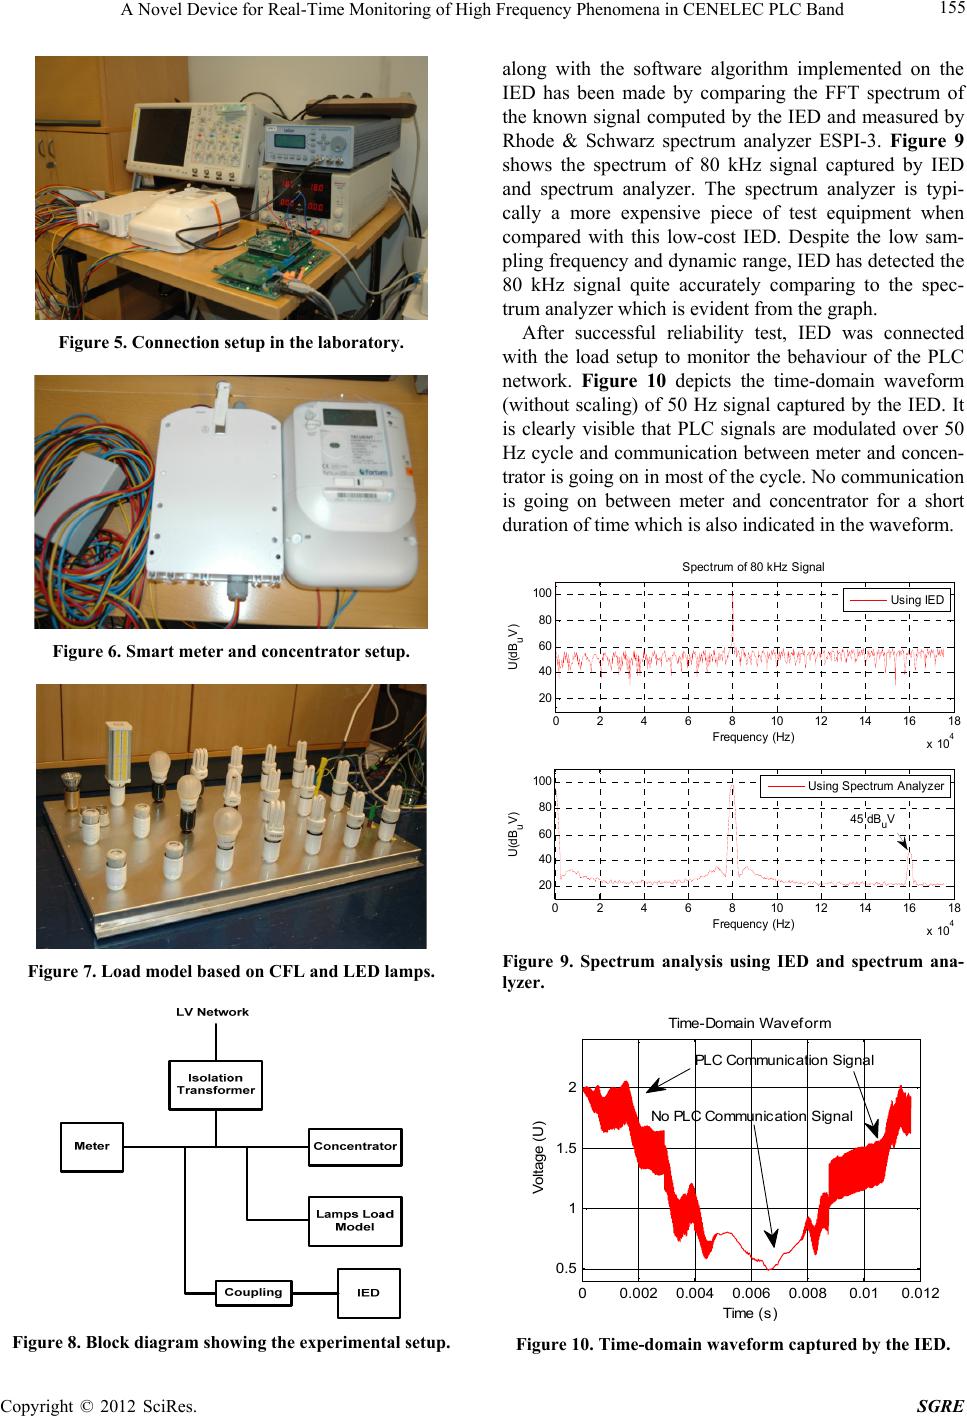 A Novel Device for Real-Time Monitoring of High Frequency Phenomena in CENELEC PLC Band 155 Figure 5. Connection se tup in the laboratory. Figure 6. Smart meter and concentrator setup. Figure 7. Load model based on CFL and LED lamps. Figure 8. Block diagram showing the experimental setup. along with the software algorithm implemented on the IED has been made by comparing the FFT spectrum of the known signal computed by the IED and measured by Rhode & Schwarz spectrum analyzer ESPI-3. Figure 9 shows the spectrum of 80 kHz signal captured by IED and spectrum analyzer. The spectrum analyzer is typi- cally a more expensive piece of test equipment when compared with this low-cost IED. Despite the low sam- pling frequency and dynamic range, IED has detected the 80 kHz signal quite accurately comparing to the spec- trum analyzer which is evident from the graph. After successful reliability test, IED was connected with the load setup to monitor the behaviour of the PLC network. Figure 10 depicts the time-domain waveform (without scaling) of 50 Hz signal captured by the IED. It is clearly visible that PLC signals are modulated over 50 Hz cycle and communication between meter and concen- trator is going on in most of the cycle. No communication is going on between meter and concentrator for a short duration of tim e whi c h i s al so i ndi cat ed i n the wavef orm. 0 2 4 6 810 12 14 16 18 x 10 4 20 40 60 80 100 Frequenc y (Hz ) U(dB u V) Usi ng IED 02 4 6 810 12 14 16 18 x 10 4 20 40 60 80 100 Frequenc y (Hz ) U(dB u V) Us i ng Spect rum A n al y zer Spectrum of 80 k Hz Si gnal 45 dB u V Figure 9. Spectrum analysis using IED and spectrum ana- lyzer. 00.0020.004 0.006 0.0080.010.012 0.5 1 1.5 2 Time-Domain Waveform Time (s) Voltage (U) PLC Communication Signal No PLC Communication Signal Figure 10. Time-domain waveform captured by the IED. Copyright © 2012 SciRes. SGRE 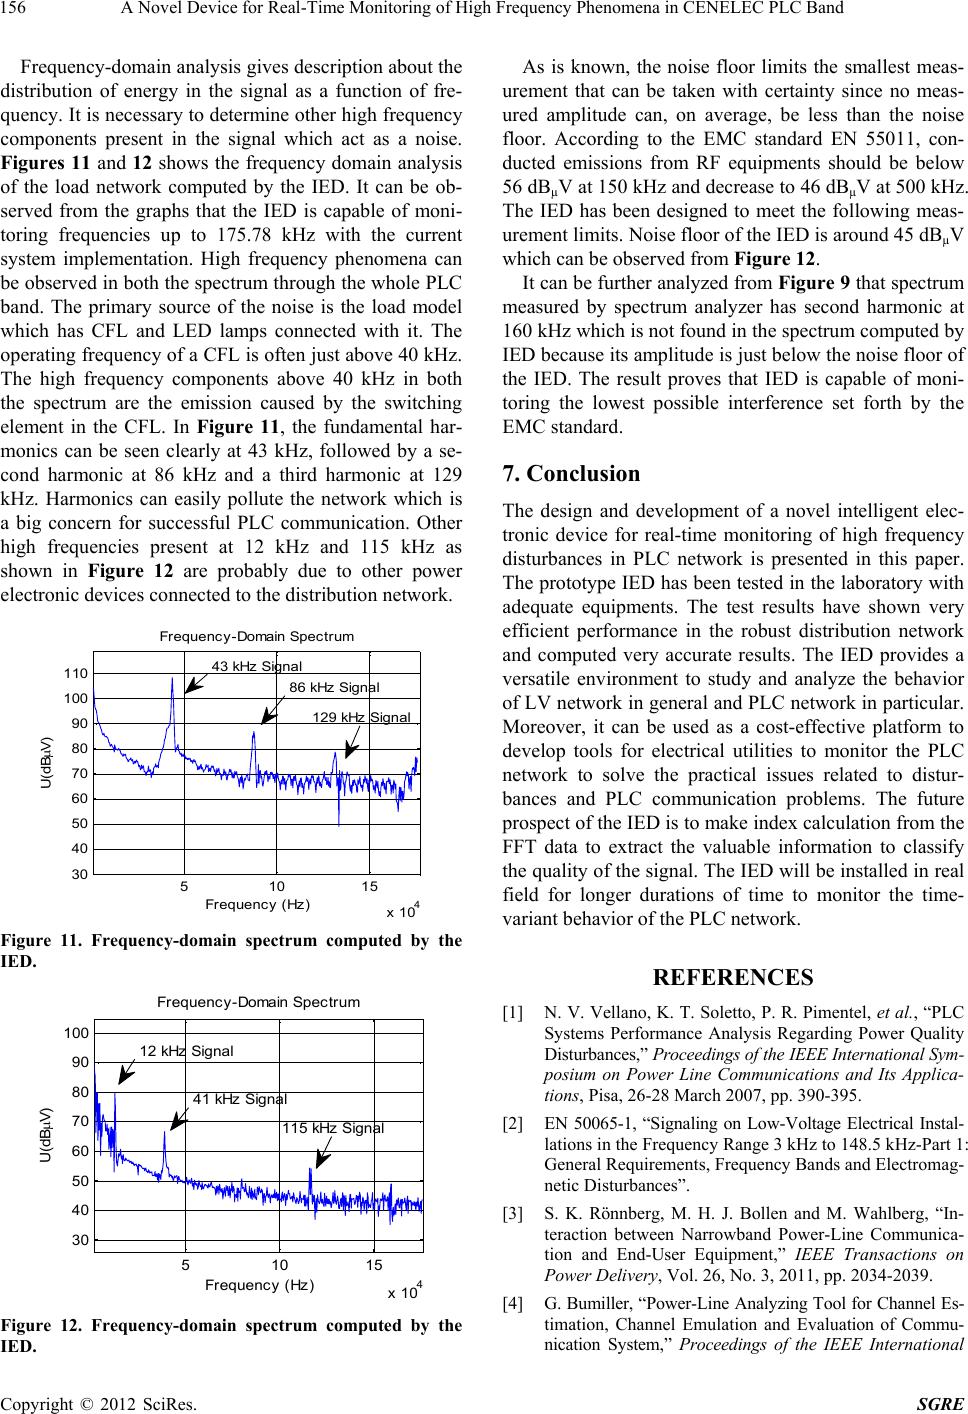 A Novel Device for Real-Time Monitoring of High Frequency Phenomena in CENELEC PLC Band 156 Frequency-domain analysis gives description about the distribution of energy in the signal as a function of fre- quency. It is necessary to determine other high frequency components present in the signal which act as a noise. Figures 11 and 12 shows the frequency domain analysis of the load network computed by the IED. It can be ob- served from the graphs that the IED is capable of moni- toring frequencies up to 175.78 kHz with the current system implementation. High frequency phenomena can be observed in both the spectrum through the whole PLC band. The primary source of the noise is the load model which has CFL and LED lamps connected with it. The operating frequ ency of a CFL is often just above 40 kH z. The high frequency components above 40 kHz in both the spectrum are the emission caused by the switching element in the CFL. In Figure 11, the fundamental har- monics can be seen clearly at 43 kHz, followed by a se- cond harmonic at 86 kHz and a third harmonic at 129 kHz. Harmonics can easily pollute the network which is a big concern for successful PLC communication. Other high frequencies present at 12 kHz and 115 kHz as shown in Figure 12 are probably due to other power electronic devices connected to the distribution network. 510 15 x 10 4 30 40 50 60 70 80 90 100 110 Frequency-Domain Spectrum Fr equency (Hz) U( dB V) 86 kHz Signal 43 kHz Signal 129 kHz Signal Figure 11. Frequency-domain spectrum computed by the IED. 510 15 x 104 30 40 50 60 70 80 90 100 Frequency-Domain Spectr um Frequency (Hz) U(dB V) 12 kHz Signal 115 kHz Signal 41 kHz Signal Figure 12. Frequency-domain spectrum computed by the IED. As is known, the noise floor limits the smallest meas- urement that can be taken with certainty since no meas- ured amplitude can, on average, be less than the noise floor. According to the EMC standard EN 55011, con- ducted emissions from RF equipments should be below 56 dBµV at 150 kHz and decrease to 46 dBµV at 500 kHz. The IED has been designed to meet the following meas- urement limits. Noise floor of the IED is around 45 dBµV which can b e observed from Figure 12. It can be further analyzed from Figure 9 that spectrum measured by spectrum analyzer has second harmonic at 160 kHz which is not found in th e spectru m computed by IED because its amplitude is just below the noise floor of the IED. The result proves that IED is capable of moni- toring the lowest possible interference set forth by the EMC standard. 7. Conclusion The design and development of a novel intelligent elec- tronic device for real-time monitoring of high frequency disturbances in PLC network is presented in this paper. The prototype IED has been tested in the lab oratory with adequate equipments. The test results have shown very efficient performance in the robust distribution network and computed very accurate results. The IED provides a versatile environment to study and analyze the behavior of LV network in general and PLC network in particular. Moreover, it can be used as a cost-effective platform to develop tools for electrical utilities to monitor the PLC network to solve the practical issues related to distur- bances and PLC communication problems. The future prospect of the IED is to make index calculation from the FFT data to extract the valuable information to classify the quality of the signal. The IED will be installed in real field for longer durations of time to monitor the time- variant behavior of the PLC network. REFERENCES [1] N. V. Vellano, K. T. Soletto, P. R. Pimentel, et al., “PL C Systems Performance Analysis Regarding Power Quality Disturbances,” Proceedings of the IEEE International Sym- posium on Power Line Communications and Its Applica- tions, Pisa, 26-28 March 2007, pp. 390-395. [2] EN 50065-1, “Signaling on Low-Voltage Electrical Instal- lations in the Frequency Range 3 kHz to 148.5 kHz-Part 1: General Requirements, Frequency Bands and Electromag- netic Disturbances”. [3] S. K. Rönnberg, M. H. J. Bollen and M. Wahlberg, “In- teraction between Narrowband Power-Line Communica- tion and End-User Equipment,” IEEE Transactions on Power Delivery, Vol. 26, No. 3, 2011, pp. 2034-2039. [4] G. Bumiller, “Power-Line Analyzing Tool for Channel Es- timation, Channel Emulation and Evaluation of Commu- nication System,” Proceedings of the IEEE International Copyright © 2012 SciRes. SGRE 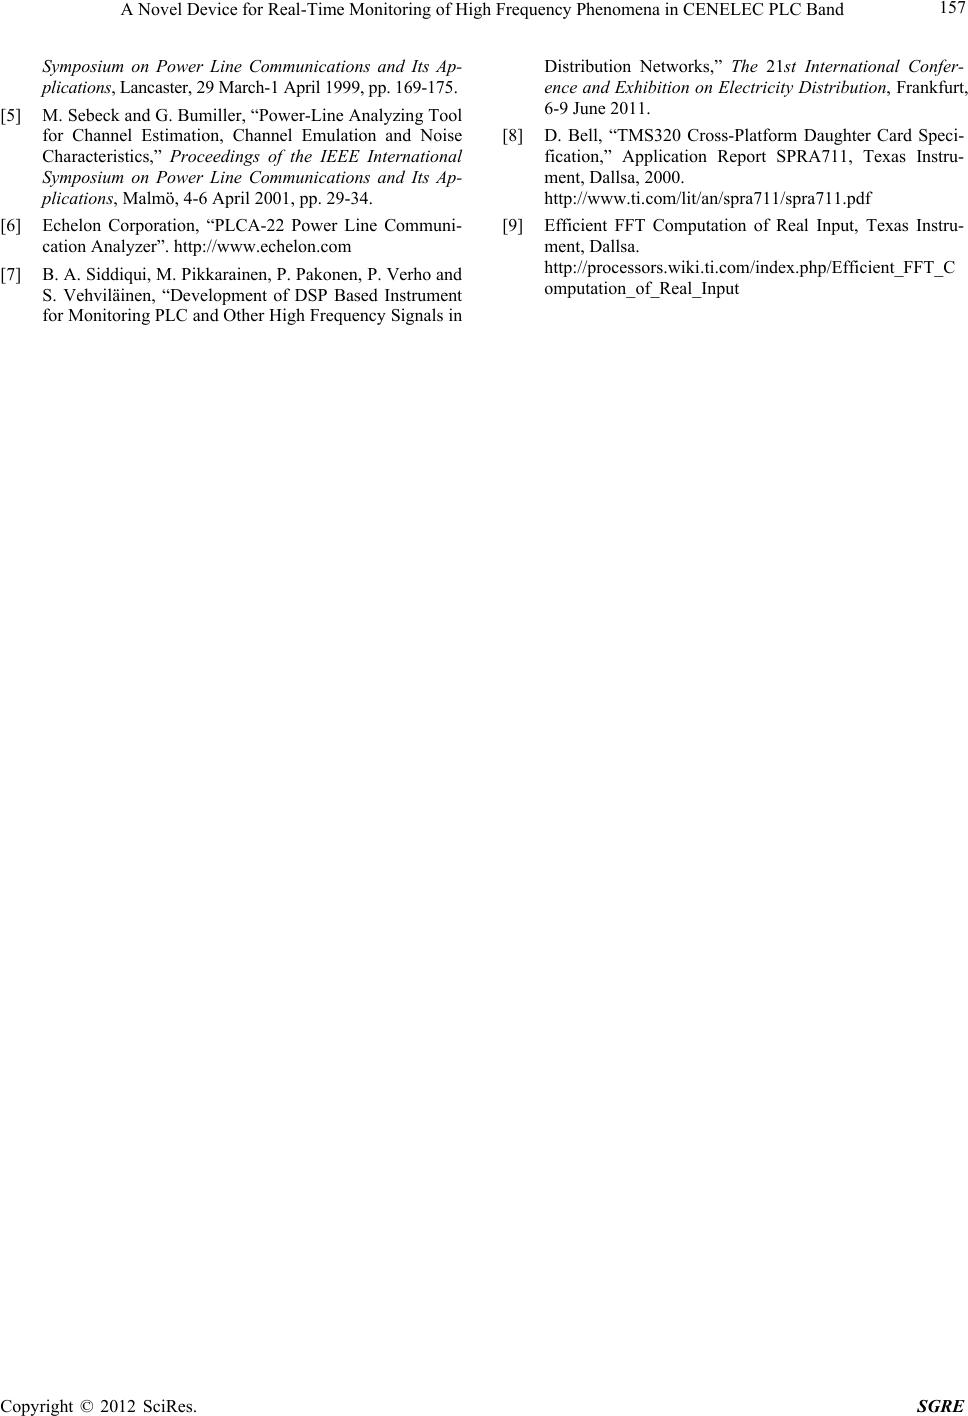 A Novel Device for Real-Time Monitoring of High Frequency Phenomena in CENELEC PLC Band Copyright © 2012 SciRes. SGRE 157 Symposium on Power Line Communications and Its Ap- plications, Lancaster, 29 March-1 April 1999, pp. 169-175. [5] M. Sebeck and G. Bumiller, “Power-Line Analyzing Tool for Channel Estimation, Channel Emulation and Noise Characteristics,” Proceedings of the IEEE International Symposium on Power Line Communications and Its Ap- plications, Malmö, 4-6 April 2001, pp. 29-34. [6] Echelon Corporation, “PLCA-22 Power Line Communi- cation Analyzer”. http://www.echelon.com [7] B. A. Siddiqui, M. Pikkarainen, P. Pakonen, P. Verho and S. Vehviläinen, “Development of DSP Based Instrument for Monitoring PLC and Other High Frequency Signals in Distribution Networks,” The 21st International Confer- ence and Exhibition on Electricity Distribution, Frankfurt, 6-9 June 2011. [8] D. Bell, “TMS320 Cross-Platform Daughter Card Speci- fication,” Application Report SPRA711, Texas Instru- ment, Dallsa, 2000. http://www.ti.com/lit/an/spra711/spra711.pdf [9] Efficient FFT Computation of Real Input, Texas Instru- ment, Dallsa. http://processors.wiki.ti.com/index.php/Efficient_FFT_C omputation_of_Real_Input |