Smart Grid and Renewable Energy, 2012, 3, 126-132
http://dx.doi.org/10.4236/sgre.2012.32018 Published Online May 2012 (http://www.SciRP.org/journal/sgre)
1
Experimental Study of a Solar Adsorption Refrigeration
Unit, Factorial Analysis
Ghassan M. Tashtoush*, Bourhan M. Tashtoush, Mustafa M. Jaradat
Mechanical Engineering Department, Jordan University of Science and Technology, Irbid, Jordan
Email: gtash@just.edu.jo
Received November 14th, 2011; revised April 28th, 2012; accepted May 4th, 2012
ABSTRACT
An experimental study was performed on an adsorption refrigeration unit powered by a solar energy and equipped with
three different types of activated carbon (1: Coconut, 2: Palm seeds, 3: Charcoal). In this Study design, factorial analy-
sis and optimization of a prototype unit were described. The activated carbon coupled with methanol was used as an
adsorbent-adsorbate pairs. Experimental tests were carried out on an adsorptive solar-powered refrigerator for the three
pairs. The temperatures of the bed of each adsorber and the corresponding refrigerator temperature for both the adsorp-
tion and desorption cycles respectively were recorded and studied as a response. Then a factorial analysis was carried
out considering the type of activated carbon and the times interval as factors. The results showed that coconut have the
highest bed temperature during the day cycle with a mean of 77.5˚C and the lowest mean temperature during the night
cycle with a mean of 12.9˚C. In addition, it was found from the analysis that the coconut shell activated carbon has the
highest coefficient of performance of 0.25.
Keywords: Solar Adsorption; Activated Carbon; HVAC, SAR
1. Introduction
Solar refrigeration system is more recognized as a prior-
ity in developing countries. This is due to the needs for
refrigeration, for food as well as for vaccine preservation.
The system is perfect for transporting temperature sensi-
tive vaccines and life-saving medical supplies because
the portable units will maintain a constant temperature
for the vaccines.
The SAR system is one of the most promising tech-
nologies because it is environmentally friendly. It has the
advantages of zero Ozone Depletion Potential (ODP),
and zero Global Warming Potential (GWP) compared to
the CFC emissions where it is considered responsible for
about one-third of the global greenhouse effect as shown
in the environmental impact of fluorocarbon traces in the
atmosphere [1]. The interest for adsorption refrigeration
or heat pumping is due to the fact that they are environ-
mentally friendly and that they can use low heat source
(such as solar energy) as driving force [2-5].
Therefore the SAR cooling system can be considered
as possible solution to the emission problem since they
operate with water and methanol, which are fully ecol-
ogically compatible and non-toxic refrigerant fluids.
In addition to domestic applications, the SAR system
is applicable for market demands because:
The system is easy to operate;
The system needs low operating cost and mainte-
nance; The system does not contain any noisy com-
ponents such as compressors and pumps;
Easy to regulate the capacity of the system.
Adsorbents are materials possess a permanent porous
structure that, at low temperatures, acts like a sponge,
soaking up or adsorbing the methanol (the refrigerant).
As the temperatures elevated, the refrigerant released or
desorbed. This adsorption cycle is silent in operation and
most suited for remote locations without electricity sup-
ply since they can be powered by purely thermal energy
like solar energy.
In the SAR system the adsorbent packed in a sealed
collector painted black to enhance the solar radiation ab-
sorption. The solar energy heats the high concentration of
adsorbent and container to the maximum cycle tempera-
ture during the day time where the refrigerant starts de-
sorbing from the adsorbent. In the condenser the refriger-
ant vapor changed to liquid and moves by gravity to the
receiver or directly to the evaporator as shown in the
schematic diagram in Figure 1. The adsorbent is cooled
down to near ambient temperature, during the night cycle,
thus reducing the pressure of the entire system. The re-
frigerant boils in the evaporator and causes heat to be
*Corresponding author.
Copyright © 2012 SciRes. SGRE
Experimental Study of a Solar Adsorption Refrigeration Unit, Factorial Analysis 127
Figure 1. Photograph of the designed prototype.
absorbed from the immediate environment and the ad-
sorbent pressure equals the saturated vapor pressure of the
refrigerant, As a result the refrigerant vapor is re-adsorbed
into the adsorbent, while cooling effect is produced [2].
Various studies conducted to determine the suitable
adsorbent–adsorbate pairs for various applications also to
quantify the cooling coefficient of performance (COP)
with respect to the operating temperatures [6-11]. The
disadvantage of such systems was the low heat transfer
coefficient in the adsorbent bed, which influence the
thermodynamic efficiency of the SAR system.
Recently a lot of attention has been paid to use adsorp-
tion refrigeration systems for both ice-making and air
conditioning. For example, activated carbon-methanol is a
good working pairs where experimental results have been
obtained with a heat source of about 90˚C - 100˚C and a
specific cooling power of 2.6 kg ice/day per kg-adsorbent
for ice-making and 150 W/Kg-adsorbent for air condi-
tioning was achieved. More work regarding activated
carbon-methanol pairs for ice-making is required, in
which 5 Kg-ice/day per Kg adsorbent will be expected.
The adsorption cycle for refrigeration or heat pumping
is a succession of two periods: 1) Heating-desorption-con-
densation period at high pressure (saturation pressures of
the adsorbate at the temperature of the condenser); 2)
cooling-adsorption-evaporation period at low pressure
(saturation pressures of the adsorbate at the temperature
of the evaporator).
In this research an experimental study of a solar ad-
sorption refrigeration system was performed with three
different types of activated carbon as an adsorbents
paired with methanol as the adsorbate. Statistical analysis
then performed to compare the three different types used
and to choose the best one among them.
2. Designs of Experiments
In this study, we have an experiment that includes two
factors that we think they will be an important part of the
way we learn about how the system works. Those factors
are:
1) The adsorbent type in three levels:
Coconut-shells,
Palm seed,
Charcoal.
2) The time interval: this factor contains ten levels for
each cycle i.e. ten levels for desorption cycle (day cycle),
and ten levels for adsorption cycle (night cycle).
The levels of the factors were selected randomly from
larger populations of factor levels to insure unbiased re-
sults, and we wish to extend our conclusion to the entire
population of factor levels. Three types of activated car-
bon were selected because they can be desorbed or
charged by using low-grade thermal energy provided by
flat-plate solar collector, which is commercially available
in Jordan. Jordan has different climatic regions with a
good solar insolation level (mean insolation is 650 W/m2)
and the sun rises in most days of the year. For example,
Ghor Safi and Aquaba in summer times have solar radia-
tion time exceeding eleven hours and few full cloudy
days. For these reasons, Jordan will be a good place to
construct solar cooling systems.
The simple adsorption-refrigeration cycle consists of
two vessels that are connected to each other’s by conduit.
The first vessel works as adsorber in the discharging proc-
ess and as generator in the charging process. The second
vessel contains the adsorbate that works as evaporator in
the discharging process and as condenser in charging
process as shown in Figure 2.
The designed SAR unit shown in Figure 1 consists of
the following components:
1) Flat plate collector with three adsorbers.
2) A condenser and evaporator used on the prototype
already exist on the absorption refrigerant connected with
the refrigerant header. The condenser is supplied with
squared steel sheets that act as fins to increase the surface
area so that increasing the heat losses from the condens-
ing refrigerant to the environmental medium.
Figure 2. Solar Adsorption Refrigeration scheme. (a) Cold
production and adsorption stage; (b) Heating and desorp-
tion stage [7].
Copyright © 2012 SciRes. SGRE
Experimental Study of a Solar Adsorption Refrigeration Unit, Factorial Analysis
128
3) Storage tanks (Two, 0.5 m3 each), the first one is for
hot water storage (this water may be considered as by-
product for domestic applications) while the second one
is for tap water that is used to absorb the energy liberated
during the adsorption process (during the night cycle).
4) Conduits for fluid transfer, these conduits connect
the evaporator with the adsorber and the condenser. An-
other group of conduits connects the solar system with
adsorbers. It is recommended that conduits must not have
a large number of elbows and their lengths are as short as
possible to decrease pressure drop.
Experimentation was performed on three adsorbents
(Activated carbons) contained in the bed. The bed of
each adsorber consists of one type of the three activated
carbon (coconut shells, palm seed and charcoal), located
on fine steel sieves. The activated carbons are of the
same grade so that the comparison is made under the
same conditions. To acquire the heat that will be released
during the adsorption process copper tubes pass through
the adsorber. The flat plate collector (1.78 × 0.78 m2 and
20 cm thick) is made of steel shells. A grid holds 15 kg
of activated carbon (5 kg for each bed) in the upper shell,
which plays the role of solar collector. It is covered by a
thin black sheet (5 mm), and a single glass, the flat plate
collector is 40˚ tilted to maximize the solar energy col-
lected. A valve opens into a common header connected
to each bed such that the operating bed is the one with
the opened valve. Each bed was separated from the adja-
cent with an insulation fiber so that the readings will be
individual and more reliable.
A black sheet is placed directly over the activated
carbon in order to increases the absorption of the solar
radiation. A space separates the black sheet from a glass
panel of about 5 cm. 5 mm thick glass panel covers each
bed to prevent the long wave radiation from escape like a
greenhouse effect.
Four thermocouples in this experiment were used to
measure the temperature inside the system: three for the
beds and located inside the activated carbon and the forth
is located inside the refrigerant that is loaded with about
4 kg of food.
3. Results and Discussion
The SAR unit shown in Figure 1 was used to experi-
mentally study the effect of the three adsorbent types
(coconut shell, palm seed, and charcoal) on its optimal
cooling temperature, thus recommending the most ap-
propriate adsorbent for such systems. The data were tak-
en during the month of June using data harvest in- stru-
ment and analyzed statistically with two factors, three
levels for the first factor and ten levels for the second
factor as described before. Since the levels of the factors
are not equal; general full factorial design technique was
used. The results for the above setting are discussed in
the following.
Figures 3 show the adsorbent temperature using the
three adsorbers. Each set of data represents the bed tem-
perature for each activated carbon used as function of
time during the day time under the sunny conditions.
It can be seen that coconut shell had the highest bed
temperature between the three beds followed by palm
seed, where the maximum temperatures for coconut shell,
palm seed and charcoal were 108˚C, 97˚C and 92˚C, re-
spectively.
Figure 4 shows the refrigerator temperatures using co-
conut shell as an adsorber in the bed, in which the mini-
mum temperature reached in the refrigerator was 8 ˚C at
27˚C ambient temperature. The effective refrigeration
started at 21:22 and the temperature decreased gradually
until it reached 8˚C at 01:22 next day then it increased.
Using palm seed as an adsorber in the bed, the mini-
mum temperature could be reached was 10˚C at 02:51.
The cooling starts at 21:51 until it reached to the mini-
mum temperature and then start to increase.
0
20
40
60
80
100
01020
Time (hr)
Adsorbent bed temperature (
˚C)
120
30
Coconut
Char coal
Palmseed
Figure 3. Adsorbent bed temperature using three types of
activated car bon.
Figure 4. Refrigerant temperatures during the adsorption
process for the three activated carbon.
Copyright © 2012 SciRes. SGRE
Experimental Study of a Solar Adsorption Refrigeration Unit, Factorial Analysis 129
On the other hand, the cooling starts at 22:31 until it
reaches the minimum temperature 14˚C at 03:31 when
using charcoal as an adsorber in the bed. Compared to
previous two adsorbers, a lag in the cooling starting time
is clearly observed. These differences could be explained
based on the fact that activated carbons produced from
different raw materials may have much different adsorb-
ent qualities. For large adsorption capacity, a large spe-
cific surface area is preferable, but the creation of a large
internal surface area in a limited volume inevitably gives
rise to large numbers of small sized pores between ad-
sorption surfaces. The size of the microspores determines
the accessibility of adsorbate molecules to the internal
adsorption surface, so the pore size distribution of micro-
spores is another important property for characterizing
adsorptivity of adsorbents.
3.1. Coefficient of Performance (COP)
Calculation
The coefficient of performance, COP, is the ratio of de-
sired result to input which used as an index of perform-
ance of a refrigerator or heat pump. This measure of per-
formance may be larger than 1, and we want the COP to
be as large as possible.
In an operating cycle the input is the network into the
device and the desired result is the heat supplied at the
low temperature so the COP definition is
,net in
W
COP L
R
Q
The maximum coefficient of performance for the re-
frigerator may be calculated as:


COP
g
ae
C
LTT T
Q
Q

110 C383.15 K
g
T
101C374.15 K,
g
T
92 C365.15 K,
14 C287.15 K,
300.15 K
g
e
ac
T
T
TT



310 260abn  


0.05,2,30
,1, 1
0.05,9,30
,1,1
4.17
2.21
aabn
babn
ff
ff




R
HL geg c
QQ QTT T
For the coconut shells activated carbon adsorber
27 C300.15 K
8 C281.15 K
ca
e
TT
T


And the maximum coefficient of performance will equal
to (0.31). Similarly for the palm seed activated carbon
10 C283.15 K,
300.15 K
e
ac
T
TT


The maximum COP will equal to (0.3), and lastly for the
charcoal activated carbon we have the following
temperatures (the maximum COP will equal to (0.25).
In reality the coefficient of performance for such sys-
tems ranges from 0.3 to 0.8 (as found in the literature)
and this depends on the adsorption pair in use and on the
solar collector specification.
3.2. Statistical Analysis
Based on the adsorber temperature data (during the day
cycle) it was found that there are two factors of interest;
the first factor is the adsorber type, which has three levels
1) the coconut shell; 2) the palm seed; 3) and charcoal.
The second factor is the time which has ten levels. Each
run has two replicates and the data were collected ran-
domly; so that to get unbiased estimation.
The statistical output for the desorption cycles includ-
ing the fits and the residuals were achieved by using the
general full factorial design since the level are not bal-
anced for each factors. These output contains sixty runs
resulted from this equation ( where
a = 3 is the number of levels for the adsorbent type factor,
b = 10 is the number of levels for the time factor, and n =
2 is the number of replicates). The residual describes the
error in the fit of model to the ith observation which is
used to check the assumption that the errors were ap-
proximately normally distributed with constant variance.
Table 1 represents the analysis of variance for the
beds temperature using adjusted sum of square for tests.
This table shows the degrees of freedom for each source.
The total degree of freedom (DF) is equal to one less
than the total number of runs (DF = 60 – 1 = 59). This
table shows the analysis of variance procedure for the
solar adsorption refrigeration cycle. From this analysis,
the F-value for the adsorbent equal to 13.54 compared to
the F value read from the F-distribution with a level of
significance α = 0.05 as follows;
where both f values are obtained from (Table V: per-
centage of the F-Distribution, Montgomery) [12]. Since
the F-value >0.05,2,30 4.17f
and 0.05,9,30 , It can
be concluded that there is main effects of adsorbent type
and the time interval on the temperature of the beds.
f2.21
Table 1. Analysis of Variance for beds temperature versus
adsorbent type; day time, using adjusted SS for tests.
Source DFSeq SS Adj SS Adj MS F P
Adsorbent2 503.10 503.10 251.55 13.540.0
Time 9 24324.7524324.75 2702.7 145.40.0
Adsorb-
ent*Time 18 83.90 83.90 4.66 0.250.998
Error 30 557.50 557.50 18.58
Total 59 25469.25
Copyright © 2012 SciRes. SGRE
Experimental Study of a Solar Adsorption Refrigeration Unit, Factorial Analysis
130
Furthermore, since 0.05,2,30 4.17 0.25f
, there is no
indication of interaction between these two factors as
clearly shown in Figure 5.
Almost no interaction was shown between the three
different adsorbents. While for the time intervals an in-
teraction between the sixth and seventh intervals (13:33
and 14:33) is clearly shown.
Figure 6 shows the residuals versus the order of the
data where the response is the beds temperature for de-
sorption cycles. It can be easily seen that the plot does
not indicate any serious model inadequacies since the
data are uniformly distributed. The normality probability
plot of residuals is depicted in Figure 7 showing a little
bit tails that do not fall exactly along a straight line pass-
ing through the center of the plot.
This indicates some potential problem with the nor-
mality assumption. However, no serve deviations or any
model adequacy from normality are obvious apparent.
The beds temperature increase during the day as the
sun rises until it reaches the peak at the noontime and
then it is decreases until the sunset. It is also clear that
the activated coconut shell has the highest mean bed
temperature of 77.5˚C.
Figure 8 shows the effects plot and the data means for
the beds temperature during desorption cycle. It is clearly
seen that there is a main effect of the two variables (ad-
sorbent type and time) on the bed temperature response.
Figure 9 shows comparative box plots for the beds
temperature data for the three types of adsorbents during
the day cycle (desorption). These comparative box plots
indicate that the median of the coconut shell was the
highest of the three adsorbers followed by the palm seed
and the charcoal. The box-and-whisker plot shows the
variability of the observations within a treatment (factor
level) and the variability between the treatments. The co-
conuts shell adsorber has a slightly large sample disper-
sion or variance as shown.
Figure 5. Interaction plot-data means for the beds tempera-
ture.
Figure 6. Residual versus the order of data (response is the
bed temperature).
Figure 7. Normal probability plots of the residuals (re-
sponse is the beds temperature).
Figure 8. Main effect plot-data means for beds temperature.
Figure 9. Box-and-whisker plots of beds temperature for
the three different adsorbers.
Copyright © 2012 SciRes. SGRE
Experimental Study of a Solar Adsorption Refrigeration Unit, Factorial Analysis 131
The analysis of variance for desorption cycle was
summarized in Table 2 at level of significance α of 0.05.
From the F-distribution tables;

0.05, 2 , 30
,1, 13.32
aabn
ff



0.05, 9 ,30
,1,12.16
babn
ff


1.02f
a
nd .
Since the F value > 7.16, it can be concluded that there
is a main effects of adsorbent type and the time on the
refrigerator temperature. And since 0.05,2,30 there
is no indications of interaction between these factors.
Again, the residuals are equal to the collected refrigerator
temperatures minus the fitted ones.
Figure 10 shows the effects plot and the data means
for the refrigerator temperature during the adsorption
cycle. It is seen that there are large main effects of the
two factors especially for the first factor (the adsorbent
type) on the response. As shown in the figure the coconut
shell A.C. has the lowest temperature effect on the re-
frigerator followed by the palm seed (3) and charcoal (2).
Figure 11 shows the interactions between the vari-
ables belong to the adsorption cycle. It is obviously seen
that no interactions were obtained. Figure 12 shows a
comparative box-and-whisker plot of the refrigerator
temperature, during the adsorption cycle, for the three
adsorbers.
It is obviously seen the adsorber 1) (coconut shell A.C)
has the lowest median of 12.9˚C followed by adsorber; 2)
(the palm seed A.C.) with a median of 15.3˚C and lastly
the adsorber; 3) (the charcoal A.C.) with a median of
17.4˚C. In addition, it is shown that the three adsorbers
had a large sample variance especially the charcoal ad-
sorber since the whisker from the lower quartile to the
minimum value is too small compared to the whisker
from the upper quartile to the maximum value. Figure 13
shows the residuals versus the data order during the ad-
sorption cycle, where the response was the refrigerator
temperature. It is seen clearly from the figure that there is
an inadequacy in the data distribution and there is an
inequality of the variance.
The normal probability plot of the residuals, during the
adsorption cycle, for the refrigerator temperature as the
response is shown in Figure 14. It is clearly seen that
Table 2. Analysis of Variance for refrigerator temperature
versus adsorbent type; night time, using adjusted SS for
tests.
Source DF Seq SS Adj SS Adj MS F P
Adsorbent 2 202.800 202.800 101.400 41.390.000
Night time
(NT) 9 1121.750 1121.750 124.639 50.870.000
Adsor*NT 18 45.200 45.200 2.511 1.020.463
Error 30 73.500 73.500 2.450
Total 59 1443.250
Figure 10. Main effect plot-data means for refrigerator tem-
perature.
Figure 11. Interaction plot-data means for the refrigerator
temperature.
Figure 12. Box-and-whisker plots of the refrigerator tem-
perature for the three different adsorbents.
Figure 13. Residuals versus the order of the data (the re-
sponse is the refrigerator temperature).
Copyright © 2012 SciRes. SGRE
Experimental Study of a Solar Adsorption Refrigeration Unit, Factorial Analysis
Copyright © 2012 SciRes. SGRE
132
REFERENCES
[1] J. A. Edmonds, D. L. Wuebles and M. J. Scott, “Energy
and Radiative Precursor Emissions,” International Con-
ference on Alternative Energy Sources, Miami, 14-16 De-
cember 1987.
[2] F. Zigler, “Recent Development and Future Prospects of
Sorption Heat Pump Systems,” International Journal of
Thermals, Vol. 38, No. 3, 1999, pp. 191-208.
doi:10.1016/S1290-0729(99)80083-0
[3] E. B. Miller “The Development of Silica Gel Refrigera-
tion,” Refrigeration Engineering, Vol. 17, No. 4, 1929, pp.
103-108.
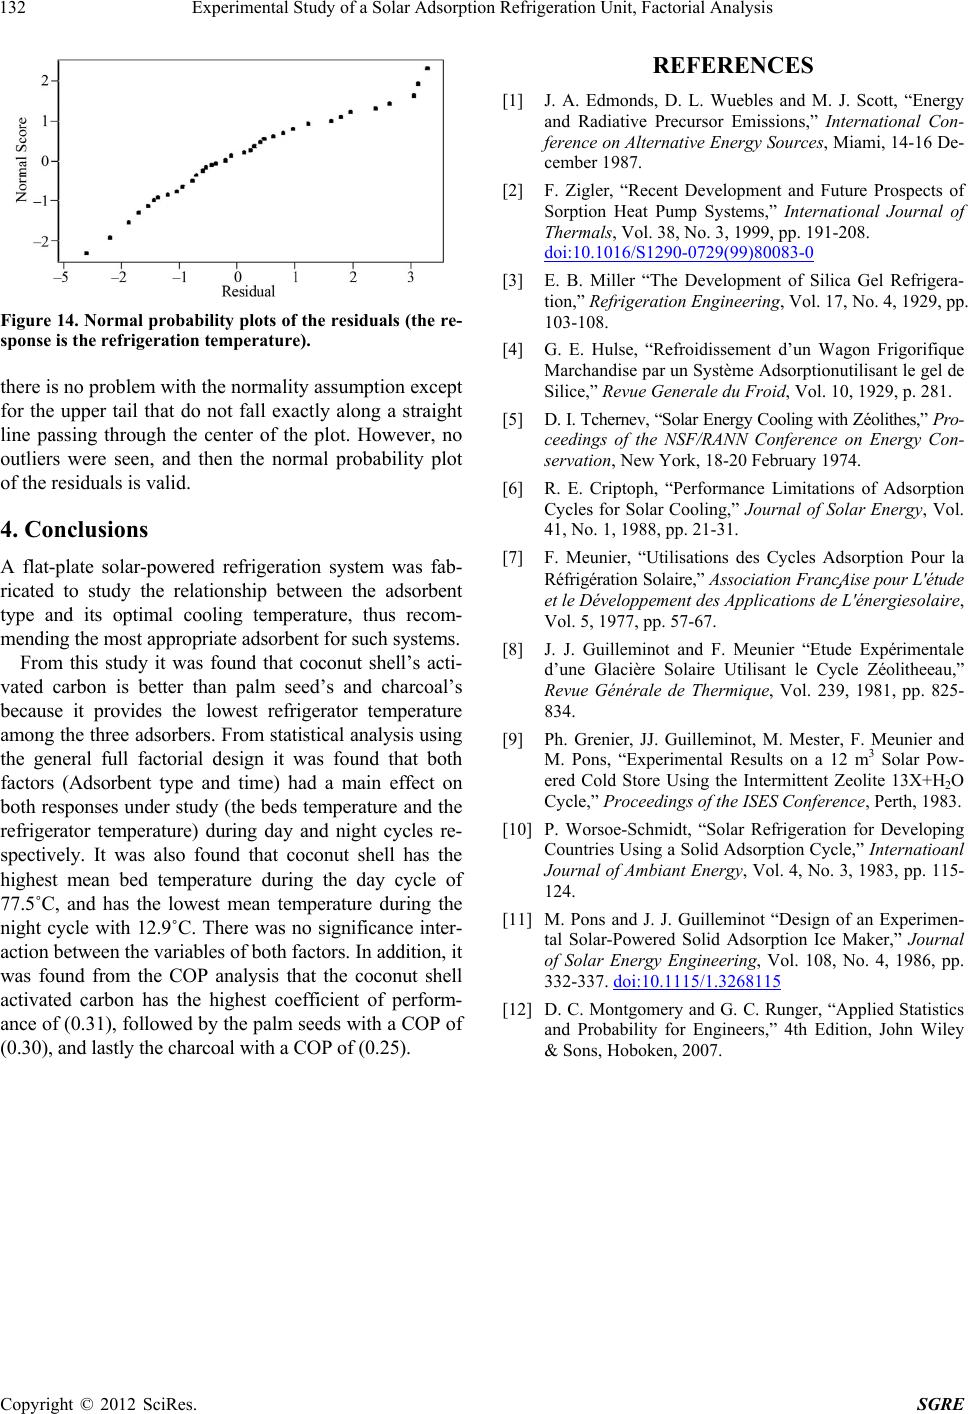
Figure 14. Normal probability plots of the residuals (the re-
sponse is the refrigeration temperature). [4] G. E. Hulse, “Refroidissement d’un Wagon Frigorifique
Marchandise par un Système Adsorptionutilisant le gel de
Silice,” Revue Generale du Froid, Vol. 10, 1929, p. 281.
there is no problem with the normality assumption except
for the upper tail that do not fall exactly along a straight
line passing through the center of the plot. However, no
outliers were seen, and then the normal probability plot
of the residuals is valid.
[5] D. I. Tchernev, “Solar Energy Cooling with Zéolithes,” Pro-
ceedings of the NSF/RANN Conference on Energy Con-
servation, New York, 18-20 February 1974.
[6] R. E. Criptoph, “Performance Limitations of Adsorption
Cycles for Solar Cooling,” Journal of Solar Energy, Vol.
41, No. 1, 1988, pp. 21-31.
4. Conclusions
[7] F. Meunier, “Utilisations des Cycles Adsorption Pour la
Réfrigération Solaire,” Association Franc
̧
Aise pour L'étude
et le Développement des Applications de L'énergiesolaire,
Vol. 5, 1977, pp. 57-67.
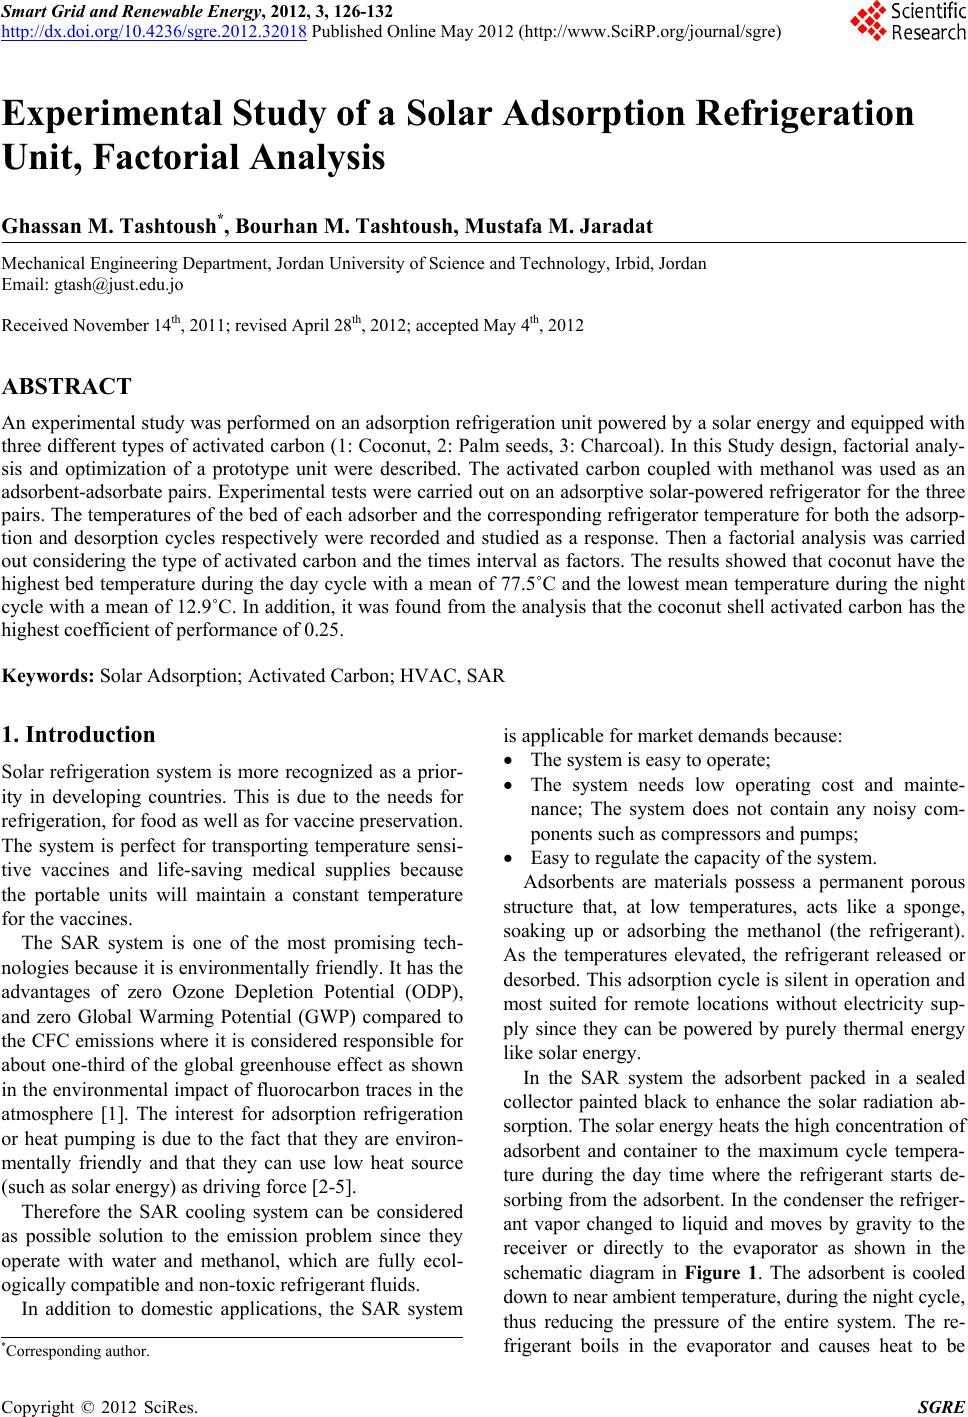
A flat-plate solar-powered refrigeration system was fab-
ricated to study the relationship between the adsorbent
type and its optimal cooling temperature, thus recom-
mending the most appropriate adsorbent for such systems. [8] J. J. Guilleminot and F. Meunier “Etude Expérimentale
d’une Glacière Solaire Utilisant le Cycle Zéolitheeau,”
Revue Générale de Thermique, Vol. 239, 1981, pp. 825-
834.
From this study it was found that coconut shell’s acti-
vated carbon is better than palm seed’s and charcoal’s
because it provides the lowest refrigerator temperature
among the three adsorbers. From statistical analysis using
the general full factorial design it was found that both
factors (Adsorbent type and time) had a main effect on
both responses under study (the beds temperature and the
refrigerator temperature) during day and night cycles re-
spectively. It was also found that coconut shell has the
highest mean bed temperature during the day cycle of
77.5˚C, and has the lowest mean temperature during the
night cycle with 12.9˚C. There was no significance inter-
action between the variables of both factors. In addition, it
was found from the COP analysis that the coconut shell
activated carbon has the highest coefficient of perform-
ance of (0.31), followed by the palm seeds with a COP of
[9] Ph. Grenier, JJ. Guilleminot, M. Mester, F. Meunier and
M. Pons, “Experimental Results on a 12 m3 Solar Pow-
ered Cold Store Using the Intermittent Zeolite 13X+H2O
Cycle,” Proceedings of the ISES Conference, Perth, 1983.
[10] P. Worsoe-Schmidt, “Solar Refrigeration for Developing
Countries Using a Solid Adsorption Cycle,” Internatioanl
Journal of Ambiant Energy, Vol. 4, No. 3, 1983, pp. 115-
124.
[11] M. Pons and J. J. Guilleminot “Design of an Experimen-
tal Solar-Powered Solid Adsorption Ice Maker,” Journal
of Solar Energy Engineering, Vol. 108, No. 4, 1986, pp.
332-337. doi:10.1115/1.3268115
[12] D. C. Montgomery and G. C. Runger, “Applied Statistics
and Probability for Engineers,” 4th Edition, John Wiley
& Sons, Hoboken, 2007.
(0.30), and lastly the charcoal with a COP of (0.25).