Paper Menu >>
Journal Menu >>
 American Journal of Analytical Chemistry, 2010, 1, 14-24 doi:10.4236/ajac.2010.11002 Published Online May 2010 (http://www.SciRP.org/journal/ajac) Copyright © 2010 SciRes. AJAC The Thermodynamic Dissociation Constants of Azathioprine by the Nonlinear Regression and Factor Analysis of Multiwavelength Spectrophotometric pH-Titration Data Milan Meloun1*, Zuzana Ferenčíková1, Aleš Vrána2 1Department of Analytical Chemistry, University of Pardubice, Pardubice, Czech Republic 2Teva Czech Industries, s.r.o., Opava, Czech Republic E-mail: milan.meloun@upce.cz Received January 10, 2009; revised February 21, 2009; accepted February 23, 2009 Abstract The mixed dissociation constant of azathioprine—chemically 6-(3-methyl-5-nitroimidazol-4-yl)sulfanyl-7H- purine at various ionic strengths I of range 0.01-0.2, and at temperatures of 25℃ and 37℃, was determined with the use of two different multiwavelength and multivariate treatments of spectral data, SPECFIT32 and SQUAD(84) nonlinear regression analyses and INDICES factor analysis according to a general rule. First, the number of components is determined, and then the spectral responses and concentrations of the compo- nents are calculated. Concurrently, the experimental determination of the thermodynamic dissociation con- stant T p a K was in agreement with its computational prediction of the PALLAS programme based on knowledge of the chemical structures of the drug. The factor analysis in the INDICES programme predicts the correct number of two light-absorbing species L- and HL. The thermodynamic dissociation constant T p a K of azathioprine was estimated by nonlinear regression of {pKa, I} data, T p a K = 8.07(1) at 25℃ and 7.84(1) at 37℃, where the figure in brackets is the standard deviation in last significant digits. The reliability of the dissociation constants of azathioprine was proven with goodness-of-fit tests of the multiwavelength spectrophotometric pH-titration data. Keywords: Spectrophotometric Titration, Dissociation Constant, Azathioprine, SPECFIT, SQUAD, INDICES, PALLAS 1. Introduction Azathioprine [1], an immunosuppressant, is a drug that is used to suppress the immune system. It is used to treat patients who have undergone kidney transplantation and for diseases in which activity of the immune system is important (psoriasis, severe cutaneous lupus erythema- tosus, rheumatoid arthritis, severe atopic dermatitis (ec- zema), cutaneous vasculitis etc.). Azathioprine is a prod- rug (a precursor of a drug) which is converted in the body to its active form called mercaptopurine (Puri- nethol). The exact mechanism of action of azathioprine is not known. Like other immunosuppressants, it suppresses the pro- liferation of T and B lymphocytes, types of white blood cells that are part of the immune system and defend the body against both infectious diseases and foreign materi- als. For example, in the case of organ transplantation, immunosuppressants prevent the body from immu- nologically rejecting the new organ. In the case of auto- immune diseases (diseases caused by an abnormal im- mune reaction against the body’s own tissues) such as rheumatoid arthritis, suppressing the immune system reduces the inflammation that accompanies immune re- actions and slows damage to the joints caused by the inflammation. Azathioprine is a pale yellow, odourless powder. It is insoluble in water, soluble in dilute solutions of alkali hydroxides, sparingly soluble in dilute mineral acids and very slightly soluble in alcohol and in chloroform. The sodium salt of azathioprine is sufficiently soluble to make a 10 mg/mL water solution which is stable for 24 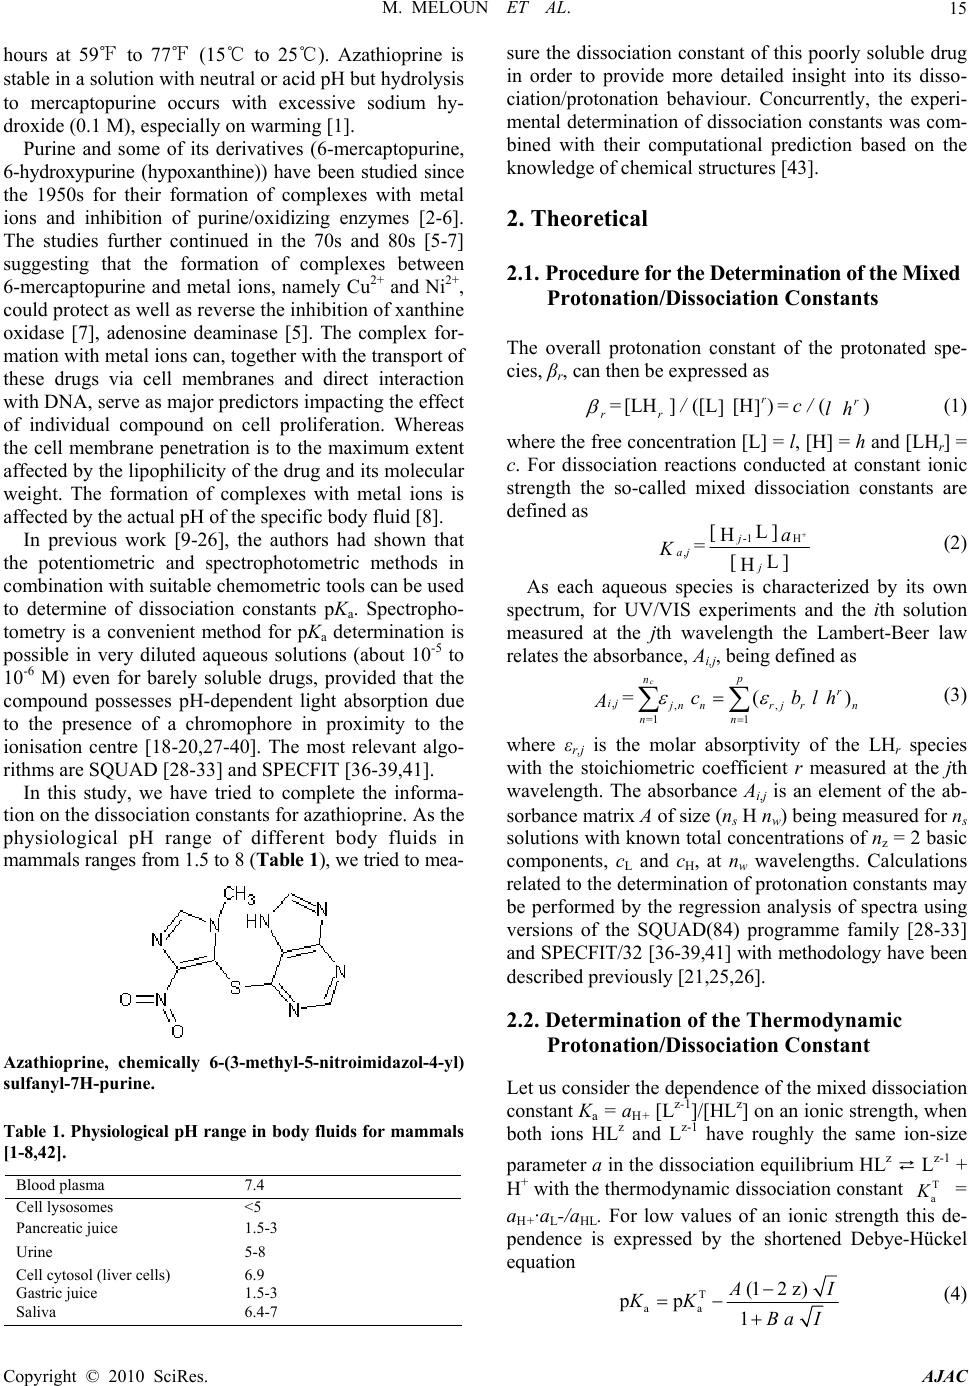 M. MELOUN ET AL.15 hours at 59℉ to 77℉ (15℃ to 25℃). Azathioprine is stable in a solution with neutral or acid pH but hydrolysis to mercaptopurine occurs with excessive sodium hy- droxide (0.1 M), especially on warming [1]. Purine and some of its derivatives (6-mercaptopurine, 6-hydroxypurine (hypoxanthine)) have been studied since the 1950s for their formation of complexes with metal ions and inhibition of purine/oxidizing enzymes [2-6]. The studies further continued in the 70s and 80s [5-7] suggesting that the formation of complexes between 6-mercaptopurine and metal ions, namely Cu2+ and Ni2+, could protect as well as reverse the inhibition of xanthine oxidase [7], adenosine deaminase [5]. The complex for- mation with metal ions can, together with the transport of these drugs via cell membranes and direct interaction with DNA, serve as major predictors impacting the effect of individual compound on cell proliferation. Whereas the cell membrane penetration is to the maximum extent affected by the lipophilicity of the drug and its molecular weight. The formation of complexes with metal ions is affected by the actual pH of the specific body fluid [8]. In previous work [9-26], the authors had shown that the potentiometric and spectrophotometric methods in combination with suitable chemometric tools can be used to determine of dissociation constants pKa. Spectropho- tometry is a convenient method for pKa determination is possible in very diluted aqueous solutions (about 10-5 to 10-6 M) even for barely soluble drugs, provided that the compound possesses pH-dependent light absorption due to the presence of a chromophore in proximity to the ionisation centre [18-20,27-40]. The most relevant algo- rithms are SQUAD [28-33] and SPECFIT [36-39,41]. In this study, we have tried to complete the informa- tion on the dissociation constants for azathioprine. As the physiological pH range of different body fluids in mammals ranges from 1.5 to 8 (Table 1), we tried to mea- Azathioprine, chemically 6-(3-methyl-5-nitroimidazol-4-yl) sulfanyl-7H-purine. Table 1. Physiological pH range in body fluids for mammals [1-8,42]. Blood plasma 7.4 Cell lysosomes <5 Pancreatic juice 1.5-3 Urine 5-8 Cell cytosol (liver cells) 6.9 Gastric juice 1.5-3 Saliva 6.4-7 sure the dissociation constant of this poorly soluble drug in order to provide more detailed insight into its disso- ciation/protonation behaviour. Concurrently, the experi- mental determination of dissociation constants was com- bined with their computational prediction based on the knowledge of chemical structures [43]. 2. Theoretical 2.1. Procedure for the Determination of the Mixed Protonation/Dissociation Constants The overall protonation constant of the protonated spe- cies, βr, can then be expressed as [LH ]([L[H )() ]] rr r r= / = c / lh (1) where the free concentration [L] = l, [H] = h and [LHr] = c. For dissociation reactions conducted at constant ionic strength the so-called mixed dissociation constants are defined as -1 H , [ L ] H [ L ] H j aj j a = K (2) As each aqueous species is characterized by its own spectrum, for UV/VIS experiments and the ith solution measured at the jth wavelength the Lambert-Beer law relates the absorbance, Ai,j, being defined as ,,, 1 1 ( cp n r ij jnnr jrn n n= = cblh A ) (3) where εr,j is the molar absorptivity of the LHr species with the stoichiometric coefficient r measured at the jth wavelength. The absorbance Ai,j is an element of the ab- sorbance matrix A of size (ns nw) being measured for ns solutions with known total concentrations of nz = 2 basic components, cL and cH, at nw wavelengths. Calculations related to the determination of protonation constants may be performed by the regression analysis of spectra using versions of the SQUAD(84) programme family [28-33] and SPECFIT/32 [36-39,41] with methodology have been described previously [21,25,26]. 2.2. Determination of the Thermodynamic Protonation/Dissociation Constant Let us consider the dependence of the mixed dissociation constant Ka = aH+ [Lz-1]/[HLz] on an ionic strength, when both ions HLz and Lz-1 have roughly the same ion-size parameter a in the dissociation equilibrium HLz ⇄ Lz-1 + H+ with the thermodynamic dissociation constant T a K = aH+·aL-/aHL. For low values of an ionic strength this de- pendence is expressed by the shortened Debye-Hückel equation T aa (12 z) pp 1 A I KK Ba I (4) Copyright © 2010 SciRes. AJAC 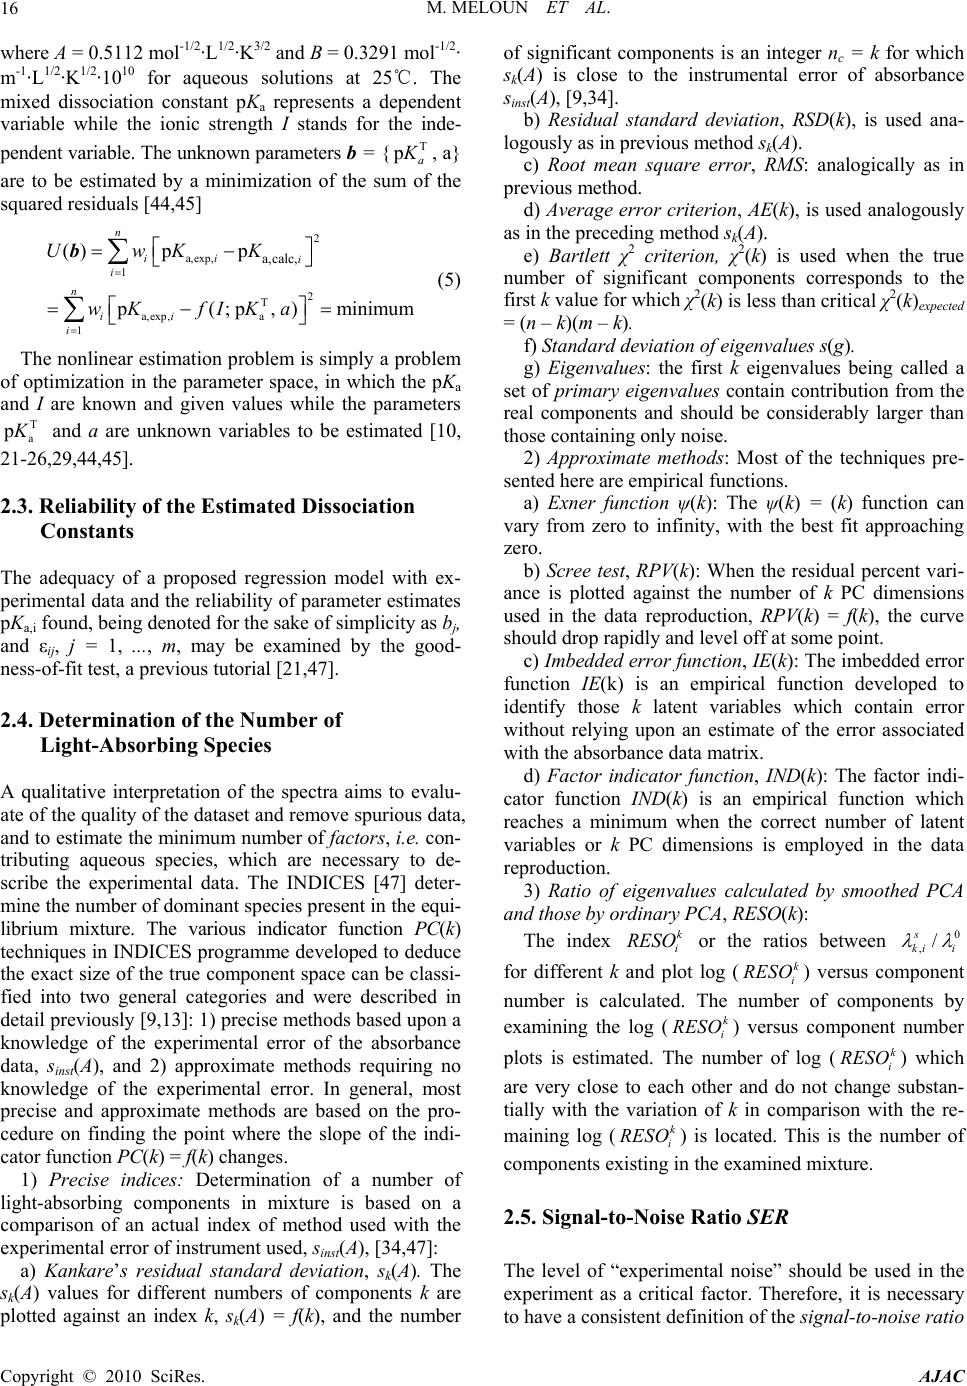 M. MELOUN ET AL. Copyright © 2010 SciRes. AJAC 16 where A = 0.5112 mol-1/2·L1/2·K3/2 and B = 0.3291 mol-1/2· m-1·L1/2·K1/2·1010 for aqueous solutions at 25℃. The mixed dissociation constant pKa represents a dependent variable while the ionic strength I stands for the inde- pendent variable. The unknown parameters b = {T p a K , a} are to be estimated by a minimization of the sum of the squared residuals [44,45] 2 a,exp, 1 2 T a,exp, a 1 a,calc, ()p p p (; p,)minimum n ii i i n ii i UwKK wK fIKa b (5) The nonlinear estimation problem is simply a problem of optimization in the parameter space, in which the pKa and I are known and given values while the parameters T a p K and a are unknown variables to be estimated [10, 21-26,29,44,45]. 2.3. Reliability of the Estimated Dissociation Constants The adequacy of a proposed regression model with ex- perimental data and the reliability of parameter estimates pKa,i found, being denoted for the sake of simplicity as bj, and εij, j = 1, ..., m, may be examined by the good- ness-of-fit test, a previous tutorial [21,47]. 2.4. Determination of the Number of Light-Absorbing Species A qualitative interpretation of the spectra aims to evalu- ate of the quality of the dataset and remove spurious data, and to estimate the minimum number of factors, i.e. con- tributing aqueous species, which are necessary to de- scribe the experimental data. The INDICES [47] deter- mine the number of dominant species present in the equi- librium mixture. The various indicator function PC(k) techniques in INDICES programme developed to deduce the exact size of the true component space can be classi- fied into two general categories and were described in detail previously [9,13]: 1) precise methods based upon a knowledge of the experimental error of the absorbance data, sinst(A), and 2) approximate methods requiring no knowledge of the experimental error. In general, most precise and approximate methods are based on the pro- cedure on finding the point where the slope of the indi- cator function PC(k) = f(k) changes. 1) Precise indices: Determination of a number of light-absorbing components in mixture is based on a comparison of an actual index of method used with the experimental error of instrument used, sinst(A), [34,47]: a) Kank ar e’s residual standard deviation, sk(A). The sk(A) values for different numbers of components k are plotted against an index k, sk(A) = f(k), and the number of significant components is an integer nc = k for which sk(A) is close to the instrumental error of absorbance sinst(A), [9,34]. b) Residual standard deviation, RSD(k), is used ana- logously as in previous method sk(A). c) Root mean square error, RMS : analogically as in previous method. d) Average error criterion, AE(k), is used analogously as in the preceding method sk(A). e) Bartlett χ2 criterion, χ2(k) is used when the true number of significant components corresponds to the first k value for which χ2(k) is less than critical χ2(k)expected = (n – k)(m – k). f) Standard deviation of eigenvalues s(g). g) Eigenvalues: the first k eigenvalues being called a set of primary eigenvalues contain contribution from the real components and should be considerably larger than those containing only noise. 2) Approximate methods: Most of the techniques pre- sented here are empirical functions. a) Exner function ψ(k): The ψ(k) = (k) function can vary from zero to infinity, with the best fit approaching zero. b) Scree test, RPV(k): When the residual percent vari- ance is plotted against the number of k PC dimensions used in the data reproduction, RPV(k) = f(k), the curve should drop rapidly and level off at some point. c) Imbedded error function, IE(k): The imbedded error function IE(k) is an empirical function developed to identify those k latent variables which contain error without relying upon an estimate of the error associated with the absorbance data matrix. d) Factor indicator function, IND(k): The factor indi- cator function IND(k) is an empirical function which reaches a minimum when the correct number of latent variables or k PC dimensions is employed in the data reproduction. 3) Ratio of eigenvalues calculated by smoothed PCA and those by ordinary PCA, RESO(k): The index or the ratios between k i RESO 0 ,/ s ki i k for different k and plot log () versus component number is calculated. The number of components by examining the log () versus component number plots is estimated. The number of log () which are very close to each other and do not change substan- tially with the variation of k in comparison with the re- maining log () is located. This is the number of components existing in the examined mixture. k i RESO k i SORE k i RESO i RESO 2.5. Signal-to-Noise Ratio SER The level of “experimental noise” should be used in the experiment as a critical factor. Therefore, it is necessary to have a consistent definition of the signal-to-noise ratio 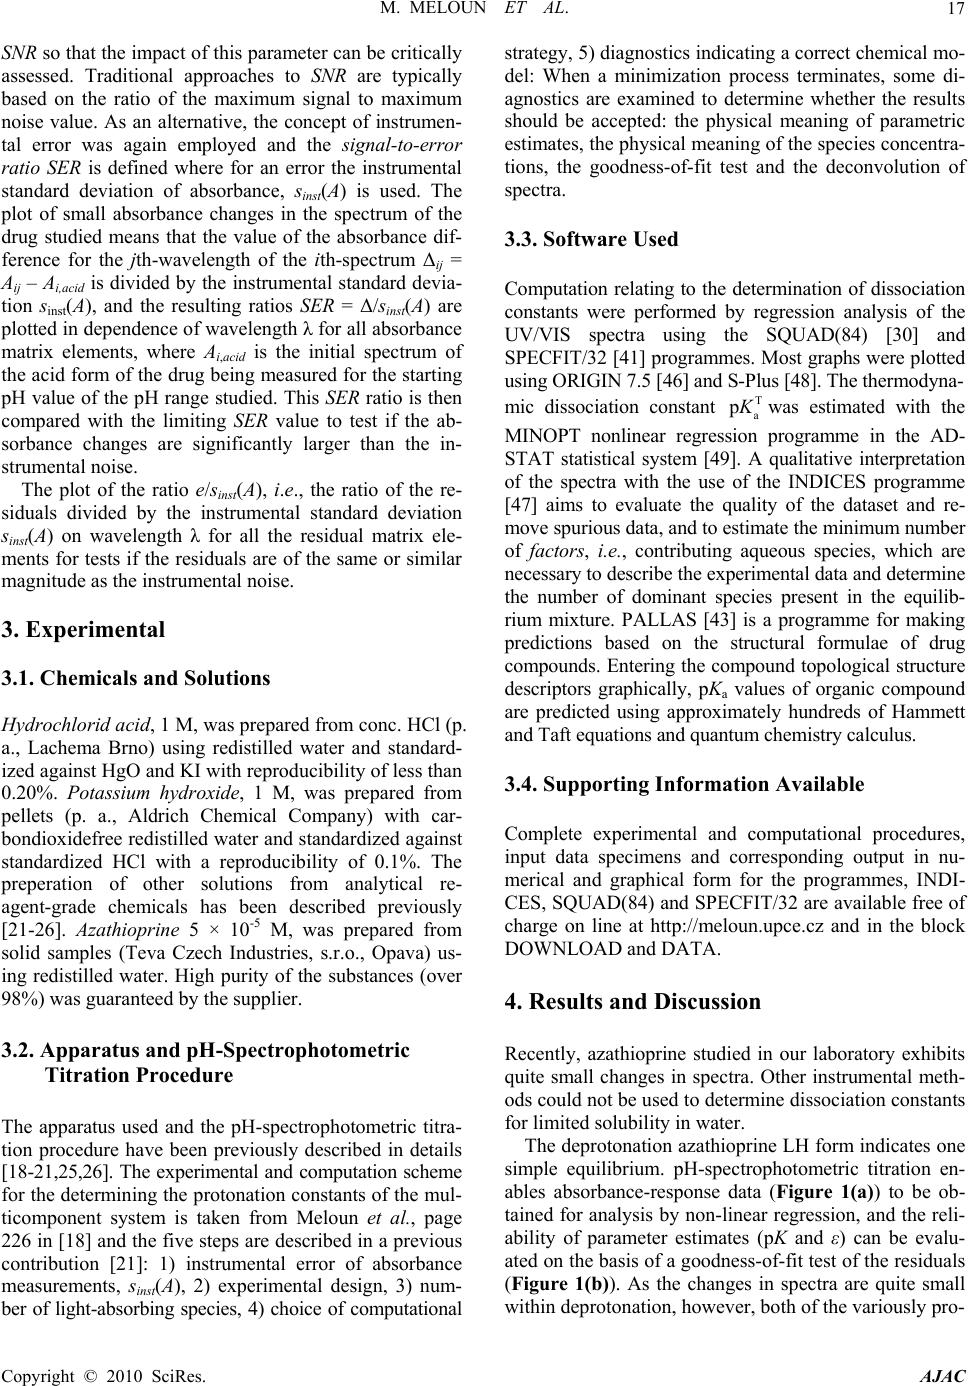 M. MELOUN ET AL. Copyright © 2010 SciRes. AJAC 17 SNR so that the impact of this parameter can be critically assessed. Traditional approaches to SNR are typically based on the ratio of the maximum signal to maximum noise value. As an alternative, the concept of instrumen- tal error was again employed and the signal-to-error ratio SER is defined where for an error the instrumental standard deviation of absorbance, sinst(A) is used. The plot of small absorbance changes in the spectrum of the drug studied means that the value of the absorbance dif- ference for the jth-wavelength of the ith-spectrum Δij = Aij – Ai,acid is divided by the instrumental standard devia- tion sinst(A), and the resulting ratios SER = Δ/sinst(A) are plotted in dependence of wavelength λ for all absorbance matrix elements, where Ai,acid is the initial spectrum of the acid form of the drug being measured for the starting pH value of the pH range studied. This SER ratio is then compared with the limiting SER value to test if the ab- sorbance changes are significantly larger than the in- strumental noise. The plot of the ratio e/sinst(A), i.e., the ratio of the re- siduals divided by the instrumental standard deviation sinst(A) on wavelength λ for all the residual matrix ele- ments for tests if the residuals are of the same or similar magnitude as the instrumental noise. 3. Experimental 3.1. Chemicals and Solutions Hydrochlorid acid, 1 M, was prepared from conc. HCl (p. a., Lachema Brno) using redistilled water and standard- ized against HgO and KI with reproducibility of less than 0.20%. Potassium hydroxide, 1 M, was prepared from pellets (p. a., Aldrich Chemical Company) with car- bondioxidefree redistilled water and standardized against standardized HCl with a reproducibility of 0.1%. The preperation of other solutions from analytical re- agent-grade chemicals has been described previously [21-26]. Azathioprine 5 × 10⁻⁵ M, was prepared from solid samples (Teva Czech Industries, s.r.o., Opava) us- ing redistilled water. High purity of the substances (over 98%) was guaranteed by the supplier. 3.2. Apparatus and pH-Spectrophotometric Titration Procedure The apparatus used and the pH-spectrophotometric titra- tion procedure have been previously described in details [18-21,25,26]. The experimental and computation scheme for the determining the protonation constants of the mul- ticomponent system is taken from Meloun et al., page 226 in [18] and the five steps are described in a previous contribution [21]: 1) instrumental error of absorbance measurements, sinst(A), 2) experimental design, 3) num- ber of light-absorbing species, 4) choice of computational strategy, 5) diagnostics indicating a correct chemical mo- del: When a minimization process terminates, some di- agnostics are examined to determine whether the results should be accepted: the physical meaning of parametric estimates, the physical meaning of the species concentra- tions, the goodness-of-fit test and the deconvolution of spectra. 3.3. Software Used Computation relating to the determination of dissociation constants were performed by regression analysis of the UV/VIS spectra using the SQUAD(84) [30] and SPECFIT/32 [41] programmes. Most graphs were plotted using ORIGIN 7.5 [46] and S-Plus [48]. The thermodyna- mic dissociation constant T a p K was estimated with the MINOPT nonlinear regression programme in the AD- STAT statistical system [49]. A qualitative interpretation of the spectra with the use of the INDICES programme [47] aims to evaluate the quality of the dataset and re- move spurious data, and to estimate the minimum number of factors, i.e., contributing aqueous species, which are necessary to describe the experimental data and determine the number of dominant species present in the equilib- rium mixture. PALLAS [43] is a programme for making predictions based on the structural formulae of drug compounds. Entering the compound topological structure descriptors graphically, pKa values of organic compound are predicted using approximately hundreds of Hammett and Taft equations and quantum chemistry calculus. 3.4. Supporting Information Available Complete experimental and computational procedures, input data specimens and corresponding output in nu- merical and graphical form for the programmes, INDI- CES, SQUAD(84) and SPECFIT/32 are available free of charge on line at http://meloun.upce.cz and in the block DOWNLOAD and DATA. 4. Results and Discussion Recently, azathioprine studied in our laboratory exhibits quite small changes in spectra. Other instrumental meth- ods could not be used to determine dissociation constants for limited solubility in water. The deprotonation azathioprine LH form indicates one simple equilibrium. pH-spectrophotometric titration en- ables absorbance-response data (Figure 1(a)) to be ob- tained for analysis by non-linear regression, and the reli- ability of parameter estimates (pK and ε) can be evalu- ated on the basis of a goodness-of-fit test of the residuals (Figure 1(b)). As the changes in spectra are quite small within deprotonation, however, both of the variously pro- 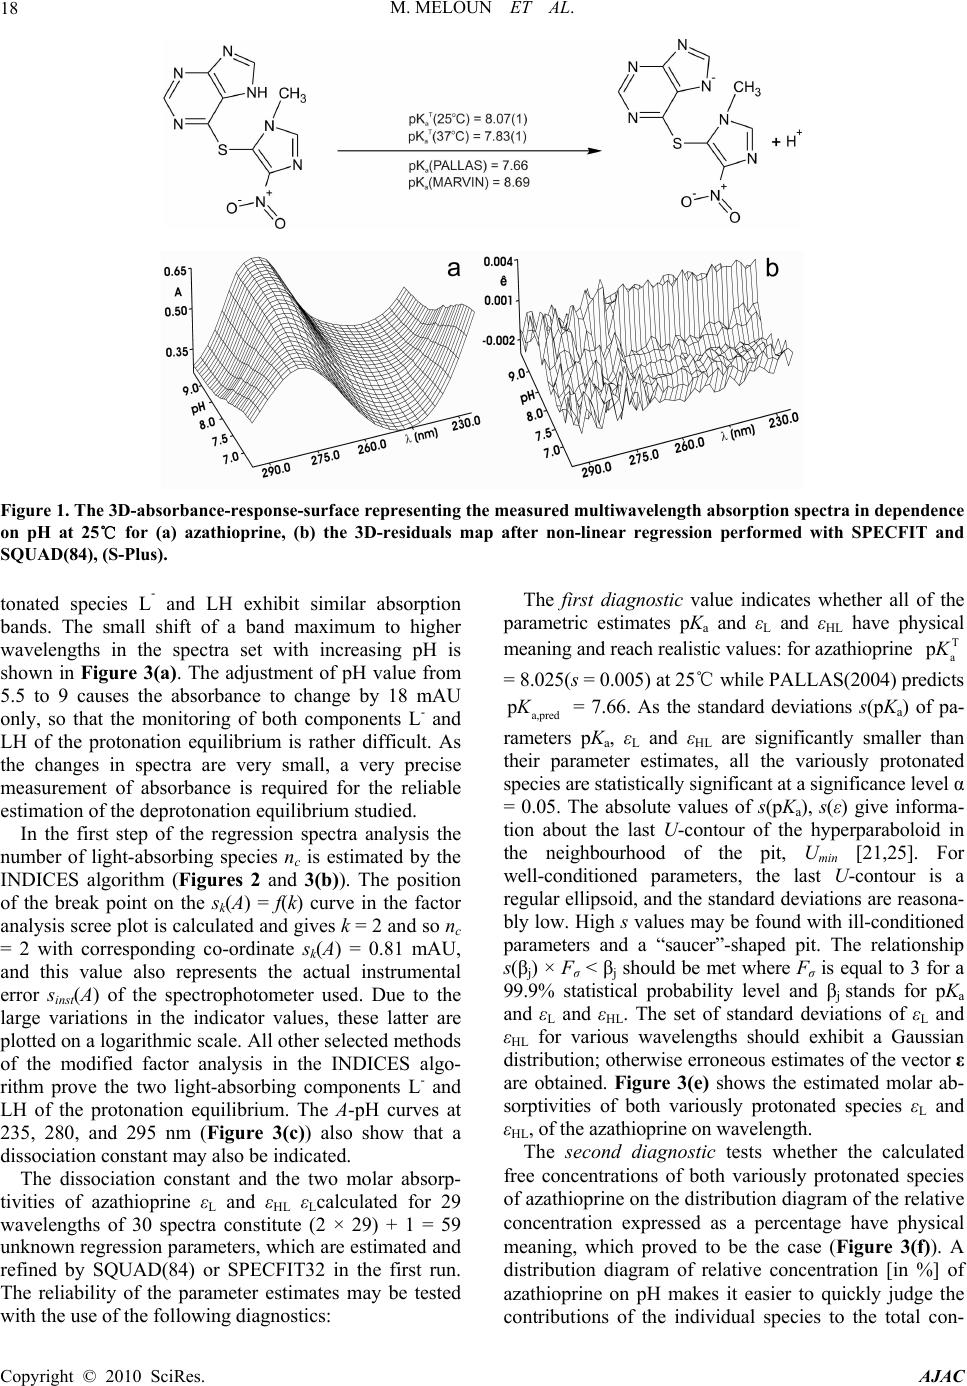 M. MELOUN ET AL. 18 Figure 1. The 3D-absorbance-response-surface representing the measured multiwavelength absorption spectra in dependence on pH at 25℃ for (a) azathioprine, (b) the 3D-residuals map after non-linear regression performed with SPECFIT and SQUAD(84), (S-Plus). tonated species L- and LH exhibit similar absorption bands. The small shift of a band maximum to higher wavelengths in the spectra set with increasing pH is shown in Figure 3(a). The adjustment of pH value from 5.5 to 9 causes the absorbance to change by 18 mAU only, so that the monitoring of both components L- and LH of the protonation equilibrium is rather difficult. As the changes in spectra are very small, a very precise measurement of absorbance is required for the reliable estimation of the deprotonation equilibrium studied. In the first step of the regression spectra analysis the number of light-absorbing species nc is estimated by the INDICES algorithm (Figures 2 and 3(b)). The position of the break point on the sk(A) = f(k) curve in the factor analysis scree plot is calculated and gives k = 2 and so nc = 2 with corresponding co-ordinate sk(A) = 0.81 mAU, and this value also represents the actual instrumental error sinst(A) of the spectrophotometer used. Due to the large variations in the indicator values, these latter are plotted on a logarithmic scale. All other selected methods of the modified factor analysis in the INDICES algo- rithm prove the two light-absorbing components L- and LH of the protonation equilibrium. The A-pH curves at 235, 280, and 295 nm (Figure 3(c)) also show that a dissociation constant may also be indicated. The dissociation constant and the two molar absorp- tivities of azathioprine εL and εHL εLcalculated for 29 wavelengths of 30 spectra constitute (2 × 29) + 1 = 59 unknown regression parameters, which are estimated and refined by SQUAD(84) or SPECFIT32 in the first run. The reliability of the parameter estimates may be tested with the use of the following diagnostics: The first diagnostic value indicates whether all of the parametric estimates pKa and εL and εHL have physical meaning and reach realistic values: for azathioprine T a p K = 8.025(s = 0.005) at 25℃ while PALLAS(2004) predicts = 7.66. As the standard deviations s(pKa) of pa- rameters pKa, εL and εHL are significantly smaller than their parameter estimates, all the variously protonated species are statistically significant at a significance level α = 0.05. The absolute values of s(pKa), s(ε) give informa- tion about the last U-contour of the hyperparaboloid in the neighbourhood of the pit, Umin [21,25]. For well-conditioned parameters, the last U-contour is a regular ellipsoid, and the standard deviations are reasona- bly low. High s values may be found with ill-conditioned parameters and a “saucer”-shaped pit. The relationship s(βj) × Fσ < βj should be met where Fσ is equal to 3 for a 99.9% statistical probability level and βj stands for pKa and εL and εHL. The set of standard deviations of εL and εHL for various wavelengths should exhibit a Gaussian distribution; otherwise erroneous estimates of the vector ε are obtained. Figure 3(e) shows the estimated molar ab- sorptivities of both variously protonated species εL and εHL, of the azathioprine on wavelength. a,pred pK The second diagnostic tests whether the calculated free concentrations of both variously protonated species of azathioprine on the distribution diagram of the relative concentration expressed as a percentage have physical meaning, which proved to be the case (Figure 3(f)). A distribution diagram of relative concentration [in %] of azathioprine on pH makes it easier to quickly judge the contributions of the individual species to the total con- Copyright © 2010 SciRes. AJAC 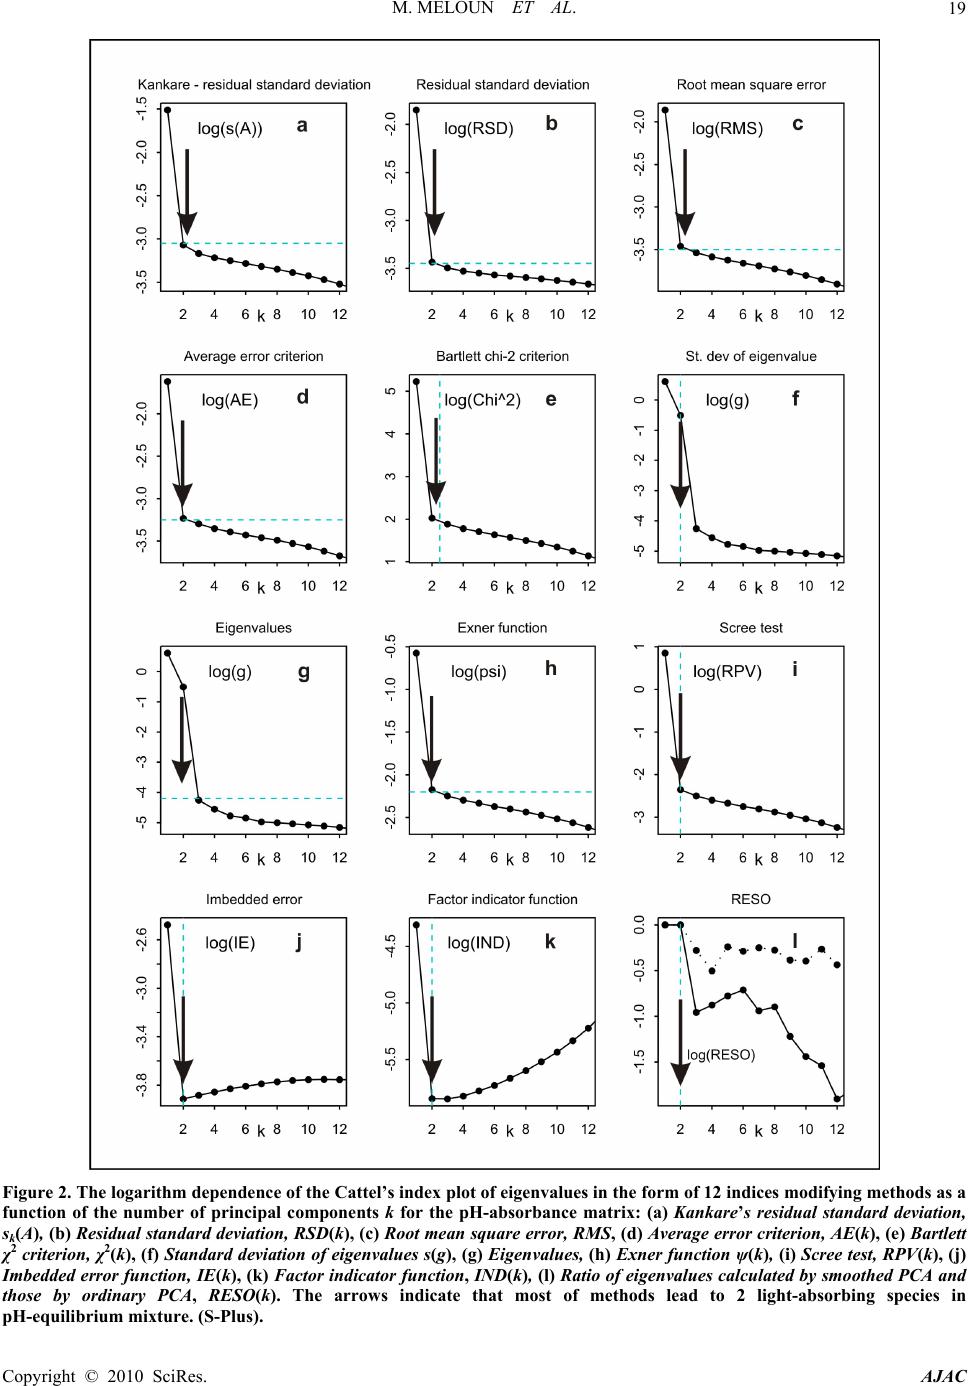 M. MELOUN ET AL.19 Figure 2. The logarithm dependence of the Cattel’s index plot of eigenvalues in the form of 12 indices modifying methods as a function of the number of principal components k for the pH-absorbance matrix: (a) Kankare’s residual standard deviation, sk(A), (b) Residual standard deviation, RSD(k), (c) Root mean square error, RMS, (d) Average error criterion, AE(k), (e) Bartlett χ2 criterion, χ2(k), (f) Standard deviation of eigenvalues s(g), (g) Eigenvalues, (h) Exner function ψ(k), (i) Scree test, RPV(k), (j) Imbedded error function, IE(k), (k) Factor indicator function, IND(k), (l) Ratio of eigenvalues calculated by smoothed PCA and those by ordinary PCA, RESO(k). The arrows indicate that most of methods lead to 2 light-absorbing species in pH-equilibrium mixture. (S-Plus). Copyright © 2010 SciRes. AJAC 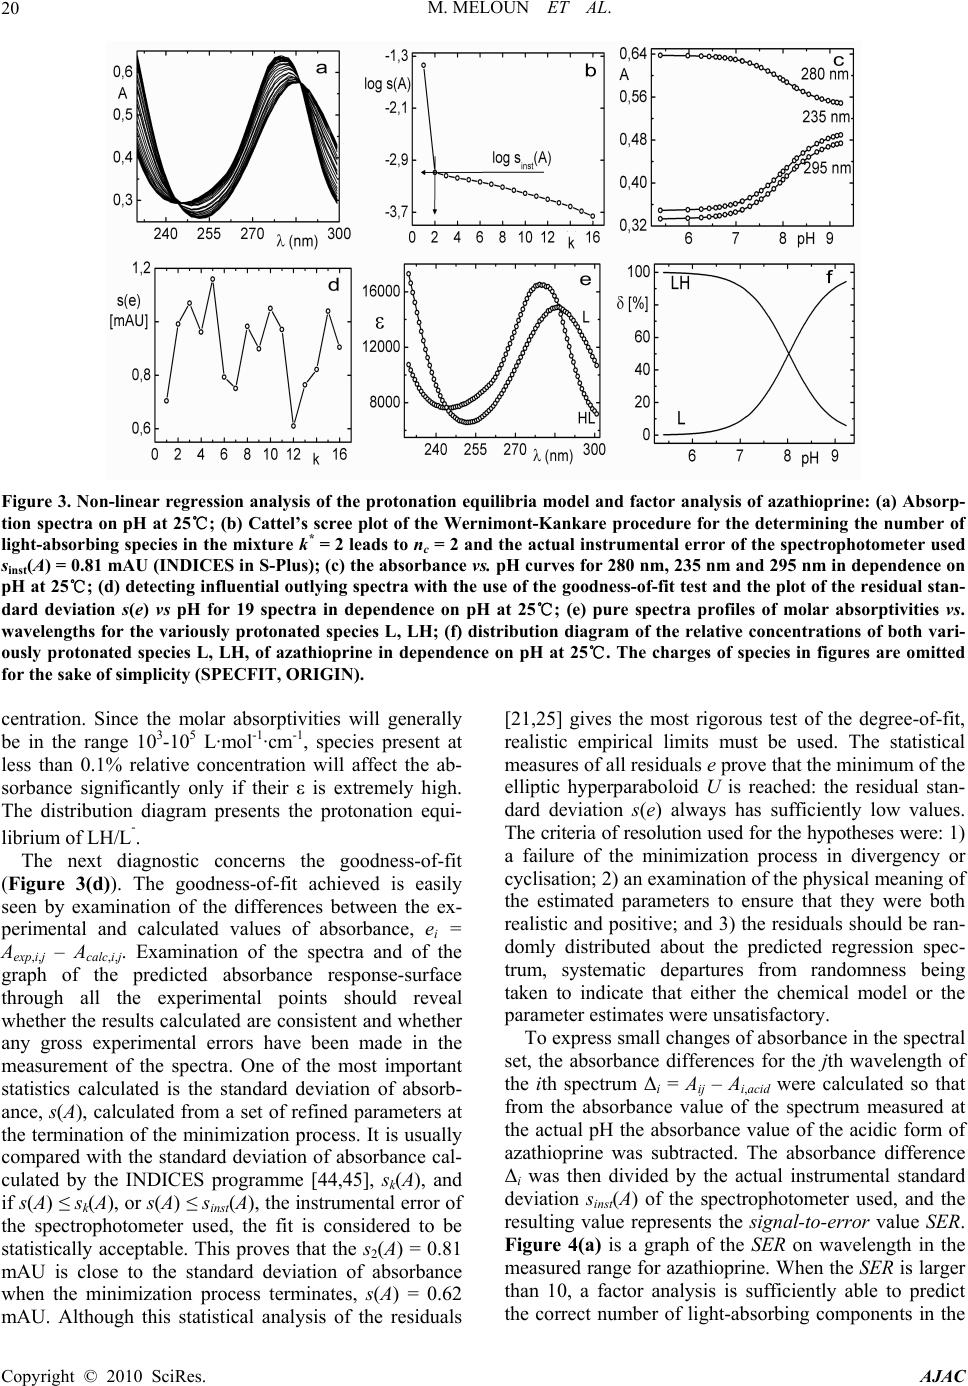 M. MELOUN ET AL. Copyright © 2010 SciRes. AJAC 20 Figure 3. Non-linear regression analysis of the protonation equilibria model and factor analysis of azathioprine: (a) Absorp- tion spectra on pH at 25℃; (b) Cattel’s scree plot of the Wernimont-Kankare procedure for the determining the number of light-absorbing species in the mixture k* = 2 leads to nc = 2 and the actual instrumental error of the spectrophotometer used sinst(A) = 0.81 mAU (INDICES in S-Plus); (c) the absorbance vs. pH curves for 280 nm, 235 nm and 295 nm in dependence on pH at 25℃; (d) detecting influential outlying spectra with the use of the goodness-of-fit test and the plot of the residual stan- dard deviation s(e) vs pH for 19 spectra in dependence on pH at 25℃; (e) pure spectra profiles of molar absorptivities vs. wavelengths for the variously protonated species L, LH; (f) distribution diagram of the relative concentrations of both vari- ously protonated species L, LH, of azathioprine in dependence on pH at 25℃. The charges of species in figures are omitted for the sake of simplicity (SPECFIT, ORIGIN). centration. Since the molar absorptivities will generally be in the range 103-105 L·mol-1·cm-1, species present at less than 0.1% relative concentration will affect the ab- sorbance significantly only if their ε is extremely high. The distribution diagram presents the protonation equi- librium of LH/L-. The next diagnostic concerns the goodness-of-fit (Figure 3(d)). The goodness-of-fit achieved is easily seen by examination of the differences between the ex- perimental and calculated values of absorbance, ei = Aexp,i,j – Acalc,i,j. Examination of the spectra and of the graph of the predicted absorbance response-surface through all the experimental points should reveal whether the results calculated are consistent and whether any gross experimental errors have been made in the measurement of the spectra. One of the most important statistics calculated is the standard deviation of absorb- ance, s(A), calculated from a set of refined parameters at the termination of the minimization process. It is usually compared with the standard deviation of absorbance cal- culated by the INDICES programme [44,45], sk(A), and if s(A) ≤ sk(A), or s(A) ≤ sinst(A), the instrumental error of the spectrophotometer used, the fit is considered to be statistically acceptable. This proves that the s2(A) = 0.81 mAU is close to the standard deviation of absorbance when the minimization process terminates, s(A) = 0.62 mAU. Although this statistical analysis of the residuals [21,25] gives the most rigorous test of the degree-of-fit, realistic empirical limits must be used. The statistical measures of all residuals e prove that the minimum of the elliptic hyperparaboloid U is reached: the residual stan- dard deviation s(e) always has sufficiently low values. The criteria of resolution used for the hypotheses were: 1) a failure of the minimization process in divergency or cyclisation; 2) an examination of the physical meaning of the estimated parameters to ensure that they were both realistic and positive; and 3) the residuals should be ran- domly distributed about the predicted regression spec- trum, systematic departures from randomness being taken to indicate that either the chemical model or the parameter estimates were unsatisfactory. To express small changes of absorbance in the spectral set, the absorbance differences for the jth wavelength of the ith spectrum Δi = Aij – Ai,acid were calculated so that from the absorbance value of the spectrum measured at the actual pH the absorbance value of the acidic form of azathioprine was subtracted. The absorbance difference Δi was then divided by the actual instrumental standard deviation sinst(A) of the spectrophotometer used, and the resulting value represents the signal-to-error value SER. Figure 4(a) is a graph of the SER on wavelength in the measured range for azathioprine. When the SER is larger than 10, a factor analysis is sufficiently able to predict the correct number of light-absorbing components in the 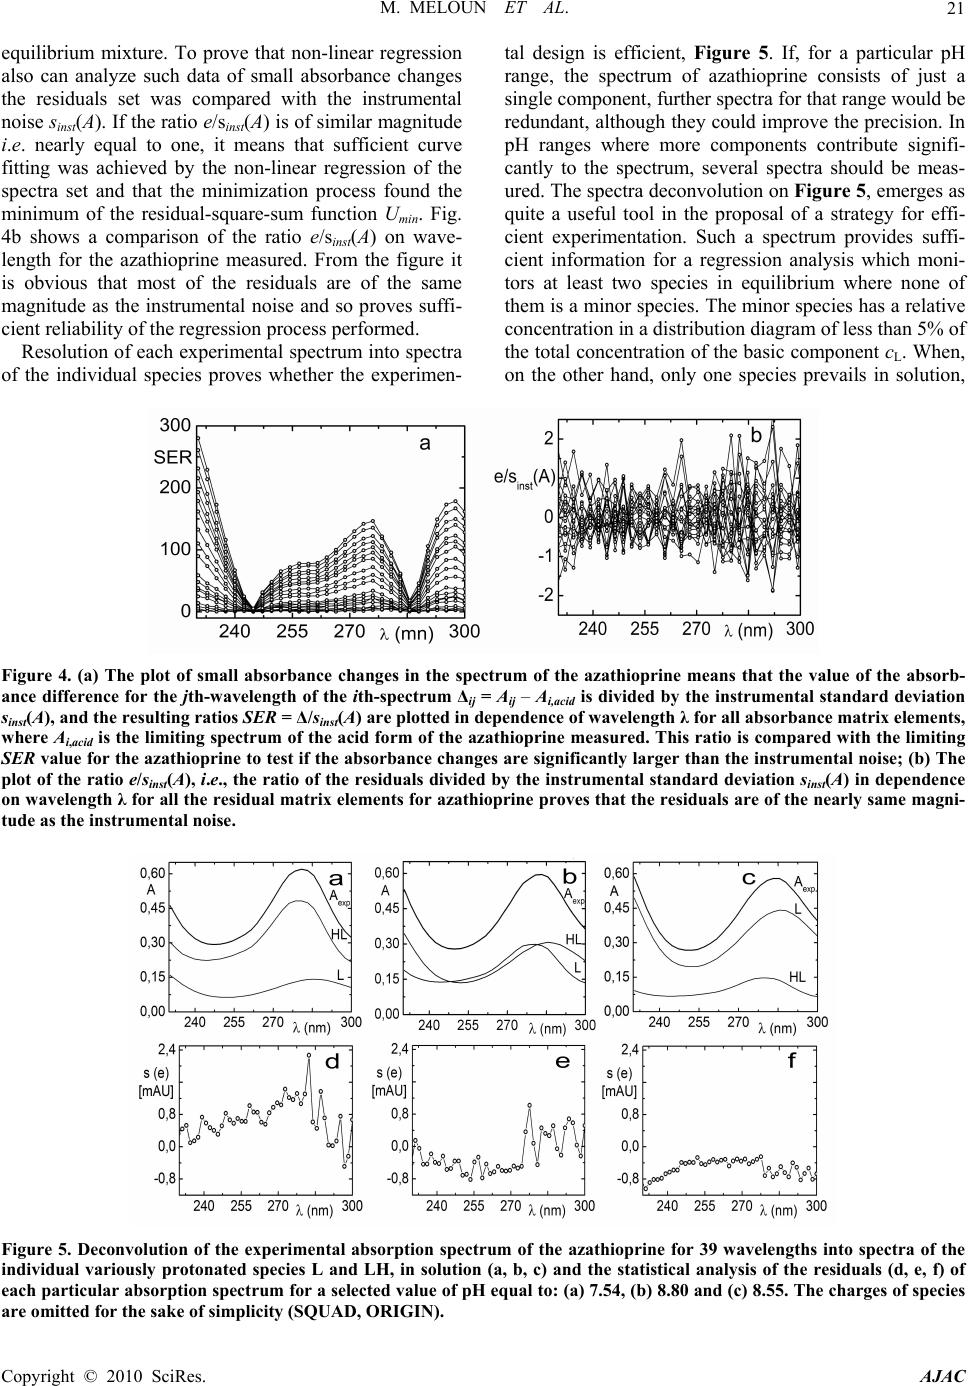 M. MELOUN ET AL.21 equilibrium mixture. To prove that non-linear regression also can analyze such data of small absorbance changes the residuals set was compared with the instrumental noise sinst(A). If the ratio e/sinst(A) is of similar magnitude i.e. nearly equal to one, it means that sufficient curve fitting was achieved by the non-linear regression of the spectra set and that the minimization process found the minimum of the residual-square-sum function Umin. Fig. 4b shows a comparison of the ratio e/sinst(A) on wave- length for the azathioprine measured. From the figure it is obvious that most of the residuals are of the same magnitude as the instrumental noise and so proves suffi- cient reliability of the regression process performed. Resolution of each experimental spectrum into spectra of the individual species proves whether the experimen- tal design is efficient, Figure 5. If, for a particular pH range, the spectrum of azathioprine consists of just a single component, further spectra for that range would be redundant, although they could improve the precision. In pH ranges where more components contribute signifi- cantly to the spectrum, several spectra should be meas- ured. The spectra deconvolution on Figure 5, emerges as quite a useful tool in the proposal of a strategy for effi- cient experimentation. Such a spectrum provides suffi- cient information for a regression analysis which moni- tors at least two species in equilibrium where none of them is a minor species. The minor species has a relative concentration in a distribution diagram of less than 5% of the total concentration of the basic component cL. When, on the other hand, only one species prevails in solution, Figure 4. (a) The plot of small absorbance changes in the spectrum of the azathioprine means that the value of the absorb- ance difference for the jth-wavelength of the ith-spectrum Δij = Aij – Ai,acid is divided by the instrumental standard deviation sinst(A), and the resulting ratios SER = Δ/sinst(A) are plotted in dependence of wavelength λ for all absorbance matrix elements, where Ai,acid is the limiting spectrum of the acid form of the azathioprine measured. This ratio is compared with the limiting SER value for the azathioprine to test if the absorbance changes are significantly larger than the instrumental noise; (b) The plot of the ratio e/sinst(A), i.e., the ratio of the residuals divided by the instrumental standard deviation sinst(A) in dependence on wavelength λ for all the residual matrix elements for azathioprine proves that the residuals are of the nearly same magni- tude as the instrumental noise. Figure 5. Deconvolution of the experimental absorption spectrum of the azathioprine for 39 wavelengths into spectra of the individual variously protonated species L and LH, in solution (a, b, c) and the statistical analysis of the residuals (d, e, f) of each particular absorption spectrum for a selected value of pH equal to: (a) 7.54, (b) 8.80 and (c) 8.55. The charges of species are omitted for the sake of simplicity (SQUAD, ORIGIN). Copyright © 2010 SciRes. AJAC 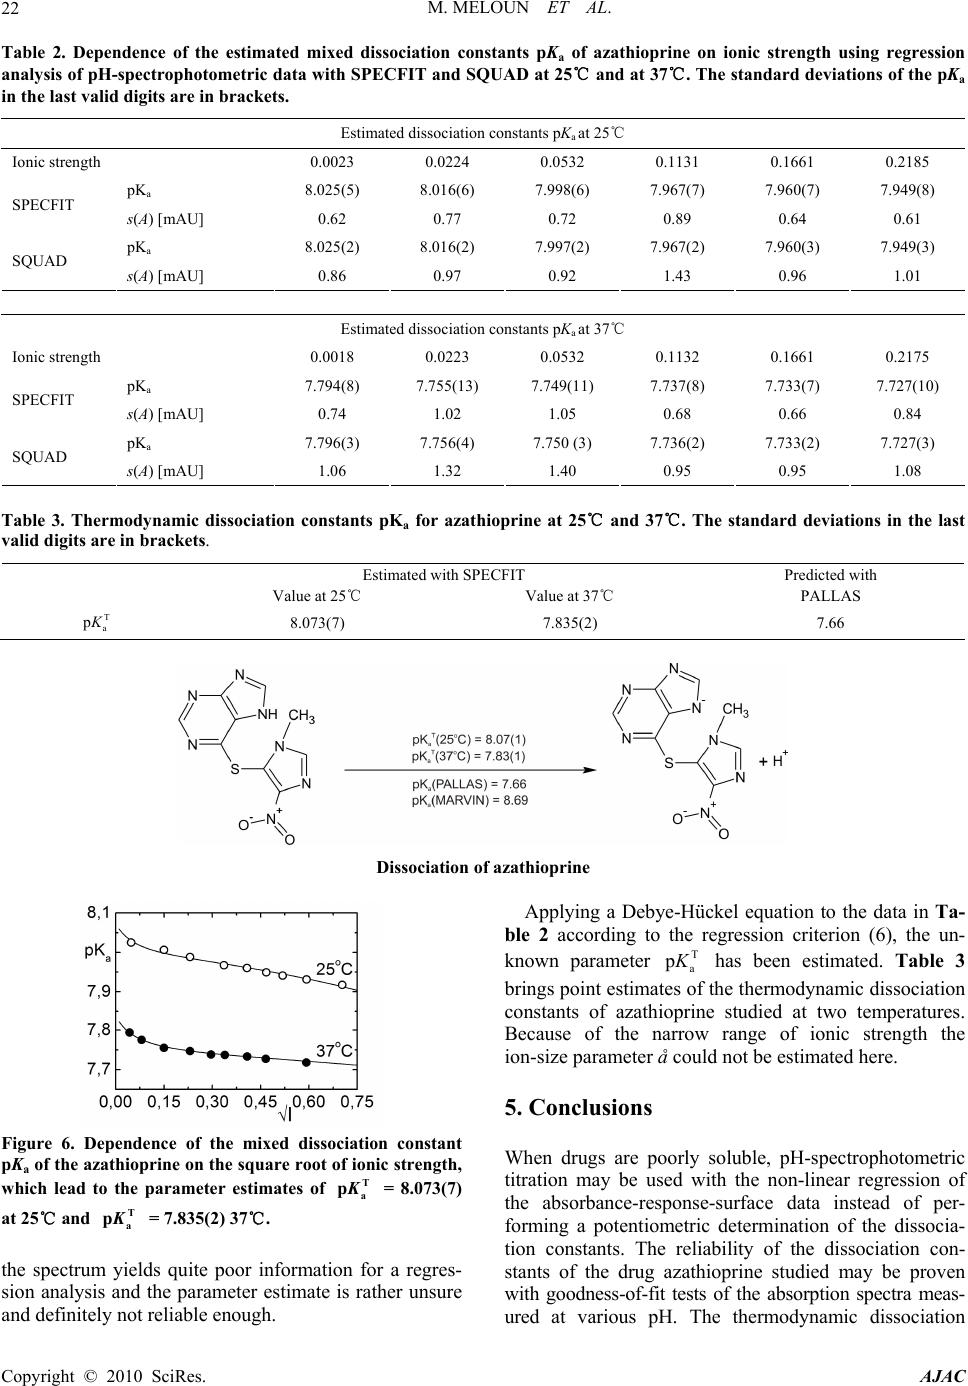 M. MELOUN ET AL. Copyright © 2010 SciRes. AJAC 22 Table 2. Dependence of the estimated mixed dissociation constants pKa of azathioprine on ionic strength using regression analysis of pH-spectrophotometric data with SPECFIT and SQUAD at 25℃ and at 37℃. The standard deviations of the pKa in the last valid digits are in brackets. Estimated dissociation constants pKa at 25℃ Ionic strength 0.0023 0.0224 0.0532 0.1131 0.1661 0.2185 pKa 8.025(5) 8.016(6) 7.998(6) 7.967(7) 7.960(7) 7.949(8) SPECFIT s(A) [mAU] 0.62 0.77 0.72 0.89 0.64 0.61 pKa 8.025(2) 8.016(2) 7.997(2) 7.967(2) 7.960(3) 7.949(3) SQUAD s(A) [mAU] 0.86 0.97 0.92 1.43 0.96 1.01 Estimated dissociation constants pKa at 37℃ Ionic strength 0.0018 0.0223 0.0532 0.1132 0.1661 0.2175 pKa 7.794(8) 7.755(13) 7.749(11) 7.737(8) 7.733(7) 7.727(10) SPECFIT s(A) [mAU] 0.74 1.02 1.05 0.68 0.66 0.84 pKa 7.796(3) 7.756(4) 7.750 (3) 7.736(2) 7.733(2) 7.727(3) SQUAD s(A) [mAU] 1.06 1.32 1.40 0.95 0.95 1.08 Table 3. Thermodynamic dissociation constants pKa for azathioprine at 25℃ and 37℃. The standard deviations in the last valid digits are in brackets. Estimated with SPECFIT Predicted with Value at 25℃ Value at 37℃ PALLAS T a p K 8.073(7) 7.835(2) 7.66 Dissociation of azathioprine Figure 6. Dependence of the mixed dissociation constant pKa of the azathioprine on the square root of ionic strength, which lead to the parameter estimates of = 8.073(7) at 25℃ and = 7.835(2) 37℃. T a pK T a pK the spectrum yields quite poor information for a regres- sion analysis and the parameter estimate is rather unsure and definitely not reliable enough. Applying a Debye-Hückel equation to the data in Ta- ble 2 according to the regression criterion (6), the un- known parameter T a p K has been estimated. Table 3 brings point estimates of the thermodynamic dissociation constants of azathioprine studied at two temperatures. Because of the narrow range of ionic strength the ion-size parameter å could not be estimated here. 5. Conclusions When drugs are poorly soluble, pH-spectrophotometric titration may be used with the non-linear regression of the absorbance-response-surface data instead of per- forming a potentiometric determination of the dissocia- tion constants. The reliability of the dissociation con- stants of the drug azathioprine studied may be proven with goodness-of-fit tests of the absorption spectra meas- ured at various pH. The thermodynamic dissociation  M. MELOUN ET AL.23 constant T a p K for azathioprine was estimated by non-linear regression of {pKa, I} data at 25℃ T a p K = 8.073(6) at 37℃ T a p K = 7.835(2) where in brackets is the standard deviation is in the last significant digits. Goodness-of-fit tests for the various regression diag- nostics enabled the reliability of the parameter estimates to be determined. Most indices always predict the correct number of components when the signal-to-error ratio SER is higher than 10. The Wernimont-Kankare proce- dure in INDICES performs a reliable determination of the instrumental standard deviation of spectrophotometer used sinst(A), correctly predicts the number of light-absorbing components present nc and can also solve an ill-defined problem with severe collinearity in the spectra or very small changes in spectra. 6. Acknowledgments The financial support of the Grant Agency IGA MZ ČR (Grant No NS9831-4/2008) and of the Czech Ministry of Education (Grant No MSM0021627502) is gratefully acknowledged. 7. References [1] “Azathioprine,” Encyclopedia Britannica, 2009. http://www. britannica.com/EBchecked/topic/46740/azathioprine [2] G. E. Cheney, H. Freiser and Q. Fernando, “Metal Com- plexes of Purine and some of its Derivatives,” Journal of the American Chemical Society, Vol. 81, No. 11, 1959, pp. 2611-2615. [3] D. E. Duggan and E. Titus, “6-Chloropurine and 6- Chlorouric Acid as Substrates and Inhibitors of Purine- Oxidizing Enzymes,” Journal of Biological Chemistry, Vol. 234, No. 8, 1959, pp. 2100-2104. [4] J. D. Davidson, “Studies on the Mechanism of Action of 6-Mercaptopurine in Sensitive and Resistant L1210 Leu- kemia in Vitro,” Cancer Research, Vol. 20, No. 2, 1960, pp. 225-232. [5] U. Kela and R. Vijayvargiya, “Studies on the Mechanism of Action of 6-Mercaptopurine,” Biochemistry Journal, Vol. 193, No. 3, 1981, pp. 799-803. [6] E. Mavioglu, S. Arzik and A. S. Celebi: Potentric Deter- mination of the Stability Constants of Ni(II), Co(II), Cu(II) and Zn(II) Complexes of Hypoxanthine at Physio- logical Conditions. JFS 27 (2004), 1-19 [7] M. J. Robins and G. L. Basom, “Nucleic Acid Related Compounds. 8. Direct Conversion of 2’-Deoxyinosine to 6-Chloropurine 2’-Deoxyriboside and Selected 6-Substitued Deoxynucleosides and their Evaluation as Substrates of Adenosine Deaminase,” Canadian Journal of Chemistry, Vol. 51, No. 19, 1973, pp. 3161-3169 [8] O. Bibi, J. Schwartz, Y. Eilam, E. Shohami and Z. I. Ca- bantchik, “Nucleoside Transport in Mammalian Cell. IV. Organomercurials and Organomercurial-Mercaptonucleo- side Complexes as Probes for Nucleoside Transport Sys- tems in Hamster Cells,” Journal of Membrane Biology, Vol. 39, No. 2-3, 1978, pp. 159-183 [9] M. Meloun, J. Čapek, P. Mikšík and R. G. Brereton, “Critical of Methods Predicting the Number of Compo- nents in Spectroscopic Data,” Analytica Chimica Acta, Vol. 423, No. 1, 2000, pp. 51-68. [10] M. Meloun and M. Pluhařová, “Thermodynamic Disso- ciation Constants of Codeine, Ethylmorphine and Homatropine by Regression Analysis of Potentiometric Titration Data, Analytica Chimica Acta, Vol. 416, No. 1, 2000 pp. 55-68. [11] M. Meloun and P. Černohorský, “Thermodynamic Disso- ciation Constants of Isocaine, Physostigmine and Pilo- carpine by Regression Analysis of Potentiometric Data,” Talanta, Vol. 52, No. 5, 2000, pp. 931-945. [12] M. Meloun, D. Burkoňová, T. Syrový and A. Vrána: The Thermodynamic Dissociation Constants of Silychristin, Silybin, Silydianin and Mycophenolate by the Regression Analysis of Spectrophotometric Data, Analytica Chimica Acta, Vol. 486, No. 1, 2003, pp. 125-141. [13] M. Meloun, T. Syrový and A. Vrána, “Determination of the Number of Light-Absorbing Species in the Protona- tion Equilibria of Selected Drugs,” Analytica Chimica Acta, Vol. 489, No. 2, 2003, pp. 137-151. [14] M. Meloun, T. Syrový and A. Vrána, “The Thermody- namic Dissociation Constants of Ambroxol, Antazoline, Naphazoline, Oxymetazoline and Ranitidine by the Re- gression Analysis of Spectrophotometric Data,” Talanta, Vol. 62, No. 3, 2004, pp. 511-522. [15] M. Meloun, T. Syrový and A. Vrána, “The Thermody- namic Dissociation Constants of Losartan, Paracetamol, Phenylephrine and Quinine by the Regression Analysis of Spectrophotometric Data,” Analytica Chimica Acta, Vol. 533, No. 1, 2005, pp. 97-110. [16] M. Meloun, T. Syrový and A. Vrána, “The Thermody- namic Dissociation Constants of Haemanthamine, Lisuride, Metergoline and Nicergoline by the Regression Analysis of Spectrophotometric Data, Analytica Chimica Acta, Vol. 543, No. 1-2, 2005, pp. 254-266. [17] M. Meloun, M. Javůrek and J. Militký, “Computer Esti- mation of Dissociation Constants. Part V: Regression Analysis of Extended Debye-Hückel Law,” Micro- chimica Acta, Vol. 109, No. 2-3, 1992, pp. 221-231. [18] M. Meloun, J. Havel and E. Högfeldt, “Computation of Solution Equilibria,” Ellis Horwood, Chichester, 1988. [19] M. Meloun and J. Havel, “Computation of Solution equi- libria, Part 1: Spectrophotometry,” Folia Facultatis Sci- entarum Naturalium Universitatis Purkynianae, Brno 1984. [20] M. Meloun and J. Havel, “Computation of Solution equi- libria, Part 2: Potentiometry,” Folia Facultatis Scientarum Naturalium Universitatis Purkynianae, Brno 1985. [21] M. Meloun, S. Bordovská, T. Syrový and A. Vrána, “Tu- torial on Chemical Model Building and Testing to Spec- troscopic Data with Least-Squares Regression,” Analytica Chimica Acta, Vol. 580, No. 1, 2006, pp. 107-121. [22] M. Meloun, S. Bordovská and T. Syrový, “A Novel Copyright © 2010 SciRes. AJAC  M. MELOUN ET AL. Copyright © 2010 SciRes. AJAC 24 Computational Strategy for the pKa Estimation of Drugs by Nonlinear Regression of Multiwavelength Spectro- photometric pH-Titration Data Exhibiting Small Changes,” Journal of Physical Organic Chemistry, Vol. 20, 2007, pp. 690-701. [23] M. Meloun, S. Bordovská and L. Galla, “The Thermody- namic Dissociation Constants of Four Non-Steroidal Anti-Inflammatory Drugs by the Least-Squares Nonlinear Regression of Multiwavelength Spectrophotometric pH- Titration Data,” Journal of the Pharmaceutical and Bio- medical Analysis, Vol. 45, No. 4, 2007, pp. 552-564. [24] M. Meloun, S. Bordovská, Benchmarking and Validating Algorithms that Estimate pKa Values of Drugs Based on their Molecular Structures,” Analytical and Bioanalytical Chemistry, Vol. 389, No. 4, 2007, pp. 1267-1281. [25] M. Meloun, S. Bordovská and A. Vrána, “The Thermo- dynamic Dissociation Constants of the Anticancer Drugs Camptothecine, 7-Ethyl-10-Hydroxycamptothecine, 10- Hydroxycamptothecine, and 7-Ethylcamptothecine by the Least-Squares Nonlinear Regression of Multiwavelength Spectrophotometric pH-Titration Data, Analytica Chimica Acta, Vol. 584, No. 2, 2007, pp. 419-432. [26] M. Meloun, T. Syrový, S. Bordovská and A. Vrána, Re- liability and Uncertainty in the Estimation of pKa by the Least Squares Nonlinear Regression Analysis of Multi- wavelength Spectrophotometric pH Titration Data,” Ana- lytical and Bioanalytical Chemistry, Vol. 387, No. 3, 2007, pp. 941-955. [27] L. G. Sillén and B. Warnqvist, “Equilibrium Constants and Model Testing from Spectrophotometric Data, Using LETAGROP,” Acta Chemica Scandinavia, Vol. 22, 1968, pp. 3032-3034. [28] D. J. Leggett, “Computational Methods for the Determi- nation of Formation Constants,” In: D. J. Leggett, Ed., Plenum Press, New York, 1985. [29] J. Havel and M. Meloun, “Computational Methods for the Determination of Formation Constants,” In: D. J. Leggett, Ed., Plenum Press, New York, 1985. [30] M. Meloun, M. Javůrek and J. Havel, “Multiparametric curve Fitting-X. A Structural Classification of Program for Analysing Multicomponent Spectra and their Use in Equilibrium-Model Determination,” Talanta, Vol. 33, No. 6, 1986, pp. 513-524. [31] D. J. Leggett and W. A. E. McBryde, “General Computer Program for the Computation of Stability Constants from Absorbance Data,” Analytical Chemistry, Vol. 47, No. 7, 1975, pp. 1065-1070. [32] D. J. Leggett, “Numerical Analysis of Multicomponent Spectra,” Analytical Chemistry, Vol. 49, No. 2, 1977, pp. 276- 281. [33] D. J. Leggett, S. L. Kelly, L. R. Shiue, Y. T. Wu, D. Chang and K. M. Kadish, “A Computational Approach to the Spectrophotometric Determination of Stability Con- stants—2: Application to Metalloporphyrin Axial Ligand Interactions in Non-Aqueous Solvents,” Talanta, Vol. 30, No. 8, 1983, pp. 579-586. [34] J. J. Kankare, “Computation of Equilibrium Constants for Multicomponent Systems from Spectrophoto-Metric Data,” Analytical Chemistry, Vol. 42, No. 12, 1970, pp. 1322-1326. [35] P. Gans, A. Sabatini and A. Vacca, “Investigation of Equilibria in Solution. Determination of Equilibrium Constants with the HYPERQUAD Suite of Programs,” Talanta, Vol. 43, No. 10, 1996, pp. 1739-1753. [36] H. Gampp, M. Maeder, C. J. Mayer and A. Zuberbuhler, “Calculation of Equilibrium Constants from Multiwave- length Spectroscopic Data—I: Mathematical Considera- tions, Talanta, Vol. 32, No. 2, 1985, pp. 95-101. [37] H. Gampp., M. Maeder, C. J. Meyer and A. Zuberbühler, Calculation of Equilibrium Constants from Multiwave- length Spectroscopic Data—II: Specfit: Two User-Friendly Programs in Basic and Standard Fortran 77,” Talanta, Vol. 32, No. 4, 1985, pp. 251-264. [38] H. Gampp., M. Maeder, C. J. Meyer and A. Zuberbühler, “Calculation of Equilibrium Constants from Multiwave- length Spectroscopic Data—III: Model-Free Analysis of Spectrophotometric and ESR Titrations,” Talanta, Vol. 32, No. 12, 1985, pp. 1133-1139. [39] H. Gampp., M. Maeder, C. J. Meyer and A. Zuberbühler, “Calculation of Equilibrium Constants from Multiwave- length Spectroscopic Data—IV: Model-Free Least-Squares Refinement by Use of Evolving Factor Analysis, Talanta, Vol. 33, No. 12, 1986, pp. 943-951. [40] K. Y. Tam and K. Takács-Novák, “Multi-Wavelength Spectrophotometric Determination of Acid Dissociation Constants: A Validation Study,” Analytica Chimica Acta, Vol. 434, No. 1, 2001, pp. 157-167. [41] SPECFIT/32, Spectrum Software Associates, Marlbor- ough, 2004. http://www.bio-logic.info/rapid-kinetics/specfit. html [42] T. H. Scheuermann, C. Keeler and M. E. Hodson, “Con- sequences of Binding an S-Adenosylmethionine Ana- logue on the Structure and Dynamics of the Thiopurine Methyltransferase Protein Backbone, Biochemistry, Vol. 43, No. 38, 2004, pp. 12198-12209. [43] Pallas. http://compudrug.com/show.php?id=90. http:// compudrug.com/show.php?id=36. [44] M. Meloun, J. Militký and M. Forina, Chemometrics for Analytical Chemistry—Vol. 1. PC-Aided Statistical Data Analysis, Ellis Horwood, Chichester, 1992. [45] M. Meloun, J. Militký and M. Forina, Chemometrics for Analytical Chemistry—Vol. 2. PC-Aided Regression and Related Methods, Ellis Horwood, Chichester, 1994. [46] ORIGIN, OriginLab Corporation, Northampton. [47] M. Meloun, T. Syrový and A. Vrána, “Determination of the Number of Light-Absorbing Species in the Protona- tion Equilibria of Selected Drugs,” Analytica Chimica Acta, Vol. 489, No. 2, 2003, pp. 137-151. [48] S-PLUS. http://www.insightful.com/products/splus [49] ADSTAT, ADSTAT 1.25, 2.0, 3.0 (Windows 95), Trilo- Byte Statistical Software Ltd., Pardubice. |