International Journal of Geosciences, 2012, 3, 391-397
http://dx.doi.org/10.4236/ijg.2012.32043 Published Online May 2012 (http://www.SciRP.org/journal/ijg)
Determining Angstrom Constants for Estimating
Solar Radiation in Malawi
Griffin Salima1, Geoffrey M. S. Chavula2
1Department of Mechanical Engineering, University of Malawi—The Polytechnic, Blantyre, Malawi
2Department of Civil Engineering, University of Malawi—The Polytechnic, Blantyre, Malawi
Email: {gsalima, gchavula}@poly.ac.mw
Received December 2, 2011; revised January 24, 2012; accepted February 28, 2012
ABSTRACT
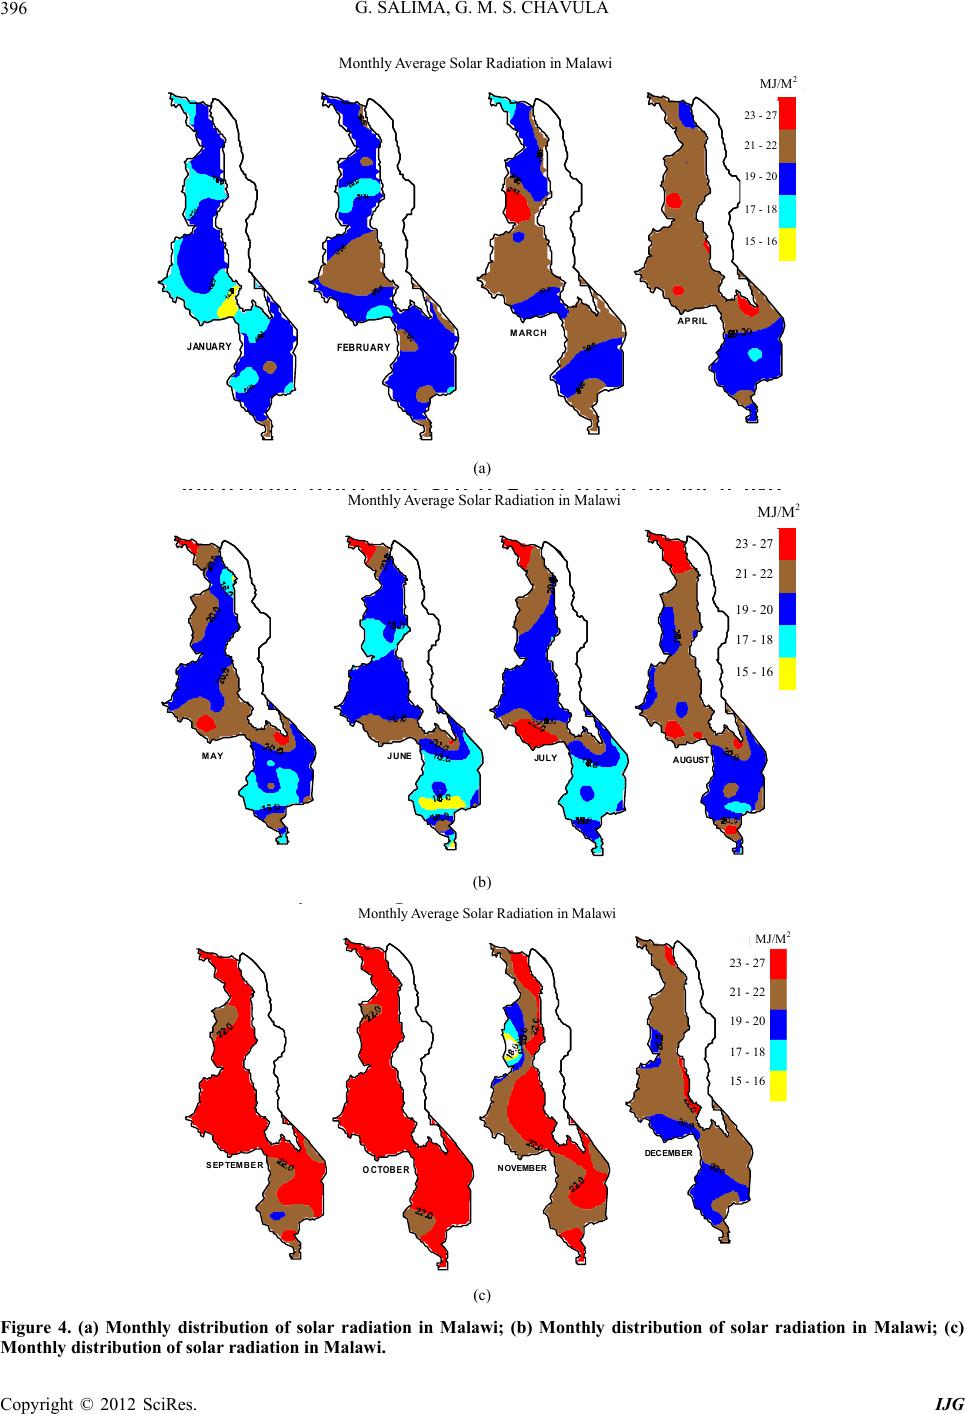
This paper discusses a procedure that was adopted for the development of a linear regression model for estimating solar
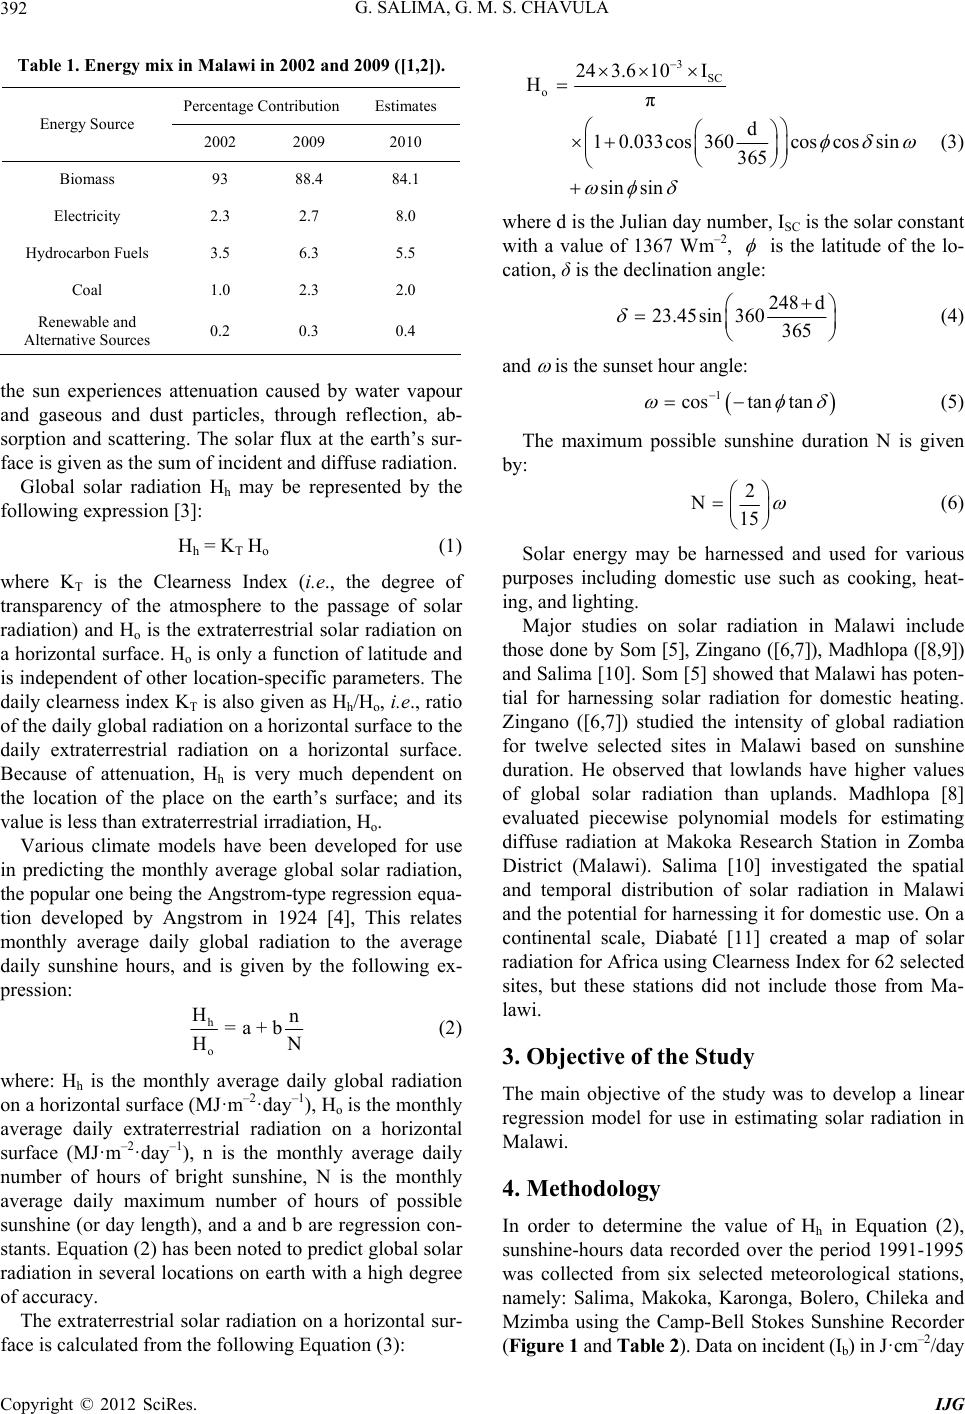
radiation in Malawi. By making use of sunshine-hours data recorded at six selected meteorological stations in the coun-
try, namely: Salima, Makoka, Karonga, Bolero, Chileka and Mzimba over the period 1991-1995, a set of Angstrom
constants were obtained and averaged in order to develop the linear regression model. This model has potential for gen-
erating ground observation data of solar radiation at any given location in the country using sunshine hours as the only
required input. The Gunn-Bellan Spherical Pyranometer and the Campbell Stokes Sunshine Recorder were respectively
used in the measurement of incident radiation (Ib) in J·cm–2/day (converted to MJ·m–2·day–1) and sunshine hours. An
Angstrom model of monthly average Clearness Index with normalized sunshine duration was then developed for each
of the six meteorological stations. The resulting linear regression model was applied in estimating monthly average
daily solar radiation. Regression analysis between computed and measured radiation data was applied to assess the reli-
ability of the generated Angstrom constants. The results generally show a high degree of agreement between the two
variables, with correlation coefficients ranging from 0.63 to 0.90. Angstrom constants obtained at the six meteorological
stations were thereafter averaged in order to develop a linear regression model for estimating solar radiation in Malawi.
Solar radiation values obtained using this model were noted to be in good agreement with those developed for each of
the six meteorological stations.
Keywords: Solar Radiation; Angstrom Constants; Sun-Shine Hours; Attenuation; Linear Regression Model
1. Introduction for developing solar energy as a viable option, noting
that the search for alternative energy sources is in line
with Malawi Energy Policy and the Malawi Growth and
Development Strategy (MDGS).
The need to explore the potential of renewable energy in
Malawi cannot be overemphasised. Although the energy
sector in the country comprises five main sub-sectors, i.e.,
electricity, biomass (fuelwood), petroleum products, coal,
and other renewable energy sources (Table 1 ), the coun-
try’s energy needs are mainly derived from fuelwood,
which accounts for 88.5% of the total energy demand [1].
Hydrocarbon fuels, electricity and coal, respectively sup-
ply 6.4%, 2.8%, and 2.4% [2]. The severe deforestation
being experienced in the country is a direct result of fu-
elwood demands and the clearing of vast expanses of
land for agricultural production. This has had serious
repercussions on soil erosion, frequency and intensity of
flash floods, siltation of water bodies, and reduction of
greenhouse gas sink capacity.
2. Solar Energy
Solar energy is a renewable resource, and is environmen-
tally friendly. Unlike fossil fuels that are only found in
selected regions of the world (e.g., in OPEC countries,
the Gulf of Mexico, etc.), solar energy is available just
about everywhere on earth. The added advantage of solar
energy is that it is provided for free and is not susceptible
to price fluctuations associated with fossil fuels. Solar
radiation may be harnessed for use either as solar thermal
or photovoltaic.
The main source of solar energy is the sun. This celes-
tial body emits electromagnetic energy determined by
solar output, sun-earth positioning, latitude, time of the
year and time of the day. Between the top of the atmos-
phere and the earth’s surface, the incident radiation from
The country’s high dependence on fuelwood calls for
concerted effort by all Malawians to explore and exploit
alternative sources of energy in order to arrest deforesta-
tion, and thus curb further environmental degradation.
This study is an attempt at assessing Malawi’s potential
C
opyright © 2012 SciRes. IJG
G. SALIMA, G. M. S. CHAVULA
392
Table 1. Energy mix in Malawi in 2002 and 2009 ([1,2]). 3
SC
o
243.6 10I
Hπ
d
10.033cos 360coscossin
365
sinsin
Percentage Contribution Estimates
Energy Source
2002 2009 2010
Biomass 93 88.4 84.1
Electricity 2.3 2.7 8.0
Hydrocarbon Fuels 3.5 6.3 5.5
Coal 1.0 2.3 2.0
Renewable and
Alternative Sources 0.2 0.3 0.4
the sun experiences attenuation caused by water vapour
and gaseous and dust particles, through reflection, ab-
sorption and scattering. The solar flux at the earth’s sur-
face is given as the sum of incident and diffuse radiation.
Global solar radiation Hh may be represented by the
following expression [3]:
Hh = KT Ho (1)
where KT is the Clearness Index (i.e., the degree of
transparency of the atmosphere to the passage of solar
radiation) and Ho is the extraterrestrial solar radiation on
a horizontal surface. Ho is only a function of latitude and
is independent of other location-specific parameters. The
daily clearness index KT is also given as Hh/Ho, i.e., ratio
of the daily global radiation on a horizontal surface to the
daily extraterrestrial radiation on a horizontal surface.
Because of attenuation, Hh is very much dependent on
the location of the place on the earth’s surface; and its
value is less than extraterrestrial irradiation, Ho.
Various climate models have been developed for use
in predicting the monthly average global solar radiation,
the popular one being the Angstrom-type regression equa-
tion developed by Angstrom in 1924 [4], This relates
monthly average daily global radiation to the average
daily sunshine hours, and is given by the following ex-
pression:
h
o
n
=a + b
HN
H (2)
where: Hh is the monthly average daily global radiation
on a horizontal surface (MJ·m–2·day–1), Ho is the monthly
average daily extraterrestrial radiation on a horizontal
surface (MJ·m–2·day–1), n is the monthly average daily
number of hours of bright sunshine, N is the monthly
average daily maximum number of hours of possible
sunshine (or day length), and a and b are regression con-
stants. Equation (2) has been noted to predict global solar
radiation in several locations on earth with a high degree
of accuracy.
The extraterrestrial solar radiation on a horizontal sur-
face is calculated from the following Equation (3):


 







(3)
where d is the Julian day number, ISC is the solar constant
with a value of 1367 Wm–2,
is the latitude of the lo-
cation, δ is the declination angle:
248 d
23.45sin 360365



(4)
and
is the sunset hour angle:
1
costan tan

 (5)
The maximum possible sunshine duration N is given
by:
2
N15



(6)
Solar energy may be harnessed and used for various
purposes including domestic use such as cooking, heat-
ing, and lighting.
Major studies on solar radiation in Malawi include
those done by Som [5], Zingano ([6,7]), Madhlopa ([8,9])
and Salima [10]. Som [5] showed that Malawi has poten-
tial for harnessing solar radiation for domestic heating.
Zingano ([6,7]) studied the intensity of global radiation
for twelve selected sites in Malawi based on sunshine
duration. He observed that lowlands have higher values
of global solar radiation than uplands. Madhlopa [8]
evaluated piecewise polynomial models for estimating
diffuse radiation at Makoka Research Station in Zomba
District (Malawi). Salima [10] investigated the spatial
and temporal distribution of solar radiation in Malawi
and the potential for harnessing it for domestic use. On a
continental scale, Diabaté [11] created a map of solar
radiation for Africa using Clearness Index for 62 selected
sites, but these stations did not include those from Ma-
lawi.
3. Objective of the Study
The main objective of the study was to develop a linear
regression model for use in estimating solar radiation in
Malawi.
4. Methodology
In order to determine the value of Hh in Equation (2),
sunshine-hours data recorded over the period 1991-1995
was collected from six selected meteorological stations,
namely: Salima, Makoka, Karonga, Bolero, Chileka and
Mzimba using the Camp-Bell Stokes Sunshine Recorder
(Figure 1 and Table 2). Data on incident (Ib) in J·cm–2/day
Copyright © 2012 SciRes. IJG
G. SALIMA, G. M. S. CHAVULA
Copyright © 2012 SciRes. IJG
393
Figure 1. Some of the meteorological stations in Malawi.
Table 2. Location of the six selected meteorological stations.
Station name Latitude
(south) Longtude
(east) Altitude
(m)
Bolero 11˚4' 33˚47' 1100
Karonga 09˚57' 33˚53' 529
Mzimba 11˚53' 33˚37' 1349
Salima 12˚45' 34˚35' 512
Makoka 15˚31' 35˚13' 1029
Chileka 15˚41' 34˚35' 767
(converted to MJ·m–2·day–1) radiation was collected by
the Gunn-Bellan Spherical Pyranometer. An Angstrom
model of monthly average Clearness Index with normal-
ized sunshine duration was then developed for each of
the six meteorological stations.
Values of Ho and N were calculated for each month
using Equations (3) and (6), respectively. The regression
coefficients a and b in Equation (2) were computed from
a graphical plot of Hh/Ho and n/N, with a as the intercept
on the Hh/Ho axis and b as the gradient.
Differences between estimated and measured values of
solar radiation were determined by the Mean Bias Error
(MBE), the Root Mean Square Error (RMSE), and the
Mean Percentage Error (MPE), given by the following
respective expressions:

h(cal) h(meas)
HH
Mean bias error MBEm


(7)
G. SALIMA, G. M. S. CHAVULA
394


2
)
RMSE
h(cal) h(meas
Root Mean Square Error
HH
m
(8)
5. Results and Discussion
Results of data analysis showed that maximum and mini-
mum solar radiation values were observed in October
and January, respectively.
Values of regression constants of Equation (2), along
with the correlation coefficients (RC) and the values of
the MBE, RMSE and MPE for the six meteorological
stations are summarized in Table 3. Figure 2 shows the
spatial distribution of sun hours in Malawi.
Results presented in Table 3 show that regression co-
efficients (RC) are higher than 0.60, implying a good
fitting between the Clearness Index Hh/Ho and the rela-
tive possible number of sunshine hours n/N. Furthermore,
there is a remarkable agreement between the measured
and calculated values of global radiation for the six loca-
tions as attested by very low values of RMSE and MPE.
Negative and positive values of MPE respectively show
slight overestimation and underestimation of Hh.
Comparison between measured and calculated Hh us-
ing Equation (2), along with regression constants given
in Table 3, indicate that the percentage error for a single
month rarely exceeds ±2% at any of the six meteorologi-
cal stations. For example, the calculated annual average
daily solar radiation value at Salima using Equation (2) is
22.1 MJ/m–2·day–1 while the measured value is 21.6
MJ/m–2·day–1. The corresponding values for Karonga and
Chileka are 17.69 MJ/m–2·day–1 and 17.7 MJ/m–2·day–1,
and 20.81 MJ/m–2·day–1 and 20.9 MJ/m–2·day–1, respec-
tively. Table 4 gives a summary of global and diffuse
radiation for Mzimba, Karonga, Makoka, Bolero and Sa-
lima meteorological stations.
From the results highlighted in Table 3, the following
simple first order Angstrom correlations models may be
developed for use in estimating values of Hh at each of
the respective six meteorological stations:
1) Salima
h
o
H= 0n
.20 + 0.44
HN
(10)
2) Makoka
h
o
H= 0n
.30 + 0.39
HN
(11)
3) Karonga
h
o
H= 0n
.31 + 0.44
HN
(12)
4) Bolero
32 33 34 3536
-17
-16
-15
-14
-13
-12
-11
-10
-9
Nsanje
Thyolo
Mulanje
Chic hiri
Mwanza Zomba
Bal ak a
M a n gochi
Ntcheu
Dedza
Chitedze Salima
Nkhotakota
Mchinji Dowa
Kasungu
Mzimba
NkhataBay
Mzuzu
Bolero
Karonga
Chitipa
6.0
7.0
8.0
9.0
AVER AGE DAILY SUNS HINE HOURS IN MALAWI
SUNSHIN E HOURS
MAP OF DAILY AVERAGE SUNSHINE HOURS
Figure 2. Sunshine hour map for Malawi.
h
o
Hn
=0.36 + 0.36
HN
(13)
5) Mzimba
h
o
Hn
=0.29 + 0.39
HN
(14)
6) Chileka
h
o
Hn
=0.32 + 0.27
HN
(15)
It is apparent from Equations (10)-(15) that neither a
nor b vary with latitude or altitude in any systematic
manner. However, the values of the sum of the regression
constants a + b, which represent the maximum Clearness
Index ((n/N) = 1), averaged over the period of analysis,
are found to be almost equal for the six meteorological
stations. The values of (a + b) obtained for Salima, Ka-
ronga, Bolero, Mzimba, Makoka, and Chileka are 0.69,
0.72, 0.59, 0.58, 0.68 and 0.59, respectively.
Averaged results for linear regression models for the
six selected stations were used in developing the linear
regression model for estimating solar radiation in Ma-
lawi:
h
o
Hn
=0.29 + 0.38
HN
(16)
Equation (16) was then used in estimating Hh for the
six locations, and in all cases the Mean Percentage Error
did not exceed ±10%. This is indicative of a fairly good
Copyright © 2012 SciRes. IJG
G. SALIMA, G. M. S. CHAVULA
Copyright © 2012 SciRes. IJG
395
Table 3. Regression constants of Equation (2) for the selected locations and the corresponding values of RC, MBE, RMSE
and MPE.
Regression constants
Location Degree of correlation RC a b (a + b) MBE RMSE MPE (%)
Salima 0.90 0.32 0.37 0.69 0.015 1.72 0.43
Karonga 0.83 0.31 0.41 0.72 0.037 0.328 0.176
Bolero 0.63 0.37 0.22 0.59 0.035 0.742 0.037
Mzimba 0.71 0.33 0.25 0.58 0.908 0.668 0.254
Makoka 0.74 0.33 0.35 0.68 0.041 1.457 0.264
Chileka 0.84 0.32 0.27 0.59 0.060 0.467 0.235
Table 4. Monthly global and diffuse radiation for the reference stations.
MZIMBA ST. KARONGA ST. MAKOKAST. BOLEROST. SALIMAST.
Month Hh H
d H
h H
d H
h H
d H
h H
d H
h H
d
Jan 17.86 12.37 20.2 11.95 20.8 12.31 18.69 12.26 15.28 11.99
Feb 17.45 12.19 20.7 11.9 20 12.49 20.13 11.91 19.98 11.49
Mar 26.41 6.12 20.8 11.61 18.9 12.7 18.75 12.01 20.33 10.99
Apr 22.79 6.8 19 12.17 17.2 12.57 19.85 9.32 21.61 7.27
May 9.95 8.44 19.7 11.98 17.1 12.5 20.67 5.71 20.49 4.83
Jun 15.8 8.04 19.2 11.99 16 12.35 18.67 6.28 19.5 4.6
Jul 19.58 5.65 20.3 12.01 16.9 12.59 20.72 5.73 19.24 5.32
Aug 18.23 9.02 24.1 9.97 20 12.49 19.87 8.22 20.79 6.58
Sep 22.27 8.83 26.2 8.29 23.8 11.17 21.03 9.87 22.43 8.42
Oct 22.44 10.49 27.4 7.02 25.2 9.94 21.47 10.85 23.47 9.7
Nov 12.17 10.61 26.4 7.83 23.7 11.12 20.18 11.94 23.74 10.71
Dec 19.83 12.19 23 10.8 19.9 12.43 21.27 11.5 22.82 11.53
agreement between measured and calculated global ra-
diation for all the meteorological stations. Figures 3 and
4 show Daily and monthly distribution of solar radiation
in Malawi developed from Equation (16).
17.5
18.5
19.5
20.5
21.5
22.5
23.0
6. Conclusions
The study has shown that maximum and minimum solar
radiation in Malawi take place in October and January
respectively. Therefore the optimum time for using solar
energy is during the month of October.
The study also resulted in the development of respec-
tive Angstrom linear regression models for each of the
six selected meteorological stations, which culminated in
the development of the Angstrom model for Malawi
given by Equation (16).
A fairly good agreement (MPE ±10%) was noted
between measured values and calculated values of solar
radiation at the six selected meteorological stations, which
makes Equation (16) useful for estimating solar radiation
in Malawi.
Since knowledge of the amount of irradiance reaching
any point on the earth’s surface is critical in the design
solar systems, the model we have developed may help
the Malawi Government to develop realistic energy policies
and programmes based on sound scientific knowledge.
Figure 3. Average daily distribution of solar radiation in
malawi in MJ/m–2·day–1. In Malawi, where there is abundant sunlight and a
G. SALIMA, G. M. S. CHAVULA
396
APRI
Mon t hly
Ave rage
So lar
Radiation
in
Malawi
L
JANUARY
MARCH
FEBRUARY
Monthly Average Solar Radiation in Malawi
MJ/M
2
23 - 27
21 - 22
19 - 20
17 - 18
15 - 16
(a)
Mon t hly
Average
So lar
Radiation
in
Malawi
MAY JUNE JULY AUGUST
Monthly Average Solar Radiation in Malawi MJ/M
2
23 - 27
21 - 22
19 - 20
17 - 18
15 - 16
(b)
SEPTEMBER
OCTOBER
DECE MBER
NOVEMBER
Monthly Average Solar Radiation in Malawi
MJ/M
2
23 - 27
21 - 22
19 - 20
17 - 18
15 - 16
(c)
Figure 4. (a) Monthly distribution of solar radiation in Malawi; (b) Monthly distribution of solar radiation in Malawi; (c)
Monthly distribution of solar radiation in Malawi.
Copyright © 2012 SciRes. IJG
G. SALIMA, G. M. S. CHAVULA 397
large rural population without proper infrastructure to
develop an electricity grid, use of PV is seen as an attrac-
tive option because of its modular features, namely: its
ability to generate electricity at the point of use, its low
maintenance requirements and its non-polluting charac-
teristics.
REFERENCES
[1] Government of Malawi, “Malawi Biomass Energy Strat-
egy,” Department of Energy, Lilongwe, 2009.
[2] Government of Malawi, “Malawi State of Environment
and Outlook: Environment for Sustainable Economic
Growth,” Malawi Government , 2010.
[3] J. A. Duffie and W. A. Beckman, “Solar Engineering of
Thermal Processes,” 2nd Edition, John Wiley, New York,
1994.
[4] A. Angstrom, “Solar and Terrestrial Radiation,” Quar-
terly Journal of the Royal Meteorological Society, Vol. 50,
No. 210, 1924, pp. 121-125.
doi: 10.1002/qj.49705021008
[5] A. K. Som, “Solar Utilization Potential in Malawi,” Ma-
lawi Journal of Science, Vol. 3, 1979, pp. 103-104.
[6] B. Zingano, “An Appraisal for Solar Water Heating in
Malawi,” MSc. Thesis, University of Malawi, Zomba,
1986.
[7] B. Zingano, “A Discussion on Thermal Comfort with
Reference to Bath Water Temperature to Deduce a Mid-
point of the Thermal Comfort Zone,” Renewable Energy,
Vol. 23, 2001, pp. 41-47.
[8] A. Madhlopa, “Evaluation of Piecewise Polynomial Mod-
els for Computation of Daily Diffuse Radiation in Ma-
lawi,” Proceedings of the 2001 ISES Solar World Con-
gress, 2001, pp. 2183-2189.
[9] A. Madhlopa, “Solar Radiation Climate in Malawi,” So-
lar Energy, Science Direct, University of Malawi, Zomba,
2005.
[10] S. Griffin, “Spatial and Temporal Solar Radiation Distri-
bution and Solar Energy Collection Potential in Malawi,”
M.Sc. Dissertation, University of Zimbabwe, Harare,
2007.
[11] L. Diabate, Ph. Blanc and L. Wald, “Solar Climate in
Africa,” Solar Energy, Vol. 76, No. 6, 2004, pp. 733-744.
doi:10.1016/j.solener.2004.01.002
Copyright © 2012 SciRes. IJG