 Open Journal of Respiratory Diseases, 2012, 2, 43-56 http://dx.doi.org/10.4236/ojrd.2012.22007 Published Online May 2012 (http://www.SciRP.org/journal/ojrd) Comparative Variability of Nasal Potential Difference Measurements in Human and Mice Anissa Leonard1,2*, Bob Lubamba2*, Barbara Dhooghe 2, Sabrina Noel2, Pierre Wallemacq2, Patrick Lebecque1, Teresinha Leal1,2# 1Pediatric Pulmonology & Cystic Fibrosis Unit, St Luc University Hospital, Brussels, Belgium 2Louvain Centre for Toxicology and Applied Pharmacology, Institut de Recherche Clinique et Expérimentale, Université Catholique de Louvain, Brussels, Belgium Email: #teresinha.leal@uclouvain.be Received February 21, 2012; revised March 20, 2012; accepted April 25, 2012 ABSTRACT Background: Nasal potential difference (NPD) test has long been used to assist in the diagnosis of Cystic Fibrosis (CF) and more recently as an outcome measure in clinical trials of new CF therapies. This test has also been adapted to the mouse nose. Objectives: We aimed at evaluating variability of the NPD measurements in CF patients displaying two severe CFTR mutations and in sex-matched healthy controls. NPD recorded from F508del-CF and normal wild-type mice were also compared. Methods and Results: In each setting, tests were performed by a single qualified operator. In the clinical setting, the latest standardized operation protocol of the CF foundation was followed. A total of 80 trac- ings were obtained from 10 patients (23.2 y; range 14 to 32) and 10 healthy subjects (34 y; range 24 to 53), each tested twice, in both nostrils. Two CF and two controls were excluded from the statistical data analysis due to the presence of a single non interpretable NPD tracing (4/80, 5%). To achieve equal sample size, tests were obtained from 8 CF mice and normal wild-type. Comprehensive multivariate analysis of paired data showed a good reproducibility of NPD pa- rameters in the clinical and the preclinical setting; lower variability was observed in mice. However, 95% repeatability limits of NPD parameters were large indicating a large measurement error, poor precision and low within-subject re- peatability. In both settings, chloride secretion was shown to be the most reproducible and repeatable parameter. Con- clusion: In human as in mice, NPD showed good reproducibility but limited within-subject repeatability. Keywords: Animal Models; CFTR; Cystic Fibrosis; Nasal Potential Difference 1. Introduction Electrical potential difference (PD) across the mucous nasal epithelia has been used for more than two decades to assess cystic fibrosis (CF) transmembrane conductance regulator (CFTR) activity and to assist in the diagnosis of CF [1]. As a multiphase test performed under continuous perfusion [2,3], nasal PD allows functional dissection of CFTR and epithelial sodium channel (ENaC) at the nasal mucosa, explored as a representative sample of distal airways [1]. Implementation of the nasal PD test into CF centers around the world has been challenging as the technique is delicate and it requires dedicated equipment and supplies and trained skilled operators. To explore the presence in CF of ion transport abnormalities, CF research teams had to develop inventive in-house setups of the test. As a result, operating protocols have critically diverged among CF centers. The nasal PD test has also proved to be helpful for the differential diagnosis of atypical CF and CFTRopathies other than CF [4,5]. More recently, the test has been used as an outcome measure in clinical trials of new CF thera- pies to assess therapeutic modulation of the basic CFTR defect [6-16]. Therefore, an urgent need of standardizing the test has emerged. Substantial efforts have been devoted by the CF Foundation Therapeutics-Therapeutics Devel- opment Network (CFFT-TDN) and by the Clinical Trial Network of the European Cystic Fibrosis Society (ECFS- CTN) to perfect a standardized operating protocol (SOP) to be adopted by CF centers worldwide. Adoption of a nasal PD SOP is expected to reduce real-time recording artifacts, to improve quality of data [17] and also to mini- mize inter-site variability. Studies on variability of the test under these optimized conditions are missing. The nasal PD test has been adapted to the mouse nose [18] which has allowed investigating the potential of new CF therapies in preclinical settings [19-21]. Translation of data into clinical practice deals with obvious pheno- typic differences between mouse and human CF disease *Equal contributors. #Corres ondin autho . C opyright © 2012 SciRes. OJRD  A. LEONARD ET AL. 44 but also with variability of the nasal PD test in both clinical and preclinical settings. This study was designed to evaluate comparative variability of the nasal PD test in patients with CF and in healthy control subjects as well as in CF mice homozygous for the clinically relevant F508del mutation [22] and in normal homozygous wild- type mice from the corresponding background. 2. Material and Methods 2.1. Clinical Dataset 2.1.1. Study Subjects The Local Ethics Committee approved the study and informed written consent was obtained from all partici- pants. Ten young adult patients with CF, pancreatic in- sufficiency and clinical stable lung disease, and 10 healthy non-smoking subjects with no apparent respiratory mor- bidity took part in the study. CF was diagnosed by typi- cal respiratory and gastrointestinal symptoms, elevated sweat chloride concentrations and the presence of two CFTR mutations. Prior to any nasal PD assessment, the operator ensured that patients and healthy subjects did not present any sign of upper airway infection within 2 weeks before study enrolment. Additional exclusion cri- teria were smoking, nasal polyps and previous nasal sur- gery. 2.1.2. Cli n i c al Data The following clinical data were collected: age, height, weight, sputum cultures and genotype analyses. Sweat test was carried out by pilocarpine iontophoresis accord- ing to Gibson and Cooke [23]. Quantitative analysis of sweat chloride and sodium was performed by coulomet- ric titration and flame photometry, respectively. Pancre- atic status was determined by fat or elastase contents in stool samples; pancreatic insufficiency wad defined as the need for supplemental pancreatic enzymes in patients with fecal fat >7% (wt/wt) of the amount of dietary fat or with fecal elastase <200 µg/g. Respiratory involvement was assessed by lung function testing on the day of first nasal PD measurements and values obtained were com- pared with those from a previous test performed 3 months ago to confirm stability (<10% difference from previous measure). Forced expiratory volume in 1s (FEV1) and forced vital capacity (FVC) were expressed as percentage of the predicted value for age, sex and height [24]. Patients with persistent positive cultures of Pseudomonas aeruginosa from on average 2 sputum collections over at least 6 consecutive months were clas- sified as chronically infected. Nutritional status was sim- ply assessed by body mass index (BMI, ratio of body weight (kg) to height (m2)). Genomic DNA extracted from circulating blood samples was used to perform CFTR gene mutation analyses by using a Luminex xTAG® 71 v2 kit [25]. 2.1.3. Nasal PD Measurements Nasal PDs were performed by a single operator (AL) according to the CFFT-TDN SOP. Briefly, nasal PD values were recorded at a high frequency (1 mHz) using a set of standardized equipment composed of an ISO-Z isolation head-stage (10-02020) coupled to a BMA-200 AC/DC bioamplifier (08-03000) and to an analog/digital converter (PowerLab 4/30) from ADInstruments (Colo- rado Springs, CO). Captured data was processed and scored using a dedicated client ADInstruments software (GLP Client V6). A pair of nonperfused calomel electrodes (13-620-79; Fisher Scientific, Waltham, MA) was con- nected to the head-stage unit; the measuring electrode was connected to a double-lumen end-hole nasal catheter (EU certificate 0337/B5/02; Marquat, Boissy Saint Leger, France). One lumen of the catheter was extemporarily filled with autoclaved warmed 3% agar/Ringer solution and the other lumen was used for perfusion of buffered solutions into the nose. The reference electrode was connected to a 23 G needle also filled with agar gel and inserted in the subcutaneous space in the forearm. Agar-filled nasal catheter and subcutaneous needle were attached to the calomel electrodes through a 3 M KCl bridge. Basal values were initially recorded, under visual con- trol, from 0.5 to 3.0 cm to the anterior tip of the inferior turbinate then the catheter was placed at the site of the most negative value. Solutions were perfused under a continuous 5 ml/min rate for a minimum of one minute up to five minutes until reaching a steady state value (±0.5 mV over 30 sec). Sequential perfusion was per- formed with 1) Ringer solution; 2) Ringer solution with 10−4 M amiloride; 3) Zero-chloride solution with 10−4 M amilo- ride; 4) Zero-chloride solution with 10–4 M amiloride and 10−5 M isoproterenol. Finally, 10−5 M ATP, an activator of alternative, non-CFTR dependent channels, was added to the solution containing isoproterenol, this served as a positive control of the test. Temperature of solutions, measured at the tip of the exploring catheter, was 36.9˚C. After testing the first nostril, lines were flushed out with perfused solutions in the reverse order for at least 30 seconds each in order to avoid possible cross-nostril contamination. To evaluate within-subject repeatability of measures, a nasal PD test was repeated, 3 - 5 days after the first test, in each participant. Low quality trac- ings (flat tracings, artifacts at solution changes, tracings with lots of wandering baseline, etc.) were excluded. Tracings were double read by the operator and a blind reviewer (TL) unaware of the first readings. 2.2. Mouse Dataset CF mice homozygous for the F508del mutation in the Copyright © 2012 SciRes. OJRD  A. LEONARD ET AL. 45 129/FVB outbred background [22] and their normal ho- mozygous wild-type littermates were studied. Mouse age ranged from 3 - 4 months and weight from 20 - 30 g. The animals were housed at our Animal Care Facility fol- lowing recommendations of the Federation of European Laboratory Animal Science Associations [26]. These studies and procedures were approved by the local Ethics Committee for Animal Welfare and conformed to the European Community regulations for animal use in re- search (CEE n° 86/609). Nasal PD measurements in mice were recorded at a 1 Hz frequency, as described elsewhere [18-21]. In brief, a double lumen catheter was placed in a nasal passage, one lumen being used for perfusion of Ringer solutions, and the other one serving as measuring Ag/AgCl electrode (SLE Instruments, South Croydon, UK) connected to the positive terminal of a data memory high impedance (>1012 Ω) voltmeter (Knick Portamess® 913, Elektron- ische Me ßgeräte, Berlin, Germany) through an electrode cream (Signa cream, Parker Labs, Fairfield, NJ) diluted 1:1/vol:vol in 3 M KCl. A needle inserted in the subcu- taneous space in a hind leg served as reference bridge. Solutions were perfused at room temperature, at a con- stant rate of 12 µl/min in the same succession described in the clinical protocol, except for the ATP phase which was not tested in mice. Buffered solutions of identical compositions as those of the clinical setting were used; isoproterenol was replaced by forskolin. 2.3. Statistical Analysis Descriptive statistics (mean ± SD) and tests of statistical significance were performed using SAS-JMP9 software (SAS Institute, Cary, NC, USA). Prior to statistical analy- sis, data were checked for normality of distributions (Shapiro-Wilk test). Comparisons between values ob- tained from right and left nostrils were performed by pairwise bivariate analysis and by Pearson’s correlation after addressing concerns on potential outliers by apply- ing a Mahalanobis discordance test, as needed. Before pooling together and averaging data from right and left nostrils, comparison of means was analyzed by using one-way analysis (ANOVA) and equality of variances was checked by posthoc homocedacity analysis by ap- plying the Snedecor’s F bilateral test. After checking normality of residuals, comparisons between repeated tests were performed by pairwise multivariate analysis of averaged right-left nostril values by applying the paired Student’s t test; equality of variances was assessed by Welch test or nonparametric Wilcoxon test, as adequate. Between-test comparisons were also made by Bland- Altman reproducibility plots [27]. Comparative variabil- ity between groups was assessed by testing the null hy- pothesis that the ratio between variances of the two sam- ples is equal to 1. Null hypothesis was rejected at p < 0.05. 3. Results 3.1. Clinical Dataset A total of 80 nasal PD tracings were obtained from 10 patients and 10 healthy subjects tested twice, in quick succession, in both nostrils. Comprehensive statistical analysis of comparative variability of the test required 4 tracings of good quality from each participant. Four tracings (5%), 1 out of the 4 individual nasal PD tracings generated in two patients (numbered 9 and 10, Table 1) and in two healthy controls, were considered non inter- pretable because of a flat pattern or the presence of large artifacts. Even though the three other tracings obtained from these two patients and two controls were considered of good quality, the 4 corresponding participants were excluded from the statistical analysis of repeatability of the nasal PD test. Table 1 summarizes clinical characteristics of CF pa- tients. Median age at time of nasal PD tests in the 8 CF patients with 4 interpretable tests was 22.5 years (range: 14 to 32). The median age of the 8 healthy controls with interpretable tests was 34 years (range: 24 to 53). Sex distribution was identical in the selected patients and controls (5 females in each group). Sweat chloride and sodium concentrations in selected CF patients averaged 115 ± 5.6 and 106 ± 5.8 mmol/L, respectively. BMI reached a Z score of −0.5. All patients displayed severe class I or II mutations and were pancreatic insufficient. Representative nasal PD tracings from a patient with CF and from a healthy subject are illustrated in Figure 1. From each tracing, the following three representative variables of the nasal PD test were extracted: 1) the maximally negative, most polarizing, stable basal PD value (PDmax); 2) the amiloride response, corresponding to the change in PD values recorded from the end to the beginning of perfusion with Ringer plus amiloride solu- tion; and 3) the total chloride response (SumCl), corre- sponding to the change in PD values recorded from the end of perfusion with zero-chloride solution containing isoprenaline to the end of Ringer plus amiloride solution. As expected, CF patients displayed basal hyperpolariza- tion, increased amiloride response and almost completely abolished SumCl. Additionally, CF patients showed more marked response to ATP (Figure 1 (a)). There was no inter-reading disagreement between readings by the operator and the reviewer. Detailed indi- vidual values and means (SD) of PDmax, amiloride re- sponse and SumCl obtained from both nostrils of 8 pa- tients with CF and 8 healthy controls subjects at two dif- ferent measurements (test 1 and test 2) are depicted in Figure 2. Data from the same participant inside each roup are indicated by the same colour code. g Copyright © 2012 SciRes. OJRD  A. LEONARD ET AL. Copyright © 2012 SciRes. OJRD 46 0 5 10 15 Amiloride-sensitive response -100 -80 -60 -40 -20 0 20 Amiloride- insensitiv e r esponse na sa l P D ( m V) ATP zero-chloride am i lor i deRi nger isoprot er enol time (min ) (a) -100 -80 -60 -40 -20 0 20 0 1 2 3 4 5 6 7 8 9 10 11 12 13 14 1 0 5 10 15 SumCl nasal PD ( mV) ATP zero-chloride amilor i deRi nger time (min) isoproter enol (b) Figure 1. Representative tracings from a patient with CF (a) and a healthy control subject (b). Table 1. Individual clinical and biological data of patients with CF. Sweat test Cl− Na+ Patient Age years mmol/L Genotype Sputum culture or throat swabFEV1 % pred FVC % pred BMI Z score 1, F 14 120 97 F508del/1717-1G > ANormal flora 101 103 −1.2 2, M 16 122 105 F508del/1717-1G > ANormal flora 95 106 +0.3 3, F 23 110 104 F508del/N1303K Normal flora 97 106 +1.6 4, M 17 119 109 F508del/2143delT A. fumigatus 87 104 +0.7 5, F 15 111 110 F508del/1717-1G > ANormal flora 116 112 −0.2 6, F 32 110 106 F508del/1717-1G > AP. aeruginosa 50 96 −1.4 7, F 31 112 111 F508del/F508del P. aeruginosa 61 87 +1.6 8, M 32 122 117 F508del/F508del P. aeruginosa 75 94 −0.2 9, F 22 110 106 F508del/2183AA > GNormal flora 89 102 −1.7 10, F 30 105 96 F508del/F508del Normal flora 80 103 0 BMI = body mass index; FEV1 = forced expiratory volume in one second; FVC = forced vital capacity; F = female; M = male. 3.1.1. Good Right-Left Nostril Correspondence of Nasal PD Values Nasal PD parameters obtained from CF and control groups showed a good correspondence between right to coefficient (upper-lower confidence interval) of 0.885 left nostril values (Figures 3(a)-(c)) with a Pearson’s from the two nostrils in CF and nonCF were not different (0.769 - 0.944) for PDmax, of 0.872 (0.743 - 0.939) for amiloride response and of 0.850 (0.703 - 0.928) for SumCl. The differences between paired means obtained 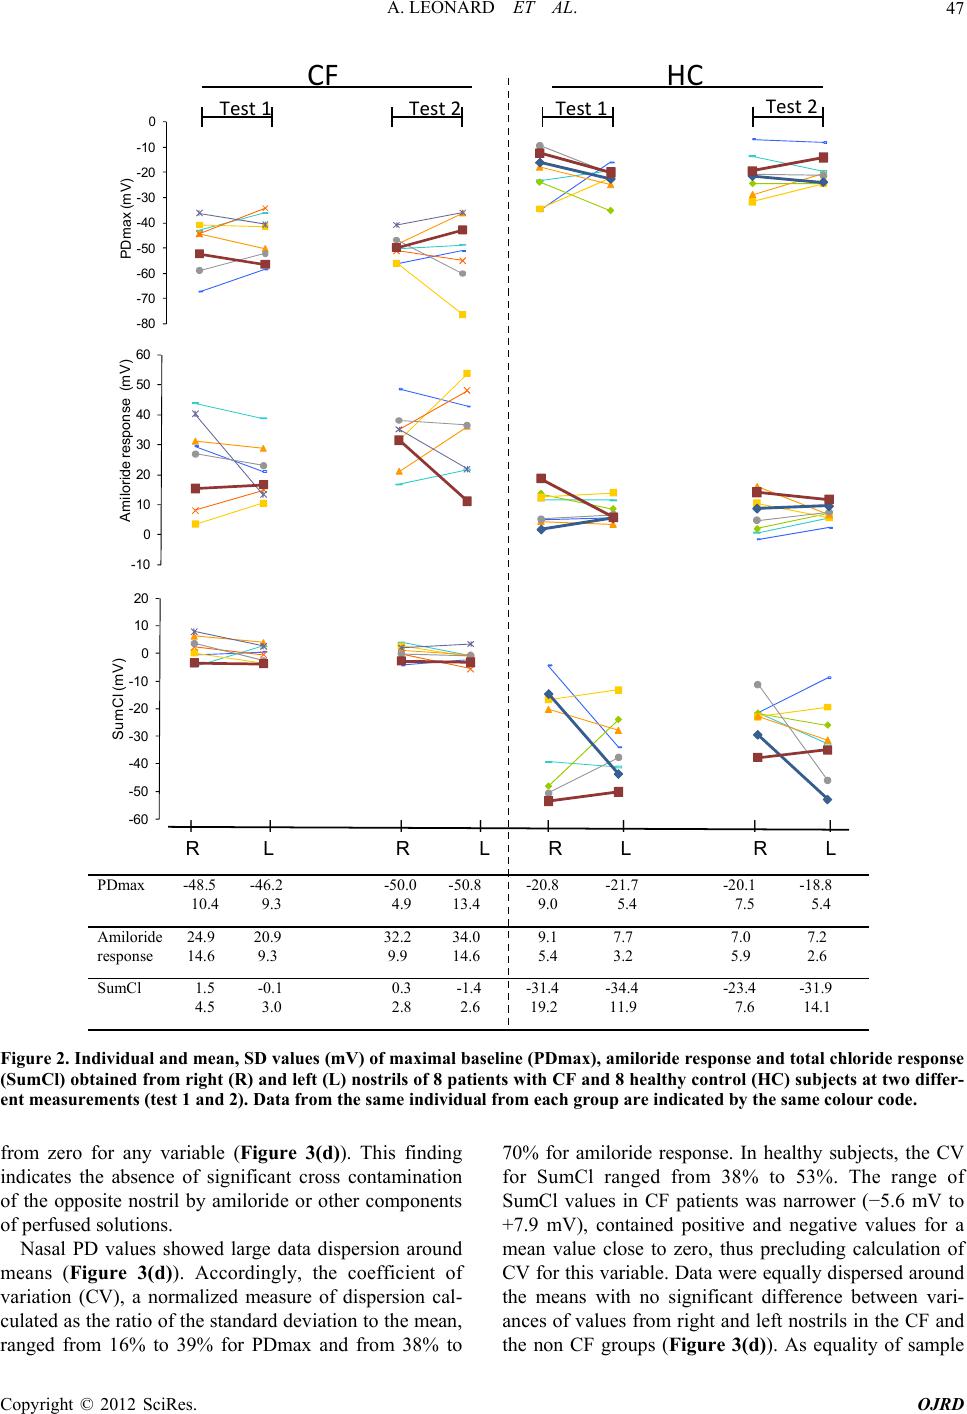 A. LEONARD ET AL. 47 PDmax -48.5 10.4 -46.2 9.3 -50.0 4.9 -50.8 13.4 -20.8 9.0 -21.7 5.4 -20.1 7.5 -18.8 5.4 Amiloride response 24.9 14.6 20.9 9.3 32.2 9.9 34.0 14.6 9.1 5.4 7.7 3.2 7.0 5.9 7.2 2.6 SumCl 1.5 4.5 -0.1 3.0 0.3 2.8 -1.4 2.6 -31.4 19.2 -34.4 11.9 -23.4 7.6 -31.9 14.1 PDmax -48.5 10.4 -46.2 9.3 -50.0 4.9 -50.8 13.4 -20.8 9.0 -21.7 5.4 -20.1 7.5 -18.8 5.4 Amiloride response 24.9 14.6 20.9 9.3 32.2 9.9 34.0 14.6 9.1 5.4 7.7 3.2 7.0 5.9 7.2 2.6 SumCl 1.5 4.5 -0.1 3.0 0.3 2.8 -1.4 2.6 -31.4 19.2 -34.4 11.9 -23.4 7.6 -31.9 14.1 -60 -50 -40 -30 -20 -10 0 10 20 SumCl (mV) -10 0 10 20 30 40 50 60 Amiloride response (mV) -80 -70 -60 -50 -40 -30 -20 -10 0 PDmax (mV) -80 -70 -60 -50 -40 -30 -20 -10 0 PDmax ( mV) -10 0 10 20 30 40 50 60 Amiloride response (mV) -60 -50 -40 -30 -20 -10 0 10 20 SumCl (mV) l l l l l l l l CF HC Test 1Test 2Test 1 R L R L R L R L Test 2 Figure 2. Individual and mean, SD values (mV) of maximal baseline (PDmax), amiloride response and total chlori response om zero for any variable (Figure 3(d)). This finding wed large data dispersion around m ranged from 16% to 39% for PDmax and from 38% to 70% for amiloride response. In healthy subjects, the CV the non CF groups (Figure 3(d)). As equality of sample de (SumCl) obtained from right (R) and left (L) nostrils of 8 patients with CF and 8 healthy control (HC) subjec ts at two differ- ent measurements (test 1 and 2). Data from the same individual from each group are indicated by the same colour code. fr indicates the absence of significant cross contamination of the opposite nostril by amiloride or other components of perfused solutions. Nasal PD values sho eans (Figure 3(d)). Accordingly, the coefficient of variation (CV), a normalized measure of dispersion cal- culated as the ratio of the standard deviation to the mean, for SumCl ranged from 38% to 53%. The range of SumCl values in CF patients was narrower (−5.6 mV to +7.9 mV), contained positive and negative values for a mean value close to zero, thus precluding calculation of CV for this variable. Data were equally dispersed around the means with no significant difference between vari- ances of values from right and left nostrils in the CF and Copyright © 2012 SciRes. OJRD  A. LEONARD ET AL. 48 -80 -60 -40 -20 0 -8 0 -60-40-200 PDmax right nostril (mV) PDmax left nostril (mV) -2 0 0 20 40 -2002040 60 Amiloride response right nostril (mV) Amiloride response left nostri 60 l (mV) 20 A B C -60 -40 -20 0 -60 -40 -20020 SumCl right nostril (mV) SumCl left nostril (mV) (a) (b) (c) 5.5 ±16.9 0.6 ±4.8 -0.2 ±8.2 1.6 ±3.5 1.1 ±12.8 -0.7 ±8.9 Paired 0.58720.2626-33.2 ±12.7-27.7 ±14.6SumCl 0.39200.69877.4 ±2.88.0 ±5.6Amiloride response 0.13880.9431-20.3 ±5.4-20.4 ±8.0PDmaxHealthy controls 0.31520.1691-0.7 ±2.80.9 ±3.6SumCl 0.76700.815627.4 ±13 .628.5 ±12.6Amiloride response 0.16780.8371-48.5 ±11.4-49.2 ±7.9PDmaxPatients withCF P value for difference comparison of varian ces P value for comparison of means Left nostrilRig ht n os tril D 5.5 ±16.9 0.6 ±4.8 -0.2 ±8.2 1.6 ±3.5 1.1 ±12.8 -0.7 ±8.9 Paired difference P value for comparison of varian ces P value for comparison of means Left nostrilRig ht n os tril D 0.58720.2626-33.2 ±12.7-27.7 ±14.6SumCl 0.39200.69877.4 ±2.88.0 ±5.6Amiloride response 0.13880.9431-20.3 ±5.4-20.4 ±8.0PDmaxHealthy controls 0.31520.1691-0.7 ±2.80.9 ±3.6SumCl 0.76700.815627.4 ±13 .628.5 ±12.6Amiloride response 0.16780.8371-48.5 ±11.4-49.2 ±7.9PDmaxPatients withCF (d) Figure 3. Comparison between right and left nostril values of maximal baseline (PDmax, a), amilore response (b) and total chloride response (SumCl, c) variables obtained from repeateasurements in 8 patients with CF (open diamonds) and 8 ent of repeat- Repeated Nasal PD Variables r each indivitted against the means of correspond- higher and at the low ends of the limits of agreement. zero. These findings indicate a good within-subject wer than the estimated 95% repeatability limit, repeatability coef- corres e of the variability of the pa This finding indicates that the measurement error of id ed m healthy control subjects (closed diamonds). Table (d) illustrates means (±SD) of 16 individual values obtained from the right and left nostrils, the corresponding paired difference and the p values for comparisons of means (paired t test) and for com- parisons of variances (Snedecor’s test). means and variances were adequately addressed, further atistical analyses consisting on assessm Moreover, the averages of each variable were close to st ability of nasal PD measurements, averaged right-left values obtained from a given test were pooled together and averaged. 3.1.2. Good Agreement of Differences between repeated measurements fo dual were plo ing values [27]. When examining repeatability of the nasal PD test, we expected the mean difference (bias difference) between repeated measurements to be zero. We also expected the difference between repeated meas- urements to be less than 1.96 SD for 95% of the paired observations. This corresponds to the 95% repeatability coefficient, and its upper and lower boundaries corre- spond to the repeatability limit or limit of agreement. As illustrated, all plotted values obtained in this study lied inside the 95% limits of agreement for each variable in both CF and controls (Figures 4(a)-(f)). As also illus- trated, plotted values were similarly dispersed at the agreement of repeated nasal PD measurements. 3.1.3. Lower Within-Subject Variability of Chloride Secretion in CF Patients As illustrated in Figure 4, even though the difference between repeated measurements was globally lo ficients were large for all variables as compared to the ponding mean values. Between-group comparisons of the variability of the measurements showed that the SD of the paired differ- ence of PDmax values obtained from repeated tests did not significantly differ between CF and controls (Figure 4(g)). However, the magnitud ired mean differences for the two other variables was significantly different between CF and controls (Figure 4(g)). In patients with CF, a relatively lower between- subject variability of chloride secretion and a higher cor- responding variability of amiloride response were ob- served. The smallest SD (2.9) was found for CF SumCl. Copyright © 2012 SciRes. OJRD  A. LEONARD ET AL. 49 -30 -20 -10 0 10 20 30 n values (mV) -60 -40 -20020 Mean PDmax from 2 tests (mV) Difference betwee 10 20 30 -30 -20 -10 0 -60 -40 -20020 Mean PDmax from 2 tests Difference between values (mV) mV (a) (d) -60 -40 -20 0 20 40 0204060 Mean amiloride response from 2 tests ( mV) Difference between values (mV) -20 -10 0 10 lues (m 20 02 04060 Mean amiloride response from 2 tests ( mV) Difference between vaV) (b) (e) -10 -5 0 5 10 -60-40 -20020 Mean SumCl from 2 tests (mV) Difference between values (mV) -30 -20 -10 0 10 20 es (m 30 -60 -40 -20020 Mean SumCl from 2 tests (mV) Difference between valuV) (c) (f) GPatients with CF Healthy subjects P value for comparison of means P value for comparison of variances PDmax3.1 ± 12.0-1.7 ±7.20.35160.1983 Amiloride response -10.3 ± 18.61.3 ± 5.30.27010.0023 SumCl1.2 ±2.9-4.9 ± 10.90.08310.0038 (g) Figure 4. Bland-Altman plots showing distribution of differences between repeated PDmax (a, d), amiloride response (b, e) and SumCl (c, f) values as a function of average of the corresponding values obtained from patients with CF (a, b and c) and 8 healthy controls (d, e and f). Table (g) illustrates meaSD) of paired differences otained from two tests together the clini- animal was tested twice within an interval of 3 - 5 days. Because of large ion of the procedure in mice, a tween-group variability in mice was based on repeated 8 bns (± with p values for comparisons of means (paired t test) and for comparisons of variances (Snedecor’s test). SumCl is estimated to be, with 95% probability, lower than ±5.7 (1.96 × SD) mV. The degree of variability was lobally larger when data from the first investigated nos- cal dataset, nasal PD tests were obtained from 8 F508del homozygous mice and 8 normal homozygous wild-type mice from the same background. Each g tril only were analyzed (data not shown), instead of av- erage of two nostril values, as presented here. 3.2. Mouse Dataset In order to achieve equal sample size as that of cross-nostril contaminat single nostril, always the same for the same animal, was explored. Statistical analysis of repeatability and be- Copyright © 2012 SciRes. OJRD  A. LEONARD ET AL. 50 single nostril tracing tests from each animal. Nasal PD in mice was performed by a single operator (BL). Double- readings of tracings by a blinded reviewer (TL) did not show disagreement. All 32 tracings obtained from mice were considered of good quality. Representative nasal PD tracings from an F508del-CF mouse and from a wild-type mouse are illustrated in Figure 5. As for the clinical dataset, the three representa- tive variables of the nasal PD test, PDmax, amiloride response and SumCl, were extracted. CF mice showed typical ion transport abnormalities similar to those observ- ed in patients, i.e. basal hyperpolarization, increased am ps of animals an iloride response and reduced SumCl. Detailed individual values of PDmax, amiloride re- sponse and SumCl obtained from CF and wild-type ani- mals at two different measurements (test 1 and test 2) are depicted in Figure 6. Data from the same animal inside each group are indicated by the same colour code. Mean (SD) values of variables, also shown in Figure 6, were significantly different between the two grou d mean SumCl values were reduced by about 75% in F508del animals as compared with the wild-type group. (a) CF WT PDmax -23. 8 1.3 -23.9 3.5 -19. 9 2.8 -20. 5 3.1 Amiloride response 23.3 3.6 22.1 1.6 19.8 1.2 20.0 1.9 SumCl -5. 6 1.8 -5.0 1.4 -21. 4 7.1 -21. 6 5.4 PDmax -23. 8 1.3 -23.9 3.5 -19. 9 2.8 -20. 5 3.1 Amiloride response 23.3 3.6 22.1 1.6 19.8 1.2 20.0 1.9 SumCl -5. 6 1.8 -5.0 1.4 -21. 4 7.1 -21. 6 5.4 test 1 test 2 test 1 test 2 -30 -25 -20 -15 PDmax (mV) 15 Am 20 25 30 iloride response (mV) -40 -30 -20 -10 0 SumCl (mV) Figure 6. Individual and mean, SD values (mV) of maximal baseline (PDmax), amiloride response and total chloride response (SumCl) obtained from 8 CF mice homozygous for the F508del mutation and 8 normal homozygous mice from the same background (WT) at two different measurements (test 1 and 2). Data from the same animal from each group are indicated by the same colour code. 3.2.1. Good Agreement of Repeated Nasal PD Variables Assessment of agreement between repeated measure- ments performed by Bland and Altman method (Figures 7(a)-(f)) showed that, in both CF and wild-type mice, plotted values for nasal PD variables lied inside the 95% limits of agreement and were similarly dispersed around the mean value that were close to zero. These findings indicate a good within-mouse agreement of repeated na- sal PD measurements. (b) Figure 5. Representative tracings from a CF mouse homo- zygous for the F508del mutation (a) and a homozygous normal mouse from the same background (b). 3.2.2. Lower Within-Mouse Variability of Chloride Secretion in CF Differences between repeated values were lower than the Copyright © 2012 SciRes. OJRD 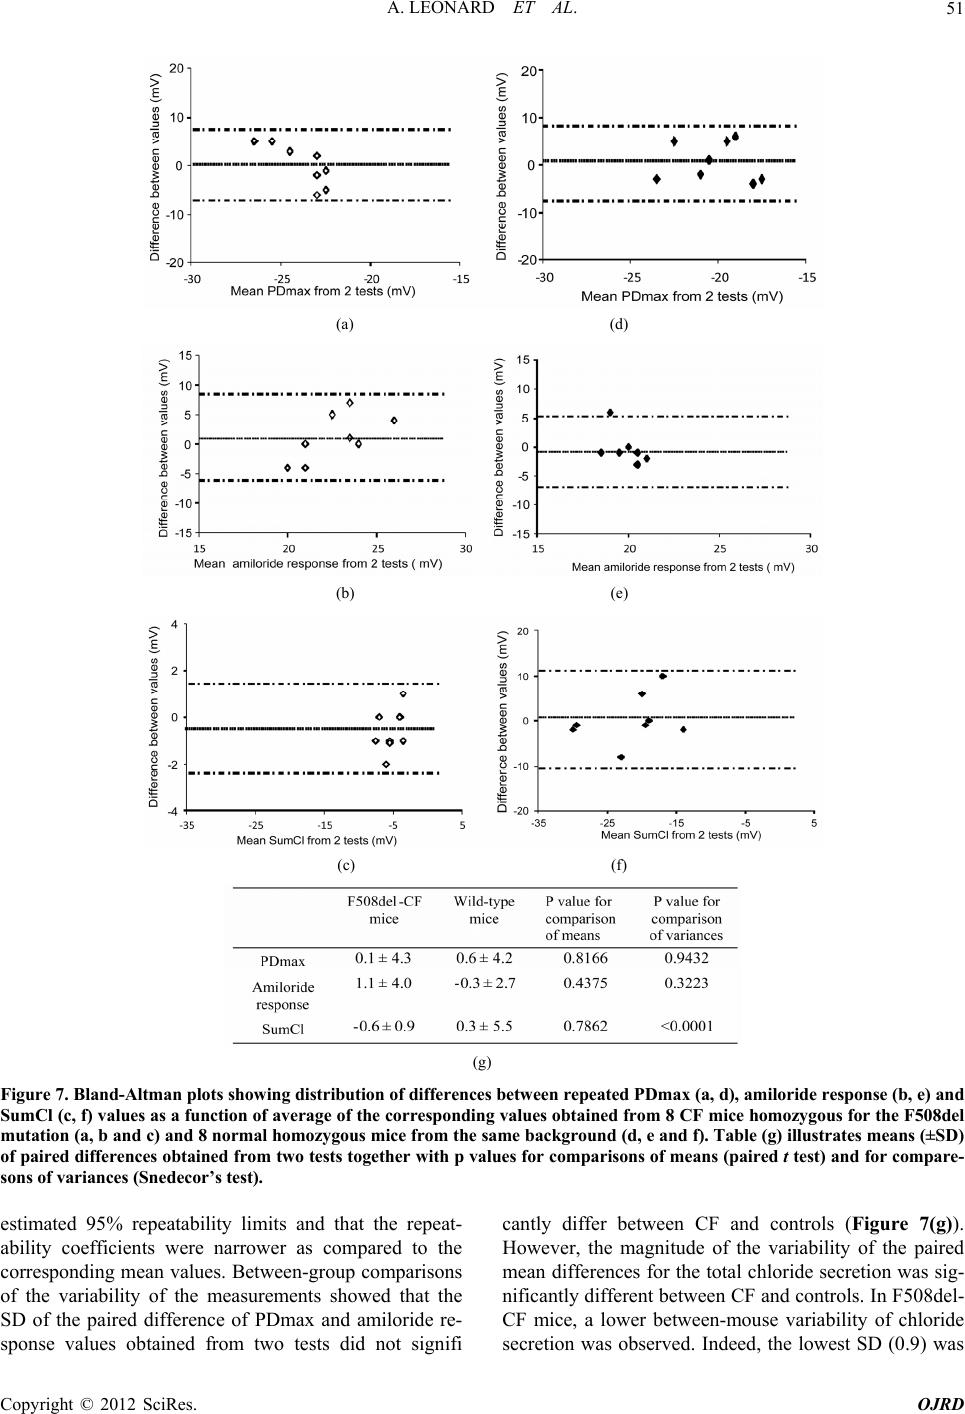 A. LEONARD ET AL. Copyright © 2012 SciRes. OJRD 51 (a) (d) (b) (e) (c) (f) (g) Figure 7. Bland-Altman plots showing distriDmax (a, d), amiloride response (b, e) and SumCl (c, f) values as a function of average of the corresponding values obtained from 8 CF mice homozygous for the F508del mutation (a, b and c) and 8 normal homozygous mice from the same background (d, e and f). Table (g) illustrates means (±SD) of paired differences obtained from two tests together with p values for comparisons of means (paired t test) and for compare- sons of variances (Snedecor’s test). estimated 95% repeatability limits and that the repeat- ability coefficients were narrower as compared to the corresponding mean values. Between-group comparisons of the variability of the measurements showed that the cantly differ between CF and controls (Figure 7(g)). However, the magnitude of the variability of the paired mean differences for the total chloride secretion was sig- nificantly different between CF and controls. In F508del- bution of differences between repeated P SD of the paired difference of PDmax and amiloride re- sponse values obtained from two tests did not signifi CF mice, a lower between-mouse variability of chloride secretion was observed. Indeed, the lowest SD (0.9) was 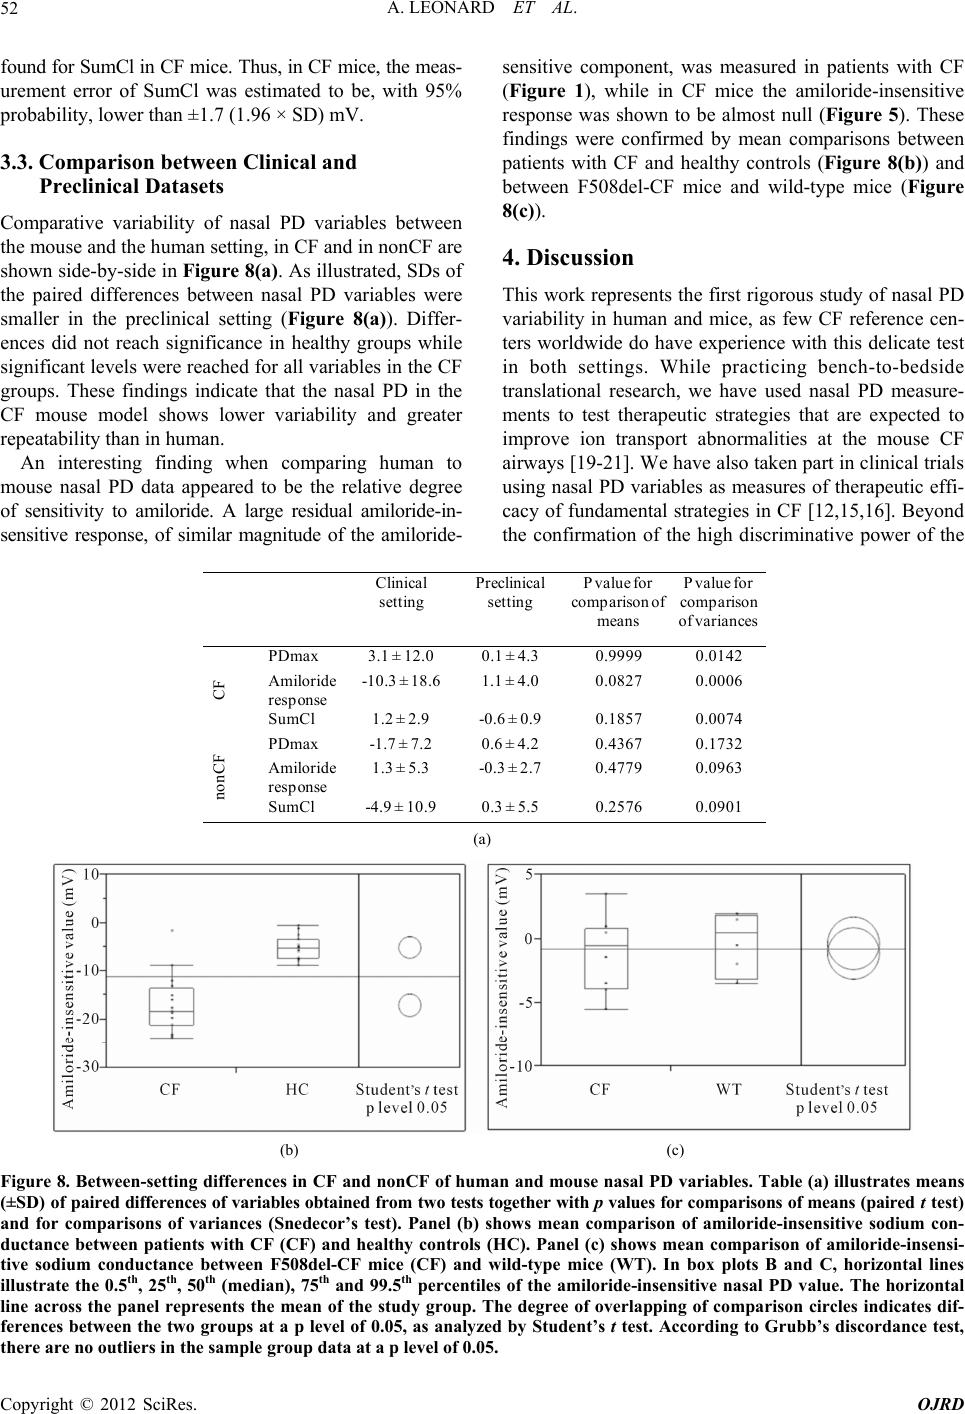 A. LEONARD ET AL. 52 found for SumCl in CF mice. Thus, in CF mice, the meas- urement error of SumCl was estimated to be, with 95% robability, lower than ±1.7 (1.96 sensitive component, was measured in patients with CF (Figure 1), while in CF mice the amiloride-insensitive p× SD) mV. e degree of sensitivity to amiloride. A large residual amiloride-in- amiloride- response was shown to be almost null (Figure 5). These ion transport abnormalities at the mouse CF airways [19-21]. We have also taken part in clinical trials riables as measures of therapeutic effi- 3.3. Comparison between Clinical and Preclinical Datasets Comparative variability of nasal PD variables between the mouse and the human setting, in CF and in nonCF are shown side-by-side in Figure 8(a). As illustrated, SDs of the paired differences between nasal PD variables were smaller in the preclinical setting (Figure 8(a)). Differ- ences did not reach significance in healthy groups while significant levels were reached for all variables in the CF groups. These findings indicate that the nasal PD in the CF mouse model shows lower variability and greater repeatability than in human. An interesting finding when comparing human to mouse nasal PD data appeared to be the relativ sensitive response, of similar magnitude of the findings were confirmed by mean comparisons between patients with CF and healthy controls (Figure 8(b)) and between F508del-CF mice and wild-type mice (Figure 8(c)). 4. Discussion This work represents the first rigorous study of nasal PD variability in human and mice, as few CF reference cen- ters worldwide do have experience with this delicate test in both settings. While practicing bench-to-bedside translational research, we have used nasal PD measure- ments to test therapeutic strategies that are expected to improve using nasal PD va cacy of fundamental strategies in CF [12,15,16]. Beyond the confirmation of the high discriminative power of the A Clinical setting CF PDmax3.1 ± 12.0 Amiloride response -10.3 ±18.6 SumCl1.2 ± 2.9 nCF PDmax-1.7 ± 7.2 Amiloride 1.3 ± 5.3 Pre se 0.1 1.1 -0. no 0.6 response -0. SumCl-4.9 ±10.90.3 ± 5.50.25760.0901 clinical tting P value for comparison of mean s P value for comparison of variances ± 4.30.99990.0142 ± 4.00.08270.0006 6 ± 0.90.18570.0074 ± 4.20.43670.1732 3 ± 2.70.47790.0963 (a) (b) (c) Figure 8. Between-setting differences in CF and nonCF of human and mouse nasal PD variables. Table (a) illustrates means (±S D) o f p aired differences of variables obtained from two tests together with p values for comparisons of means (paired t test) and for comparisons of variances (Snedecor’s test). Panel (b) shows mean comparison of amiloride-insensitive sodium con- ductance between patients with CF (CF) and healthy controls (HC). Panel (c) shows mean comparison of amiloride-insensi- tive sodium conductance between F508del-CF mice (CF) and wild-type mice (WT). In box plots B and C, horizontal lines illustrate the 0.5th, 25th, 50th (median), 75th and 99.5th percentiles of the amiloride-insensitive nasal PD value. The horizontal line across the panel represents the mean of the study group. The degree of overlapping of comparison circles indicates dif- ferences between the two groups at a p level of 0.05, as analyzed by Student’s t test. According to Grubb’s discordance test, there are no outliers in the sample group data at a p level of 0.05. Copyright © 2012 SciRes. OJRD  A. LEONARD ET AL. 53 nasal PD test to adequately differentiate between CF and nonCF in both human and mice, this study was designed to evaluate its comparative variability in the clinical and the preclinical setting. In the former, patients displaying classic CF disease with pancreatic insufficiency, two severe mutations and pathologic sweat test results were tested comparatively to sex-matched healthy subjects. In the latter, the clinically relevant mouse model of CF dis- ease homozygous for the F508del mutation [22] and their normal homozygous littermates were used. Optimized conditions for recording and analyzing nasal PD data were assembled in both settings. ai with our findings, if the difference between SumCl as- sessed under treatment in a given patient is greater, in absolute terms, than 5.7 mV of that recorded under base- line, then one can be 95% certain that the change is too large to be expected by the measurement error alone and a correcting effect of the drug treatment can be suspected. This value is somehow in agreement with the arbitrary cut-off of 5mV that has been used for SumCl in different clinical trials. If applying the estimation to Yaakov’s [31] or to Simmonds’ [32] work, the critical cut-off value should be revised to 8.6 mV, i.e. 1.96 SD (4.4) m [31] SD (7.36) [32]. The fact at in In each setting, tests or to 14.3 mV, i.e. 1.96 were performed by a single qualified operator and trac- ings were double-read by a blind reviewer. In the clinical setting, we used the new standardized equipment and setup, and we followed the standard operating protocol expected to reduce artifact frequency and to favor tracing stability and data reliability [17,28]. The proportion of non interpretable tracings (4/80, 5%) we obtained was in agreement with that previously reported (3% - 10%) [29]. ur data are also in agreement with Solomon’s valida- both studies [31,32] a single nostril was explored could, at least partly, contribute to explain differences with our data. As the repeatability coefficient in mice is lower, when testing a potential CFTR-correcting drug in mice, we could be 95% certain of a drug effect if the change observed in SumCl between two measurements in the same animal should be greater than 2 mV. As a function of larger 95% repeatability coefficients for PDmax and am O tion study [17] showing that the use of nonperfused agar-bridge electrodes is related to more hyperpolarized SumCl values (−24.2 ± 12.9 mV) as compared to those obtained upon using perfused bridges (−18.2 ± 12.9 mV). The assumption of significant cross-nostril amiloride contaminating effect [30] has been raised as argument to explore a single nostril during the test [31,32]. By con- trast, our results showing a good between-nostril corre- spondence rather support the notion that averaging data obtained from both nostrils contribute to strengthen data interpretation and to reduce data variability [33]. Based on the finding that plotted values in Bland- Altman analysis lied inside the 95% limits of agreement, our results would claim for a good reproducibility of na- sal PD measurements. But the question that should be raised here is: is this enough to consider nasal PD as a robust test? In this work, we were concerned with mod- eling a narrow limit of agreement for each nasal PD variable, which would indicate good within-subject re- peatability of the measures. The finding that large 95% repeatability coefficients were globally found indicate a large measurement error, a poor precision and a low within-subject repeatability of nasal PD measurements, particularly in the clinical setting. In human as in mice, the lowest variability was found for chloride secretion in CF pointing out SumCl as the most reliable nasal PD parameter for monitoring between-test changes in the case of therapeutic strategy expected to influence transe- pithelial chloride transport in CF. Accordingly, SumCl has been considered the most sensitive and specific indi- cator of CFTR-dependent ion transport and it has been included as an outcome endpoint in CF clinical trials ming at rescuing CFTR function [6-16]. In agreement iloride response, the expected changes in patients with CF would be greater than 23.5 (1.96 × 12.0) mV and 36.4 (1.96 × 18.6) mV, respectively. The expected cut-off for changes of PDmax and amiloride response in mice would be of similar magnitude and greater than 8.4 mV. We showed here that amiloride response has the larg- est variability in patients while in another work [31], basal PD was considered as the most variable parameter. By the way, it has been well recognized that basal hy- perpolarization and increased amiloride sensitivity both reflect exaggerated ENaC activity in CF. Even though the interplay between CFTR and ENaC is still not com- pletely understood, convincing experimental data sup- porting the role of overactive ENaC function in CF dis- ease have been brought by the development of a mouse model overexpressing the β-subunit of amiloride-sensi- tive ENaC protein [34,35]. Other sodium-coupled trans- port pathways, particularly in human, might contribute to the basal hyperpolarization across the airway epithelium. Indeed, a high fraction of amiloride-insensitive response remained in CF patients, but not in CF mice, suggesting that species-dependent factors may be involved. In mice, V th there is no apparent contribution of the amiloride-insen- sitive conductance as response to amiloride typically reached zero in CF as in non-CF mice. The nature of the amiloride-insensitve sodium conductances involved in the human nose and the possible functional interactions they might have with CFTR could not be determined in the present study. Several factors could potentially contribute to the variability of nasal PD measures, despite the recent ef- forts to standardization and validation of the test in view to reduce artifact frequency and to improve reliability and reproducibility [17,28]. Modifiers genes [36] and Copyright © 2012 SciRes. OJRD  A. LEONARD ET AL. 54 concomitant medications [37-42] have been recognized as potential sources of within-subject variability but they are not well studied. Lower variability was globally found in the mouse model. As in human, CF mice show characteristic transepithelial ion transport abnormalities [19-21,43,44]. The F508del mouse model used in this work represents a valuable tool to study pathophysiology of the disease and to test the efficacy and potential inter- est of new therapeutic strategies. Phenotypic differences in the expression of the disease with more severe gastro- intestinal rather than lung manifestations, absence of concomitant medications, the obvious degree in com- plexity of genomes, together with the fact that the model is e Fonds de la Recherche Scientifique M housed in privileged conditions with sanitary barriers might contribute to explain the lower variability observed in CF mice, particularly in SumCl for which the lowest SD (0.9) of differences between tests was showed. In conclusion, our data demonstrate that, even being underwent under optimized conditions, nasal PD in hu- man and in mice display good reproducibility but limited within-subject repeatability. The lowest measurement error was observed for SumCl confirming, taking into account the size of its measurement error, its place as an outcome endpoint in preclinical and clinical proof-of- concept trials. In practice, a difference between baseline and under treatment SumCl value larger than 5.7 mV in CF patients and 2.0 mV in F508del-CF mice would indi- cate 95% chance of a CFTR improving effect of the treatment tested. 5. Acknowledgements AL is a PhD fellow with support of the Belgian CF As- sociation. BL is a PhD fellow with the Fonds Spéciaux de Recherche (FSR; Université catholique de Louvain). SN is a postdoctoral fellow with the FSR and Marie Curie Actions of the European Commission. TL is an associate researcher with th édicale (FRSM). We thank the patients and subjects who volunteered to undergo the study. We are grateful to Pr Jean Cumps (Bio- statistics Department) for assistance in statistical analyses. Supported by grants of the FRSM, the FSR and the De- partment of Pneumology-Fondation St Luc (St Luc Uni- versity Hospital and Université catholique de Louvain) Authors are indebted Dr BJ Scholte (Erasmus Medical Centre, Rotterdam, The Netherlands) for providing breed- ing pairs of F508del-CF mice. REFERENCES [1] M. Knowles, J. Gatzy and R. Boucher, “Increased Bio- electric Potential Difference across Respiratory Epithelia in Cystic Fibrosis,” The New England Journal of Medi- cine, Vol. 305, No. 25, 1981, pp. 1489-1495. doi:10.1056/NEJM198112173052502 [2] P. G. Middleton, D. M. Geddes and E. F. W. Alton, “Protocols for in Vivo Measurement of the Ion Transport Defects in Cystic Fibrosis Nasal Epithelium,” European Respiratory Journal, Vol. 7, No. 11, 1994, pp. 2050-2056. [3] M. R. Knowles, A. M. Paradiso, R. C. Boucher, “In Vivo Nasal Potential Difference: Techniques and Protocols for Assessing Efficacy of Gene Transfer in Cystic Fibrosis,” Human Gene Therapy, Vol. 6, No. 4, 1995, pp. 445-455. doi:10.1089/hum.1995.6.4-445 [4] K. De Boeck, M. Wilschanski, C. Castellani, C. Taylor, H. Cuppens, J. Dodge and M. Sinaasappel, “Cystic Fibrosis: Terminology and Diagnostic Algorithms,” Thorax, Vol. 61, No. 7, 2006, pp. 627-635. doi:10.1136/thx.2005.043539 [5] P. Lebecque, T. Leal, C. De Boeck, M. Jaspers, H. Cuppens and J. J. Cassiman, “Mutations of the Cystic Fibrosis Gene and Intermediate Sweat Chloride Levels in Chil- dren,” American Journal of Respiratory and Critical Care Medicine, Vol. 165, No. 6, 2002, pp. 757-761. ini, H. Blau, J. Rivlin, A. erem and E. Kerem, “A Pilot Gentamicin Suppresses Premature Stop [6] M. Wilschanski, C. Fam Augarten, A. Avital, B. K Study of the Effect of Gentamicin on Nasal Potential Difference Measurements in CF Patients Carrying Stop Mutations,” American Journal of Respiratory and Cri- tical Care Medicine, Vol. 161, No. 3, 2000, pp. 860-865. [7] J. P. Clancy, Z. Bebök, F. Ruiz, C. King, J. Jones, L. Walker, H. Greer, J. Hong, L. Wing, M. Macaluso, R. Lyrene, E. J. Sorscher and D. M. Bedwell, “Evidence That Systemic Mutations in Patients with CF,” American Journal of Respiratory and Critical Care Medicine, Vol. 163, No. 7, 2001, pp. 1683-1692. [8] M. Wilschanski, Y. Yahav, Y. Yaacov, H. Blau, L. Ben- tur, J. Rivlin, M. Aviram, T. Bdolah-Abram, Z. Bebok, L. Shushi, B. Kerem and E. Kerem, “Gentamicin-Induced Correction of CFTR Function in Patients with CF and CFTR Stop Mutations,” The New England Journal of Medicine, Vol. 349, No. 15, 2003, pp. 1433-1441. doi:10.1056/NEJMoa022170 [9] I. Sermet-Gaudelus, M. Renouil, A. Fajac, L. Bidou, B. Parbaille, S. Puth, P. Reinert, G. Lenoir, J. F. Ld A. Edelman, “In ierrot, N. Davy, E. Bism esure, J. P. Rousset an Vitro Prediction of Stop-Codon Suppression by Intrave- nous Gentamicin in Patients with CF: A Pilot Study,” BMC Medicine, Vol. 5, No. 3, 2007, p. 5. doi:10.1186/1741-7015-5-5 [10] J. P. Clancy, S. M. Rowe, Z. Bebok, M. L. Aitken, R. Gibson, P. Zeitlin, P. Berclaz, R. Moss, M. R. Knowles, R. A. Oster, N. Mayer-Hamblett and B. Ramsey, “No Detectable Improvements in CF Transmembrane Con- ductance Regulator by Nasal Aminoglycosides in Patients with CF with Stop Mutations,” American Journal of Res- piratory Cell and Molecular Biology, Vol. 37, No. 1, 2007, pp. 57-66. doi:10.1165/rcmb.2006-0173OC [11] E. Kerem, S. Hirawat, S. Armoni, Y. Yaakov, D. Shoseyov, M. Cohen, M. Nissim-Rafinia, H. Blau, J. Rivlin, M. Aviram, G. L. Elfring, V. J. Northcutt, L. L. Miller, B. Kerem and M. Wilschanski, “Effectiveness of PTC124 Treatment of CF Caused by Nonsense Mutations: A Pro- spective Phase II Trial,” The Lancet, Vol. 372, No. 9640, Copyright © 2012 SciRes. OJRD  A. LEONARD ET AL. 55 2008, pp. 719-727. doi:10.1016/S0140-6736(08)61168-X eck, G. J. Casimir, F. Ver- with [12] I. Sermet-Gaudelus, K. D. Bo meulen, T. Leal, A. Mogenet, D. Roussel, J. Fritsch, L. Hanssens, S. Hirawat, N. L. Miller, S. Constantine, A. Reha, T. Ajayi, G. L. Elfring and L. L. Miller, “Ataluren (PTC124) Induces CF Transmembrane Conductance Regu- lator Protein Expression and Activity in Children Nonsense Mutation CF,” American Journal of Respira- tory and Critical Care Medicine, Vol. 182, No. 10, 2010, pp. 1262-1272. doi:10.1164/rccm.201001-0137OC [13] F. J. Accurso, S. M. Rowe, J. P. Clancy, M. P. Boyle, J. M. Dunitz, P. R. Durie, S. D. Sagel, D. B. Hornick, M. W. Konstan, S. H. Donaldson, R. B. Moss, J. M. Pilewski, R. C. Rubenstein, A. Z. Uluer, M. L. Aitken, S. D. Freedman, L. M. Rose, N. Mayer-Hamblett, Q. Dong, J. Zha, A. J. Stone, E. R. Olson, C. L. Ordoñez, P. W. Campbell, M. A. Ashlock and B. W. Ramsey, “Effect of VX-770 in Per- sons with CF and the G551D-CFTR Mutation,” The New England Journal of Medicine, Vol. 363, No. 21, 2010, pp. 1991-2003. doi:10.1056/NEJMoa0909825 [14] M. Wilschanski, L. L. Miller, D. Shoseyov, H. Blau, J. Rivlin, M. Aviram, M. Cohen, S. Armoni, Y. Yaakov, T. Pugatch, M. Cohen-Cymberknoh, N. L. Miller, A. Reha, V. J. Northcutt, S. Hirawat, K. Donnelly, G. L. Elfring, T. Ajayi and E. Kerem, “Chronic Ataluren (PTC124) Treat- ment of Nonsense Mutation CF,” European Respiratory Journal, Vol. 38, No. 1, 2011, pp. 59-69. doi:10.1183/09031936.00120910 [15] J. P. Clancy, S. M. Rowe, F. J. Accurso, M. L. Aitken, R. S. Amin, M. A. Ashlock, M. Ballmann, M. P. Boyle, I. Bronsveld, P. W. Campbell, K. De Boeck, S. H. Donaldson, H. L. Dorkin, J. M. Dunitz, P. R. Durie, M. Jain, A. Leonard, K. S. McCoy, R. B. Moss, J. M. Pilewski, D. B. Rosenbluth, R. C. Rubenstein, M. S. Schechter, M. Botfield, C. L. Ordoñez, G. T. Spencer-Green, L. Vernillet, S. Wisseh, K. Yen and M. W. Konstan, “Results of a Phase IIa Study of VX-809, an Investigational CFTR Corrector Compound, in Subjects with Cystic Fibrosis Homozygous for the F508del-CFTR Mutation,” Thorax, Vol. 67, No. 1, 2012, pp. 12-18. doi:10.1136/thoraxjnl-2011-200393 [16] A. Leonard, P. Lebecque and T. Leal, “A Randomized Placebo-Controlled Trial of Miglustat in Cystic Fibrosis Based on Nasal Potential Difference,” Journal of Cystic Fibrosis, 2012, in press. [17] G. M. Solomon, M. W. Konstan, M. Wilschanski, J. Bill- ings, I. Sermet, F. Accurso, F. Vermeulen, E. Levin, H. Hathorne, G. Reeves, G. Sabbatini, A. Hill, N. Mayer- Hamblett, M. Ashlock, J. P. Clancy and S. M. Rowe, “An International Randomized Multicenter Comparison of Nasal Potential Difference Techniques,” Chest, Vol. 1384, No. 4, 2010, pp. 919-928. doi:10.1378/chest.10-0179 [18] T. Leal, J. Lebacq, R. Vanbinst, Ch Lederman, M. De Kock and P. Wallemacq, “Successful Protocol of Anaes- thesia for Measuring Transepithelial Nasal Potential Dif- ference in Spontaneously Breathing Mice,” Laboratory Animals, Vol. 40, No. 1, 2006, pp. 43-52. doi:10.1258/002367706775404480 [19] B. Lubamba, H. Lecourt, J. Lebacq, P. Lebecque, H. De that Sildenafil and Vardenafil Activate Chloride Jonge, P. Wallemacq and T. Leal, “Preclinical Evidence port in Cystic Fibrosis,” American Journal of Respiratory and Critical Care Medicine, Vol. 177, No. 5, 2008, pp. 506-515. Trans- doi:10.1164/rccm.200703-344OC [20] B. Lubamba, J. Lebacq, P. Lebecque, R. Vanbever, A. Leonard, P. Wallemacq and T. Leal, “Airway Delivery of Low-Dose Miglustat Normalizes Nasal Potential Differ- ence in F508del Cystic Fibrosis Mice,” American Journal of Respiratory and Critical Care Medicine, Vol. 179, No. 11, 2009, pp. 1022-1028. doi:10.1164/rccm.200901-0049OC [21] B. Lubamba, J. Lebacq, G. Reychler, E. Marbaix, P. Wal- lemacq, P. Lebecque and T. Leal, “Inhaled PDE5 Inhibi- tors Restore Chloride Transport in Cystic Fibrosis Mice,” European Respiratory Journal, Vol. 37, No. 1, 2011, pp. 72-78. doi:10.1183/09031936.00013510 [22] J. H. van Doorninck, P. J. French, E. Verbeek, R. H. 1983, pp. ulations,” European Respiratory Peters, H. Morreau, J. Bijman and B. J. Scholte, “A Mouse Model for the Cystic Fibrosis Delta F508 Muta- tion,” The EMBO Journal, Vol. 14, No. 18, 1995, pp. 4403-4411. [23] L. E. Gibson and R. E. Cooke, “A Test for Concentration of Electrolytes in Sweat in Cystic Fibrosis of the Pancreas Utilizing Pilocarpine by Iontophoresis,” Pediatrics, Vol. 23, No. 3, 1959, pp. 545-549. [24] R. J. Knudson, M. D. Lebowitz, C. J. Holberg and B. Bur- rows, “Changes in the Normal Maximal Expiratory Flow- Volume Curve with Growth and Aging,” The American Review of Respiratory Disease, Vol. 127, No. 6, 725-734. [25] X. Pepermans, M. Philippe and T. Leal, “New Molecular Screening Assay for Increased Detection Rate of CFTR Mutations in European Pop Disease, Vol. 6, No. 1, 2010, pp. 62-65. [26] W. Nicklas, P. Baneux, R. Boot, T. Decelle, A. A. Deeny, M. Fumanelli and B. Illgen-Wilcke, “Recommendations for the Health Monitoring of Rodent and Rabbit Colonies in Breeding and Experimental Units,” Laboratory Animals, Vol. 36, No. 1, 2002, pp. 20-42. doi:10.1258/0023677021911740 [27] J. M. Bland and D. G. Altman, “Statistical Methods for Assessing Agreement between Two Methods of Clinical Measurement,” The Lancet, Vol. 327, No. 8476, 1986, pp. 307-310. doi:10.1016/S0140-6736(86)90837-8 [28] S. M. Rowe, J. P. Clancy and M. Wilsch Potential Difference Measurements anski, “Nasal to Assess CFTR Ion Channel Activity,” Methods in Molecular Biology, Vol. 741, No. 1, 2011, pp. 69-86. doi:10.1007/978-1-61779-117-8_6 [29] F. Vermeulen, M. Proesmans, N. Feyaerts and K. De Boeck, “Nasal Potential Measurements on the Nasal Floor and under the Inferior Turbinate: Does It Matter?” Pedi- atric Pulmonology, Vol. 46, No. 2, 2011, pp. 145-152. doi:10.1002/ppul.21333 [30] G. M. Solomon, H. R. Young, G. Reeves, R. A. Oster, L. Fan, J. P. Clancy and S. M. Rowe, “Comparison of Com- monly Employed Nasal Potential Difference Techniques in Human Subjects,” Pediat S30, 2007, p. 248. ric Pulmonology, Vol. 42, No. [31] Y. Yaakov, E. Kerem, Y. Yahav, J. Rivlin, H. Blau, L. Copyright © 2012 SciRes. OJRD  A. LEONARD ET AL. Copyright © 2012 SciRes. OJRD 56 Bentur, M. Aviram, E. Picard, T. Bdolah-Abram and M. Wilschanski, “Reproducibility of Nasal Potential Differ- ence Measurements in CF,” Chest, Vol. 132, No. 4, 2007, pp. 1219-1226. doi:10.1378/chest.06-2975 31936.00079010 [32] N. Simmonds, L. D’Souza, M. Roughton, E. Alton, J. C. Davies and M. E. Hodson, “CF and Survival to 40 Years: A Study of CFTR Function,” European Respiratory Journal, Vol. 37, No. 5, 2011, pp. 1076-1082. doi:10.1183/090 ystic Fibrosis Transm [33] J. P. Clancy, S. M. Rowe, Z. Bebok, M. L. Aitken, R. Gibson, P. Zeitlin, P. Berclaz, R. Moss, M. R. Knowles, R. A. Oster, N. Mayer-Hamblett and B. Ramsey, “No Detectable Improvements in Cem- brane Conductance Regulator by Nasal Aminoglycosides in Patients with Cystic Fibrosis with Stop Mutations,” American Journal of Respiratory Cell and Molecular Bi- ology, Vol. 37, No. 1, 2007, pp. 57-66. doi:10.1165/rcmb.2006-0173OC [34] M. Mall, B. R. Grubb, J. R. Harkema, W. K. O’Neal and R. C. Boucher, “Increased Airway Epithelial Na+ Absorp- tion Produces Cystic Fibrosis-Like Lung Disease in Mice,” Nature Medicine, Vol. 10, No. 5, 2004, pp. 487-493. doi:10.1038/nm1028 [35] Z. Zhou, D. Treis, S. C. Schubert, M. Harm, J. Schattemy, S. Hirtz, J. Duerr, R. C. Boucher and M. A. Mall, “Pre- centive but Not Late Amiloride Therapy Reduces Mor- bidity and Mortality of Lung Dise pressing Mice,” American Journal ase in βENaC-Overex- of Respiratory and Critical Care Medicine, Vol. 178, No. 12, 2008, pp. 1245-1256. doi:10.1164/rccm.200803-442OC [36] G. R. Cutting, “Modifier Genes in Mendelian Disorders: The Example of Cystic Fibrosis,” Annals of the New York Academy Sciences, Vol. 1214, 2010, pp. 57-69. doi:10.1111/j.1749-6632.2010.05879.x [37] S. M. Graham, S. N. Scott, J. Launspach and J. Zabner, “The Effects of Fluticasone P lial Potential Difference,” American ropionate on Nasal Epithe- Journal of Rhinology , Vol. 16, No. 3, 2002, pp. 145-149. [38] P. M. Barker, D. J. Gillie, M. S. Schechter and B. K. Rubin, “Effect of Macrolides on in Vivo Ion Transport across CF Nasal Epithelium,” American Journal of Res- piratory and Critical Care Medicine, Vol. 171, No. 8, 2005, pp. 868-871. doi:10.1164/rccm.200311-1508OC [39] I. Oliynyk, G. Varelogianni, M. Schalling, M. S. Asplund, G. M. Roomans and M. Johannesson, “A creases Chloride Efflux from zithromycin In- CF Airway Epithelial Cells,” Experimental Lung Research, Vol. 35, No. 3, 2009, pp. 210-221. doi:10.1080/01902140802534967 [40] F. Delavoie, M. Molinari, M. Milliot, J. M. Zahm, C. Coraux, J. Michel and G. Balossier, “Salmeterol Restores Secretory Functions in CF Airway Submucosal Gland Serous Cells,” American Journal of Respiratory and Cell Molecular Biology, Vol. 40, No. 4, 2009, pp. 388-397. doi:10.1165/rcmb.2008-0037OC [41] J. M. Zahm, F. Delavoie, F. Toumi, B. Nawrocki-Raby, C Kileztky, J. Michel, G. Balossier, M. Johnson, C. Coraux and P. Birembaut, “Long Acting β2-Agonist and Corticos- teroid Restore Airway Glandular Cell Function Altered by Bacterial Supernatant,” Respiratory Research, Vol. 11, No. 1, 2010, p. 16. doi:10.1186/1465-9921-11-6 [42] M. Köttgen, A. E. Busch, M. J. Hug, R. Greger Kunzelmann, “N-Acetyl-L-Cysteine an and K. d Its Derivatives Activate a Cl-Conductance in Epithelial Cells,” Pflugers Archiv European Journal of Physiology, Vol. 431, No. 4, 1996, pp. 549-555. doi:10.1007/BF02191902 [43] T. Leal, J. Lebacq, P. Lebecque, J. Cumps and P. Walle- macq, “Modified Method to Measure Nasal Potential Difference,” Clinical Chemistry and Laboratory Medicine, Vol. 41, No. 1, 2003, pp. 61-67. doi:10.1515/CCLM.2003.011 [44] T. Leal, I. Fajac, H. L. Wallace, P. Lebecque, J. Lebacq, D. Hubert, J. Dall’Ava, D. Dusser, A. P. Ganesan, C. Knoop, J. Cumps, P. Wallemacq and K. W. Southern, “Airway Ion Transport Impacts on Disease Presentation and Severity in Cystic Fibrosis,” Clinical Biochemiatry, Vol. 41, No. 10-11, 2008, pp. 764-772. doi:10.1016/j.clinbiochem.2008.03.013
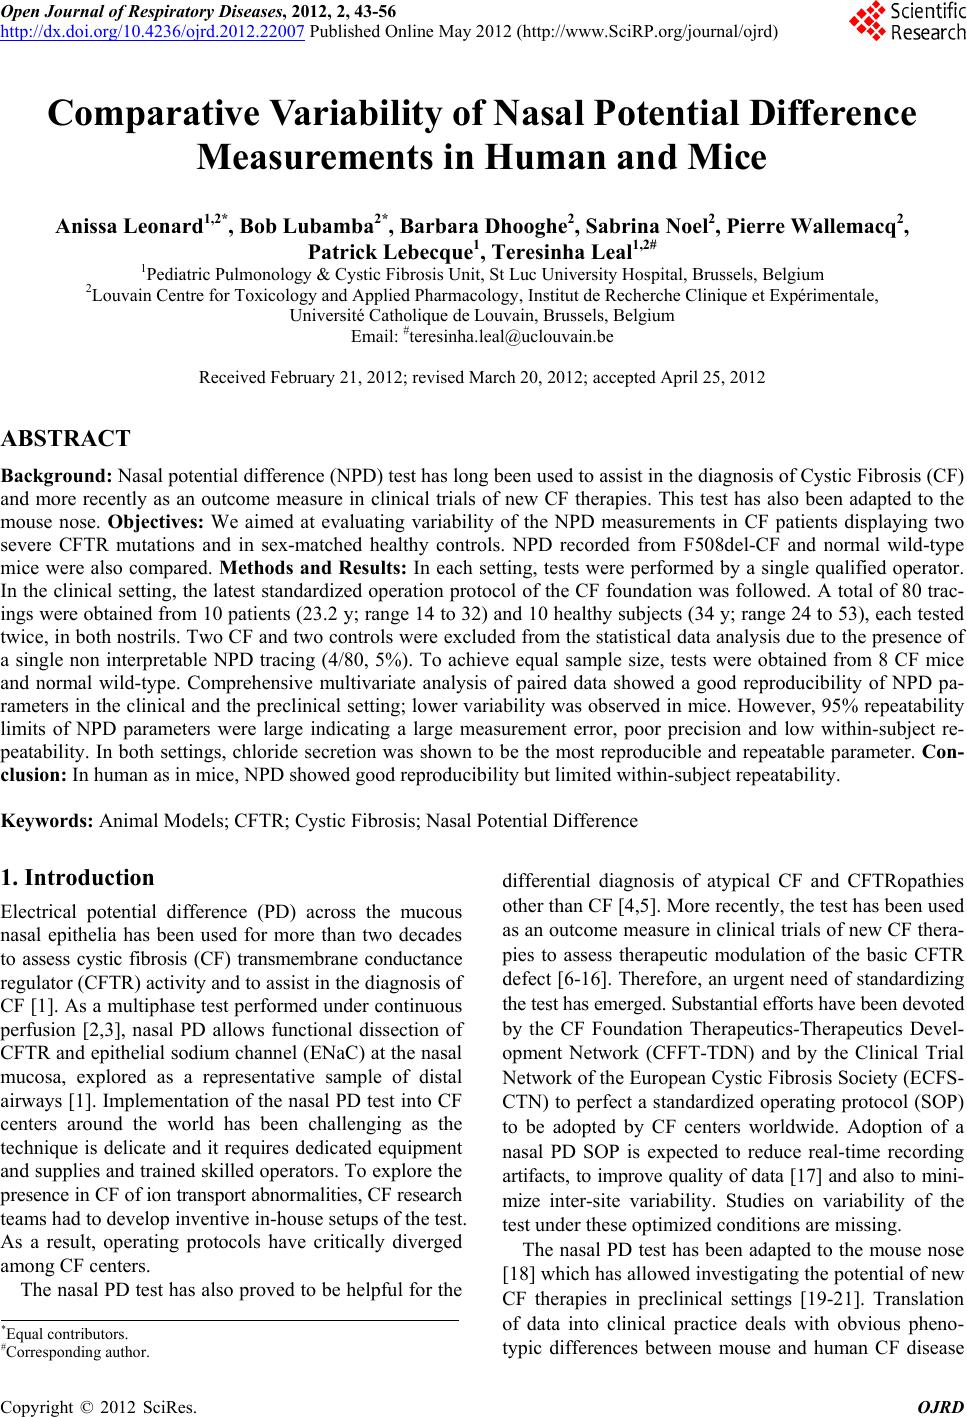
|