Journal of Biomedical Science and Engineering
Vol. 5 No. 12A (2012) , Article ID: 26283 , 9 pages DOI:10.4236/jbise.2012.512A113
Raman spectroscopy for human cancer tissue diagnosis: A pattern recognition approach
![]()
1Department of Electrical and Computer Engineering, Indiana University-Purdue University Indianapolis (IUPUI), Indianapolis, USA
2Department of Electrical and Computer Engineering and Integrated Nanosystems Development Institute (INDI), Indiana UniversityPurdue University Indianapolis IUPUI, Indianapolis, USA
Email: mrizkall@ iupui.edu, pghane@iupui.edu, agarwal@iupui.edu, sudshres@iupui.edu, kvarahra@iupui.edu
Received 13 September 2012; revised 17 October 2012; accepted 19 December 2012
Keywords: Cancer; Tissues; Raman Spectroscopy; Pattern Recognition
ABSTRACT
In this work, optical scattering using Raman spectroscopy has been analyzed for various cancer tissues. The Raman shifts obtained at the Indiana University Bloomington (IUB) and Indiana University-Purdue University Indianapolis (IUPUI) laboratories have been processed for diagnosing various types of cancer tissues. The objective of this research is to distinguish between cancerous and non-cancerous tissues. Small size tissue samples have been processed, seeking the minimum size tissue that can be diagnosed via Raman spectroscopy. The tests have been conducted on nearly 20 human tissues. A Matlab program has been written following Parzen-Window classifier to recognize the Raman shift pattern for various types of cancer tissues, including breast cancer, kidney, and Gyn-Uterus. A software visual model has been used for data processing. Unique signals for breast and kidney tumors have been obtained. The approach followed in this paper shows promise for early cancer detection in humans.
1. INTRODUCTION
Cancer is a serious disease that threatens human life due to the nonpathogenic existence of the illness, and this makes it difficult to control its progress if it reaches late stages. Early diagnosis however may lead to effective treatment and better survival chance. Non-invasive technique is advantageous for patient safety. The vibration/scattering spectrum has promising potential as an analytical tool for diagnosis. This could be attributed to the detection of the chemical composition and molecular structure of matters. Raman spectroscopy is a tool that is used in determining the molecular characteristics of various matters, including chemical bonds, and molecular and physiochemical structure. This is based on light scattering characteristics with matters. The structure of molecules can be determined via their rotations, vibrations, and transmissions when an incident laser power is applied. The frequency difference between the incident and scattered radiation is employed in the diagnosis. This technique is well established for non-invasive medical diagnosis of cancer tissues [1-5]. Current technique of Raman Spectroscopy is able to detect microparticles at a maximum depth of 5 mm [6]. This still falls short by far as compared to tissue depth of 20 to 50 mm that mammography screening protocol can detect [7]. However, the current Raman is an external vivo diagnosis, while mammography is vivo, future laser diodes may produce Raman shifts for in vivo applications which could be competitive with mammography. In diagnosing breast cancer tissues, near 80% of the tumors detected by mammography prove to be benign upon biopsy, an invasive diagnostic procedure which may add to the unnecessary cost of the diagnosis. Raman spectroscopy could be advantageous in providing reliable results by distinguishing between benign and malignant tumors. Researchers have investigated reliable means for non-invasive diagnostic tools, debating between mammography and Raman spectroscopy. Near infrared wavelengths, Raman spectroscopy has the potential to perform real-time diagnosis of a tissue [8]. Developing computer models that emulate real tissues are challenging due to non-homogeneity that make it hard to develop a reliable computer model for research study purposes. Throughout research studies, issues related to minimum size tissues, maximum depth, and safety are of general concern.
The goal of the proposed method is to decide whether a tissue sample is cancerous or not. This is achieved by initially identifying and extracting peaks from the Raman Spectrum of the training data, both cancerous and normal tissue, as well as from the tissue sample under investigation. The locations of the peaks as well as the average of the spectral density within a window centered at each peak are used as feature vectors that are analyzed by a classifier. The classifier, which is based on the Parzen windowing method, identifies whether a tissue sample is cancerous or not by determining the number of feature vectors from each class of tissue, normal or cancerous, that fall within a window centered at the feature vector corresponding to the tissue sample under investigation. The number of vectors belonging to each class are used as an estimate of the likelihood that the tissue sample under investigation belongs to a particular class.
2. PATTERN RECOGNITION APPROACH
Pattern recognition in medical diagnosis has been used extensively [9-11] for detecting pattern classification of X-ray computed tomography (CT) images CAT, MRI, Ultrasound, heart models, and brain models, where CAD tools were utilized to detect image features of various modalities. In recent years, many solutions to medical diagnostic image fusion have been proposed; however, the difficulty of simulating the surgical ability of image fusion, when algorithms of image processing are complex and slow, has been a source of challenge. Efforts of using wavelet neural network to simulate the processes of image recognition, and understanding its implementation in the human vision system were proposed [12]. Results of the effectiveness of the proposed model are subject to image fusion methods that are used for diagnosis. In some cases, multiple cancer tissues are to be detected in the same area. Several examples may include combination of calcification, benign tissues, and cancerous tissues. Researchers have applied various image processing techniques to investigate the type of cancers before surgical operations. Algorithms have shown high level of sensitivity for the validation of data. A reliable approach that distinguishes between various types of tissues located at the vicinity of millimeters is a challenge. A novel approach is developed in this work to distinguish the Raman pattern of various tissues. Figures 1 and 2 give an approach for the software used for diagnosis, using various Raman patterns for the various tissue samples. The approach proposed here is a reverse engineering approach, where data pattern for various cancer types can be recognized and displayed.
3. MATHEMATICAL MODELING
When laser beam hits a sample, it interacts with the molecular vibration and rotation, causing a shift in the reflected beam energy. Therefore the Raman shifts is the difference between the frequency of the excitation and the scattered radiation beams. Raman shift is usually reported as a wave number (cm−1), given by Eq.1.
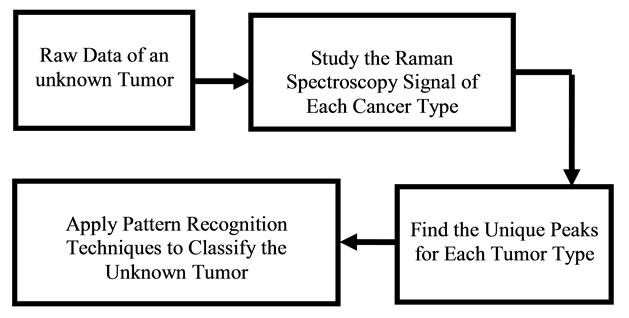
Figure 1. Diagram showing the reverse engineering concept for optical diagnosis.
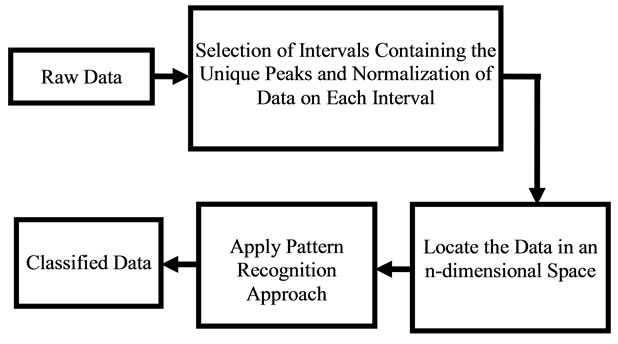
Figure 2. Diagram showing the software approach for pattern recognition.
 (1)
(1)
where  is the Raman shift,
  is the excitation wavelength of the scattered signal, and
  is the Raman spectrum wavelength. Since Raman Spectroscopy uses low energy beam, it could be considered as a safe instrument for medical applications.
The objective of this research is to find an approach for diagnosis of cancerous tissues based on their Raman Spectrum signal. To achieve this goal, we first need to introduce a suitable mathematical classifier. Mathematical model classifiers will help classify some unknown data in one of the known categories. A simple representation of classifier’s operation as a block box is shown in Figure 3. A classifier operation relates to the objects and the classes using a determined function called classifier operation function. Primary, the inputs are random variables which are not fully classified and therefore, a value of uncertainty is defined for input vectors. The best classifier is defined as the classifier which will produce the smallest amount of non-classifications in practice.
The three main types of classification modeling approaches are considered as Fixed Modeling, Parametric Modeling, and Non-parametric Modeling. Nonparametric Modeling assumes that the space is infinite and is typically considered when the relationship between the input and output is not completely recog-
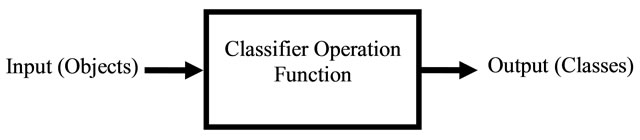
Figure 3. General view of the classifier operation.
nized. The Parzen Windows classification is a non-parametric modeling approach that was developed for estimating the nonparametric probability density function (PDF) of random variables. It has a wide range of applications including image processing, image restoration, and pattern recognition. By using the kernel functions at each observation, Parzen Window estimates the PDF of the group from which the sample was derived. In this research, the Parzen Windows classification is selected as the main method of classification based on the nature of the non-parametric data from the results. The operation of Parzen-Window method is based on making a window with a specific edge length around the testing data point and watching how many data points of the training data would fall into this window, or how much each point in a specific class contributes to the PDF estimation. Adding these contributions for each class results in the PDF of the testing data associated with that specific class. The PDF estimated from Parzen-Window [13] can be calculated from Eq.2.
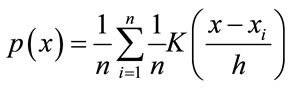 (2)
(2)
where h is the length of hypercube’s width and K is the kernel function in the d-dimensional space such that
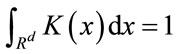 (3)
(3)
The Parzen Window PDF estimate P(x) with the Gaussian kernel becomes
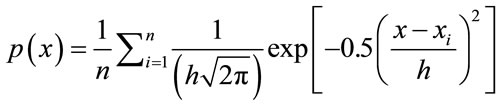 (4)
(4)
In this case, h would be the standard deviation of the Gaussian PDF along each dimension.
There are other approaches such as K Nearest Neighbors (KNN) which could be used for a Non-parametric modeling. The main advantages of the Non-parametric approach are that in the case of having enough number of samples, the wanted target density can be approached. Also for different types of modals, this approach can be used and there is no need to have an initial distribution. In this study, PW was chosen due to its larger rate of the classification accuracy and less sensitivity to the bandwidth as compared to KNN.
4. RESULTS AND DISCUSSIONS
Near 20 cancer samples were provided from the Pathology Department, IU School of Medicine to assist with this research. Appendix A presents a sample data with the information provided by the pathology department. Figure 4 shows an overview of the processes that were done on the raw signal data to classify them in the right classes of Tumors and Quarts.
In order to compare the Raman data between samples, classification approach was used. The raw data had to be normalized. Since the classification of the data would be based on the location of these peaks, normalization had to be in a way that would not alter any peaks or valleys. The normalization process that was used in this work was to keep peaks of each signal as maximum values and distinguish them from other signals. The first step of normalization was to deduce each signal’s DC amount. DC value of the raw data was in a wide range of 101 to 105. This value was simply calculated by taking the average of the signal by the Eq.5.
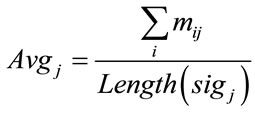 (5)
(5)
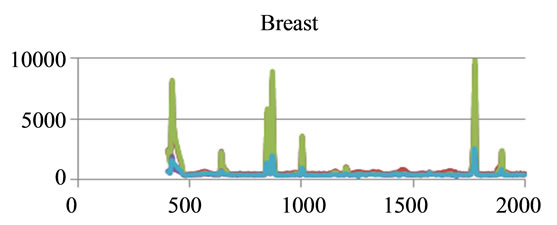
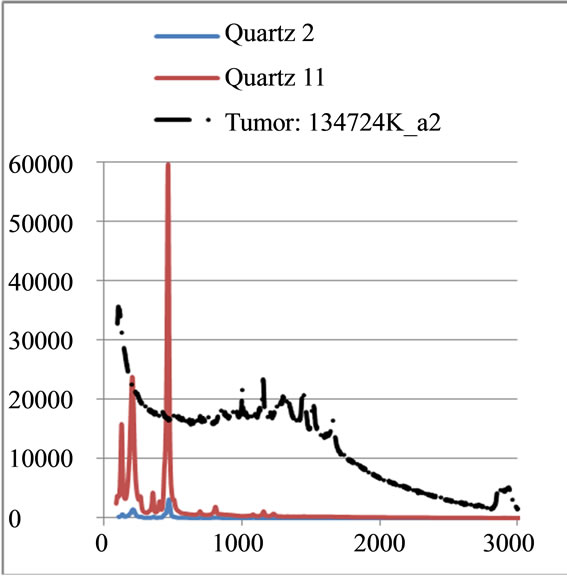
where sigj is the jth signal, Avgj is its average, and mij is the ith frequency of the jth signal. By deducing this value from sigj, the magnitude of all signals will change around zero. Since the peaks were sharp and happen in a few range of frequencies, most of the negative parts of the new signal had absolute values less than the magnitude of the highest peak. In order to make the scales of the signals comparable to each other, the maximum value of the signal (maxj) was selected and the values received in the previous step were divided by that maximum value. This resulted in a signal that was changing between +1 to −1. Figure 5 shows Raman spectroscopy for various cancer tissue samples that were processed and analyzed by the pattern recognition software. The normal tissue data was reported elsewhere [14] and is used here for reference. As shown in Figure 6 shows an overview of this normalization process, and Figure 7 gives an example of some sample signals that were normalized by this method.
Although this procedure made all the signals to change around zero and less than 1, only the highest peaks were still observable after normalization. Applying this process to the entire range of the signal’s frequency, one may find that some small unique peaks were still recognized as unique peaks within the class. Therefore, signals of each class were observed to detect all minor and major unique peak locations. The unique peak detec0 tion was done by comparing the average data of classes with each other. A number of peaks that had the most value difference between the classes were selected. Then, for each peak frequency, a range of frequency that would include its locations was selected and the normalization
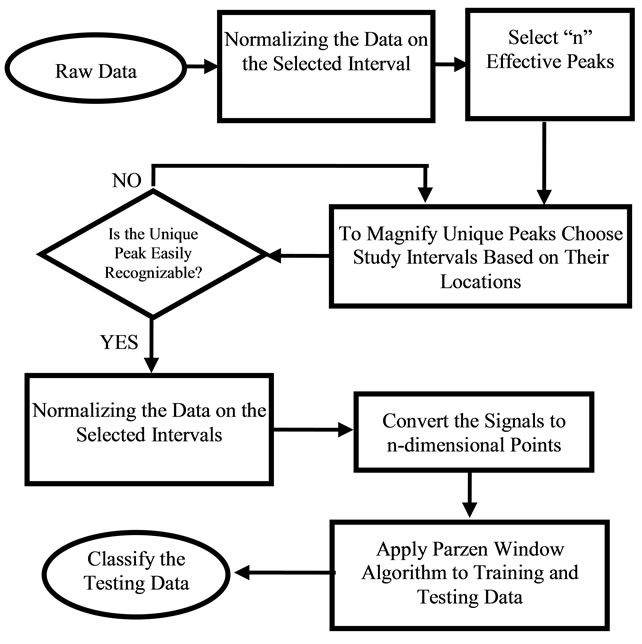
Figure 4. Flowchart of the software algorithm.
process was applied to each range. This resulted in the study of k ranges of frequencies for each signal.
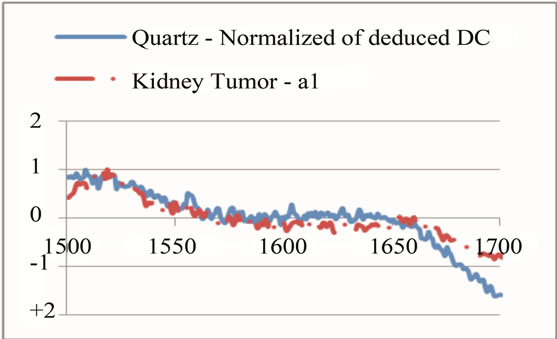
Selection of each frequency range had to be in the way that could keep the goal of range division, which was to magnify the unique peaks. Therefore, a sharp change at the neighbor of a unique peak could affect the overall average and shift the peak down. This is more effective when there are some other peaks at the neighbor that have magnitude higher than the studying unique peak. Therefore, if there was a unique peak next to some high value, the range selection had to be modified in a way that it could skip the high value neighbor and set the peak as the maximum value in that range. On the other hand, the range had to have enough points to indicate that the peak was wide enough to rely on through the comparison with its neighbor. Figure 8 shows an example of such modification for a unique peak for tumor around the frequency of 1660 cm−1. Several steps were done to find the best intervals that include unique peaks; initially, the overall frequency range was divided to intervals of 500. This range helped to have a better selection of unique peaks. Later intervals of 200 were studied to accept or reject the selected peaks as unique. At the end, each peak was studied on a specific range independent from other ranges to magnify its contained peak in the most effective way. The upper left part of Figure 7 indicates the last step of interval selection for a unique peak around 1660 cm−1.
Although the highest value of each peak usually occurs on a single frequency point, this single frequency of the data was not exactly the same among all the signals within a class. For example, one signal might have ten points between frequencies of 500 to 504 cm−1,
 (a)
(a)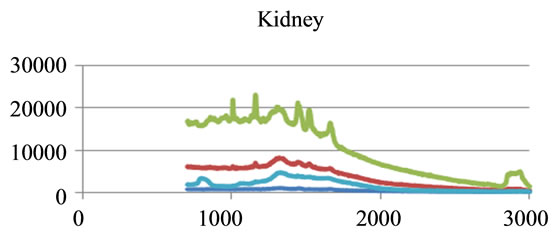 (b)
(b)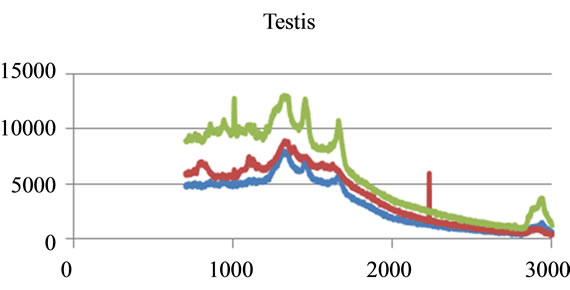 (c)
(c)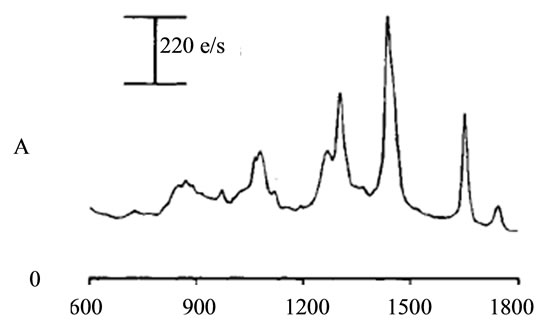 (d)
(d)
Figure 5. Raman Spectroscopy for different cancer tissue samples: (a) Breast; (b) Kidney; (c) Testis; and (d) Normal breast tissue.
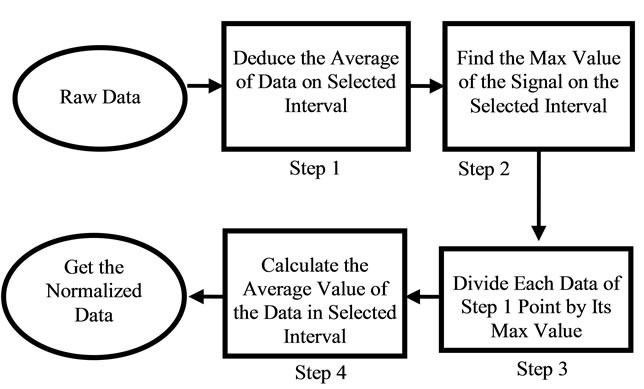
Figure 6. Flow chart of the normalization process.
 (a)
(a)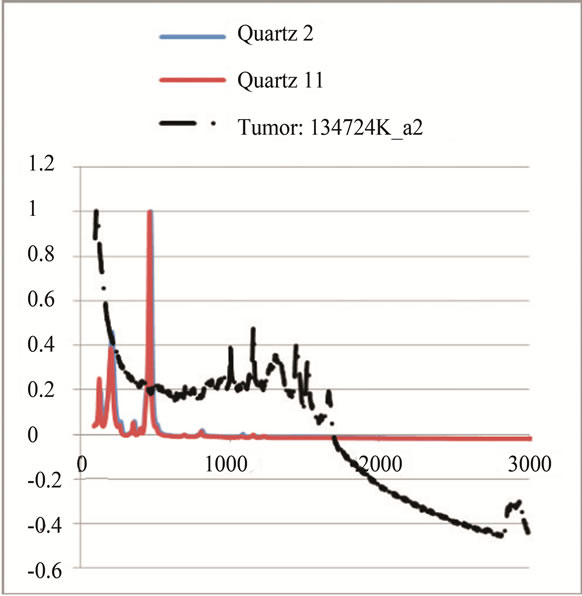 (b)
(b)
Figure 7. Raman Spectroscopy results (a) before and (b) after the normalization.
while another had just four. Therefore a small interval was selected for identifying each unique peak, rather than choosing a single point. For example, if the frequency 1660 cm−1 was selected as a unique peak, the points between 1660 − δ and 1660 + δ had to be selected and studied. The study of each peak was based on the average of signal’s magnitude on a frequency range of 2δ (identified as PKAvgVal, centered at the preselected unique peak’s frequency. The selection of δ was also critical. On one hand, it had to be some value that could include more than two points to give more accuracy; on the other hand, it had to be not too large to make a range wider than the peak’s width, causing a decrease in the overall value of the peak. The value that was selected in this work was smaller or equal to the width of half magnitude of the smallest unique peak (2.5 frequency units).
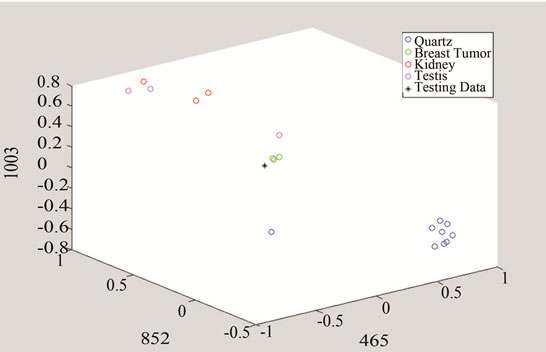
In the next step, each signal was converted to an n-dimensional point, where n indicates the number of unique peaks. The frequency of each peak was selected as a dimension and the magnitude of each signal’s PKAvgVal was selected as the value of the according point with respect to that dimension. As an example, in the last part of Figure 8, if the frequency of 1660 cm−1 is selected as a unique peak, it represents one of the dimensions in n-dimensional space of peaks. It is clear from that figure that the PKAvgVal of the Quarts signal in this dimension would be around zero, while the PKAvgVal of Kidney Tumor would be around 1. The classification of the data was done by studying the location of training classes’ points on n-dimensional space. Figure 9 shows an example of such points when n equals 3.
In this work, two sets of peaks were chosen, one for detecting tumors over quarts and the other for distinguishing breast cancer tumor from other studied types. The first set included frequencies of 465, 853, 1003, and 1657 cm−1 and the second set had the frequencies of 420.3, 640.5, and 1778.5 cm−1. It should be noted that if the selected unique peak does not show enough difference between classes including this peak might increase the classification error because including such a peak will make the points of the classes to get closer to each other in that dimension and reduce the overall distances compared to the Parzen Window length.
Parzen Window Classifier was used to classify a testing data by converting it to an n-dimensional point (Figure 10). In order to show the accuracy of this method, the Parzen Window was applied on each single signal of either Quarts or Tumor class. Three hypercube edge lengths (h) of 2, 1, and 0.5 were selected for Parzen window. Table 1 shows the average difference between the calculated PDF of the signals with respect to the right and wrong class for truly detected signals. Although this table shows that the smaller h the higher difference in the probabilities to be achieved, decreasing h however may not be desirable. Suppose there is a point that should be classified in class B. If this point is close to some points of class A, decreasing h will ensure more that this data should be classified in class A, which is not right.
To show an example of how much adding a “unique peak” could affect the overall result, two cases of including a peak at frequency of 465 cm−1 and excluding it were studied (Table 2). The increase of the accuracy of tumor detection with including this peak indicates that the tumor signals have very close PkAvgVal and different from quarts signal PkAvgVal at this dimension. Likewise, the decrease of the accuracy of Quarts detection indicates that the Quarts signals are spread on this dimension and some are closer to the Tumor than the
 (a)
(a)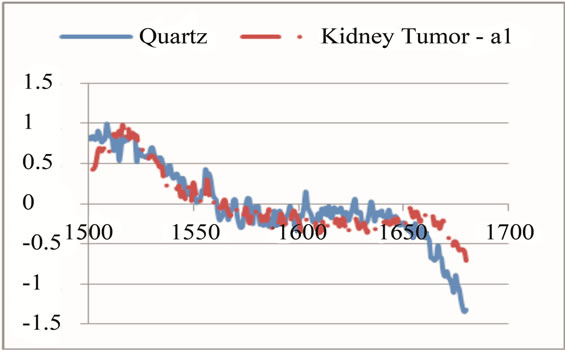 (b)
(b)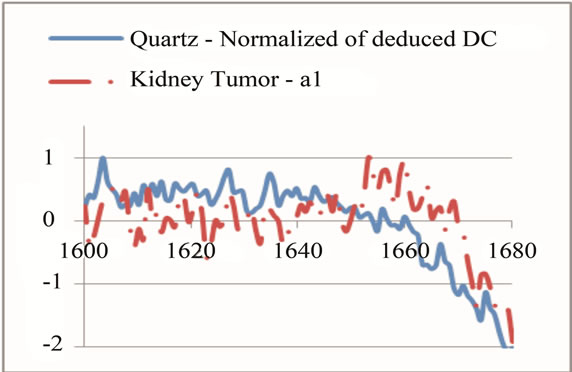 (c)
(c)
Figure 8. An example of selecting and modifying a range to magnify a peak at 1660 cm−1 as a unique peak for tumor. (a) shows first selection of the range; (b) shows eliminating some parts of sharp change before frequency of 1700 cm−1; (c) shows eliminating the neighbor points with values higher than the unique peak.
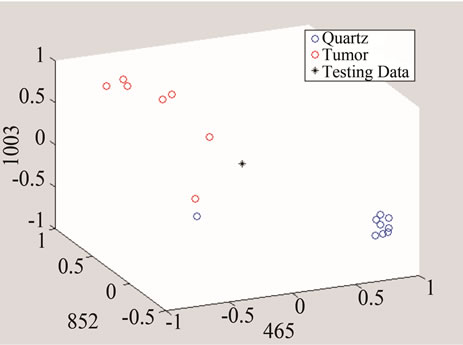
Figure 9. An example of converting the signals to n-dimentional points when n = 3.
 (a)
(a)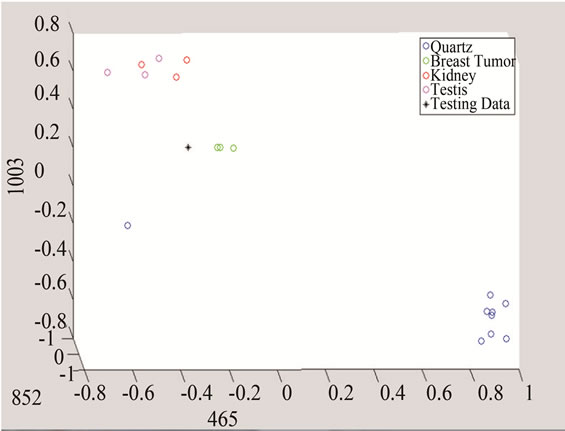 (b)
(b)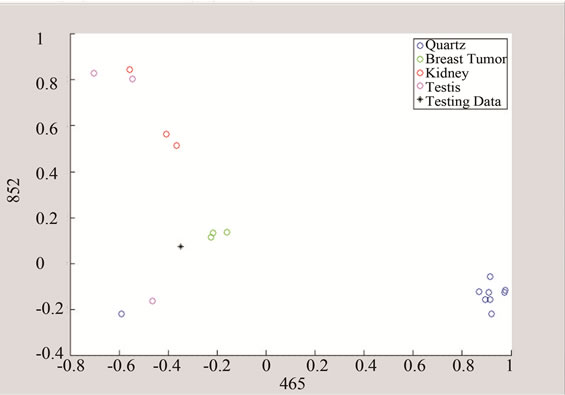 (c)
(c)
Figure 10. Detection of tumor by converting the data to threeand two-dimensional spaces made of unique peaks at (a) 465 cm−1; (b) 852 cm−1; and 1003 cm−1.
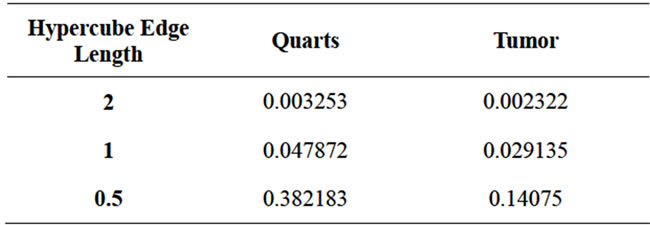
Table 1. Effect of the value of hypercube edge length on the average difference of PDF of testing signal with respect to the right and wrong classes.
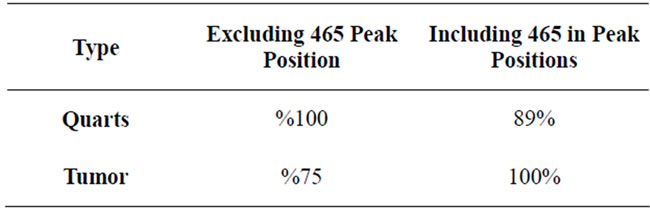
Table 2. Comparison between the results received for spaces including and excluding the peak located at frequency of 465 cm−1.
Qurtz class.
The above data presents the software results for the various types of cancer tissues. However, the objective of this work is to diagnose whether the tissue is cancerous or not, these graphs show the software capability in accurately detecting various cancerous tissues.
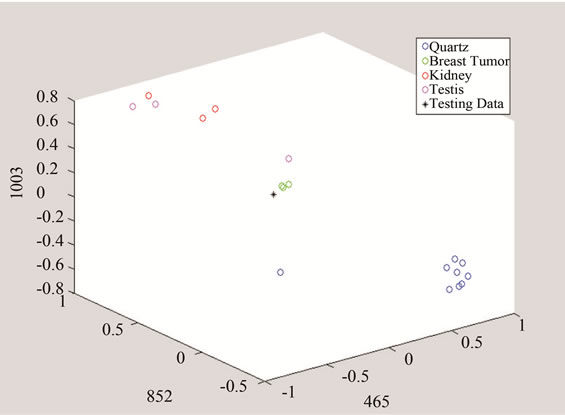
The above algorithm was also used for three frequencies that distinguish between Quarts and Tumor classes, including breast cancer, and the data of each group. The testing data is given in Figures 10 and 11 shows the effect of studying the patterns at various frequency shifts.
5. MINIMUM SAMPLE SIZE DETECTION
A test was performed for a number of cancer tissues in order to find the minimum size cancer tissue that can be detected via the laser beam of the Raman spectroscopy. In this test, a few micron tissue size, which is smaller than the laser beam diameter has been tested. The tissue was placed on the quartz tube and the test was run for more than an hour since the beam power was low. As it can be seen from Figure 12, the results for three various samples are reported and clear distinctions for the Raman shifts are observed. The same tissue with smaller size diameters is reported in Figure 13. There were no clear shifts designated from the quartz tube. The extraction between the sample and the quart carrier is just noise. In conclusion, Raman shift is capable to detection minimum size samples higher than the laser beam diameters. Typical size beams range in the order of microns, which is advantageous over mammography in that aspect.
6. CONCLUSIONS AND FUTURE WORK
In this work, a procedure was developed to classify Raman Spectroscopy signal for the diagnosis of cancer tissue. As indicated in Figure 5 above, the cancerous tissues have different Raman spectroscopy from the normal human tissue, leading to proper approach of diagnosis. The raw Raman Spectroscopy data was transformed to a 3-D visible form that has the ability to distinguish various types of cancer tissues. This approach was realized by normalizing each signal, converting it to
 (a)
(a)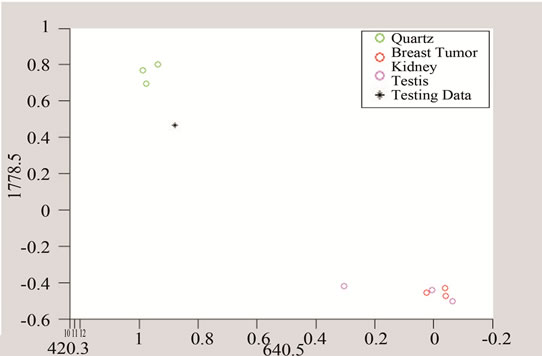 (b)
(b)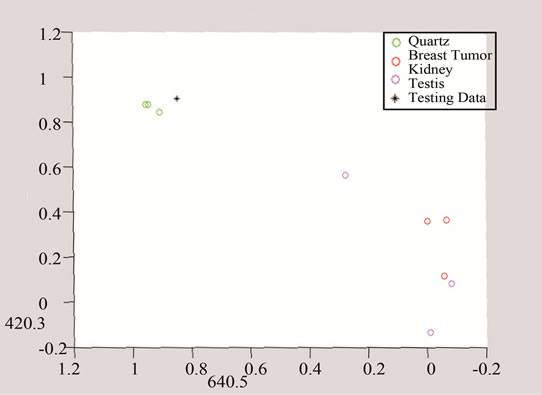 (c)
(c)
Figure 11. Detection of tumor by converting the data to three and two dimensional spaces made of unique peaks at (a) 420.3 cm−1; (b) 640.5 cm-1; and (c) 1778.5 cm−1.
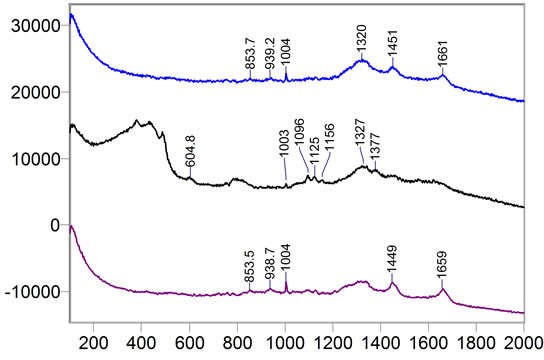
Figure 12. Sample 134492: Cancer tissue samples of larger size than the laser beam.
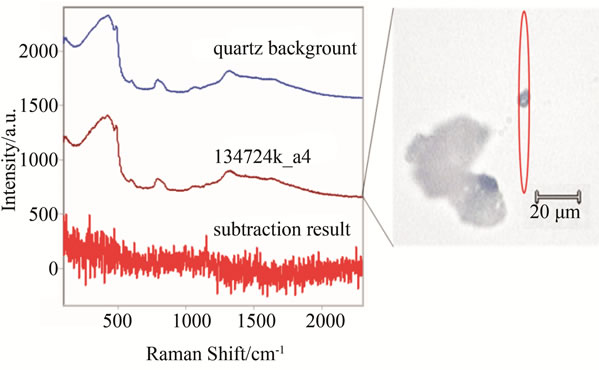
Figure 13. Same samples as in Figure 11, but of smaller size than the laser beam. The red oval represents the approximate shape and position of the laser over the sample. Subtraction of the quartz background reveals no significant signals.
an n-dimensional point, and classifying it with the Parzen-Window method. The peak point selection for each interval class affects the choice of study intervals and value of each point at each dimension. Therefore this procedure is very data dependent and like every other classifier could be improved by increasing the training data set. Since the available data sets were few, there is room for improvement in the selection of peaks. However, the process could be used even for higher number of training data. Based on the available data, it was observed that each of kidney and breast tumors signals have their own unique peaks. The minimum size detected via Raman Spectroscopy has showed promises for early detection cancer diagnosis before spreading out in the human body. Additional investigation is needed for more sample tissues and verifications for various cancer tissues. The laser power is also important to be considered for further study. The work presented here would be valuable to many cancer researchers including those who develop equipment for in vivo diagnosis.
The team of researchers assembled here will next pursue an experimental model that assembles human body members. With that, a research scheme will be developed to distinguish a single scattered data among others. For instance, in case of breast cancer detection, a model that combines cancer tissue, bone, fat cells, etc, should be investigated. The completion of this phase will be pursued by a servo mechanism system for the practical realization of the investigation. Such in vivo approach is reserved for future considerations.
7. ACKNOWLEDGEMENTS
The authors appreciate the assistance of the Indiana University Simon Cancer Center for their support in providing the cancer tissue samples used for this research. The authors also thank Mr. Josh Reid for this time given in the Raman Spectroscopy Laboratories. Special thanks go to Dr. Eliza Du for her guidance in the pattern recognition software, and Dr. Paul Salama for his assistance with the manuscript.
REFERENCES
- Haka, A.S., Shafer-Peltier, K.E., Fitzmaurice, M., Crowe, J., Dasari, R.R. and Feld, M.S. (2002) Detecting breast cancer using Raman spectroscopy. Proceedings of Biomedical Topical Meeting, Miami, 7 April 2002.
- Upile, T., et al. (2009) “Head & neck optical diagnosis: Vision of the future. Head and Neck Oncology, 1, 1-9.
- Swain R.J. and Steven, M.M. (2007) Raman micro spectroscopy for non-invasive biochemical analysis of single cells. Biochemical Society Transactions, 35, 544-549. doi:10.1042/BST0350544
- Haishan, Z., et al. (2009) Raman Spectroscopy for in-vivo toissue analysis and diagnosis at the macro-and micro levels. Proceedings of Communications and Photonic Conference and Exhibition (ACP), Shanghai, 2-6 November 2009.
- Fenn, M.B., et al. (2011) Raman spectroscopy for clinical oncology. Advances in Optical Technologies, 1-20. doi:10.1155/2011/213783
- Stone, N., Kerssens, M., Lloyd, G.R., Faulds, K., Graham, D. and Matousek, P. (2011) Surface enhanced spatially offset raman spectroscopic (sesors) imaging: The next dimension. Chemical Science, 2, 776-780. doi:10.1039/c0sc00570c
- (2012) Breast cancer. American Society of Clinical Oncology. http://www.cancer.net/patient/Cancer+Types/Breast+Cancer
- (2012) Raman spectroscopy general overview. Omega Optical. http://www.omegafilters.com/Capabilities/Applications/Raman_Spectroscopy/Raman_General
- Wolf, J.G. (2006) Medical diagnosis as pattern recognition in a framework of information compression by multiple alignment, unification and search. Decision Support System, 42, 608-625. doi:10.1016/j.dss.2005.02.005
- Begum, S.A. and Devi, O.M. (2011) Fuzzy algorithms for pattern recognition in medical diagnosis. Physics Sciences and Technologies, 7, 1-12. doi:10.1111/1467-9876.00075
- Purushotham T. and Rao, R. (2010) Pattern recognition diagnostics for emphysema using phase only correlation technique. Proceedings of 42nd South Eastern Symposium on System Theory, Tyler, 7-9 March 2010.
- Zhang, Q.P., Liang, M. and Sun, W.C. (2004) Medical diagnostic image fusion based on feature mapping wavelet neural networks. Proceedings of the 3rd International Conference and Graphics, Shanghai, 18-20 December 2004.
- Wright, D., Stander, J. and Nicolaides, K. (1997) Nonparametric density estimation and discrimination from images of shapes. Journal of the Royal Statistical Society, Series C: Applied Statistics, 46, 365-380.
- Frankt, C.J. and McCreey, R.I. (1995) Raman spectroscopy of normal and diseased human breast tissues. Analytical Chemistry, 67, 777-783. doi:10.1021/ac00101a001
Appendix
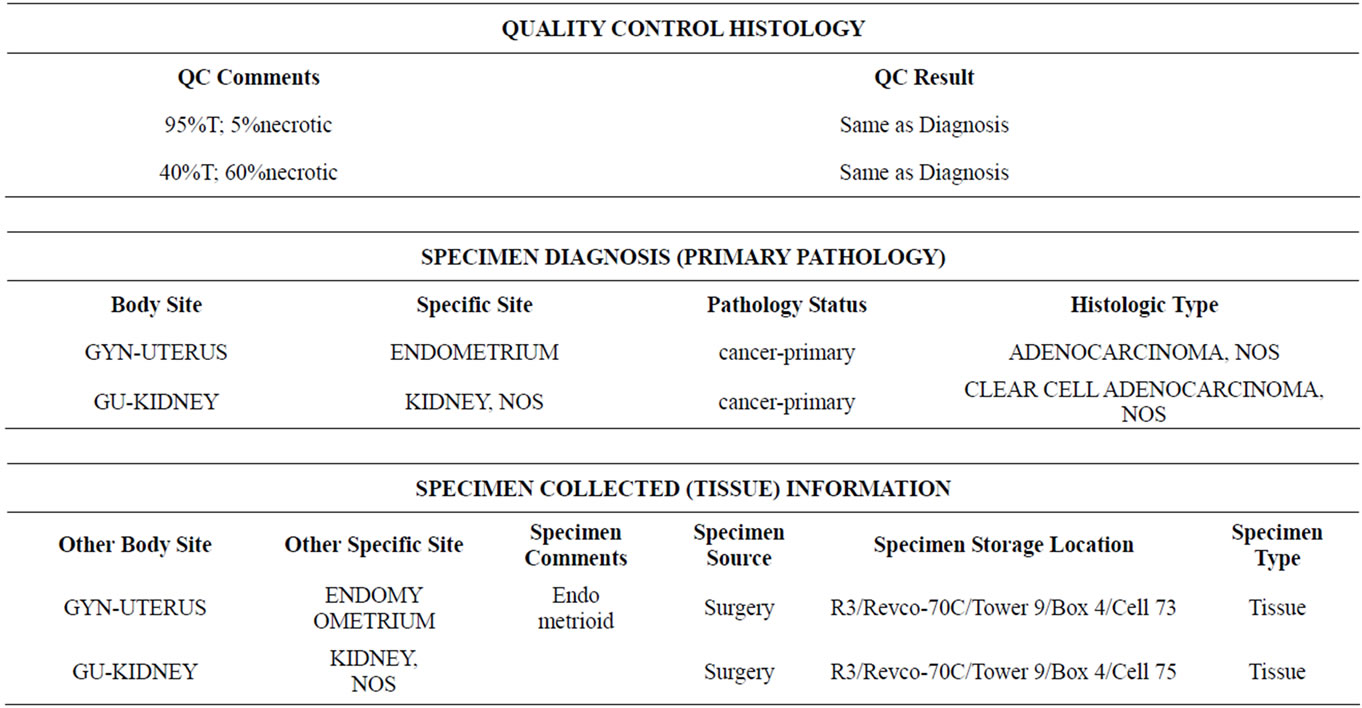
Sample of tissue information provided by the the IU Med School.