Health
Vol.4 No.12A(2012), Article ID:26120,8 pages DOI:10.4236/health.2012.412A218
Age and depot-specific adipokine responses to obesity in mice
![]()
1Breeding Biology and Molecular Genetics, Humboldt-Universität zu Berlin, Berlin, Germany; *Corresponding Author: gudrun.brockmann@agrar.hu-berlin.de
2Free University of Bozen∙Bolzano, Bozen, Italy
Received 9 November 2012; revised 10 December 2012; accepted 23 December 2012
Keywords: Obesity; Leptin; Adiponectin; Gene Expression; Lipids
ABSTRACT
Leptin and adiponectin are the most abundant adipokines that regulate energy homeostasis. Here, we report the changes of leptin and adiponectin in response to age and their depotspecific expression in lean and genetically obese mice. Fat deposition patterns, adipokine levels and their adipose-tissue depot-specific expression patterns were examined in both sexes of lean and obese mice on two different diets at four and 20 weeks. In obese mice, body fat mass was higher than in lean mice and was increased with age. Leptin levels correlated with body fat mass and therefore increased with age. Leptin levels were correlated higher with the weight of subcutaneous than with the weight of reproductive adipose tissue. Likewise, leptin mRNA levels in subcutaneous adipose tissue corresponded well with serum leptin levels. Adiponectin levels did not differ significantly between the ages and did not correlate with body fat mass or with either of the adipose-tissue depots, although obese mice had lower adiponectin levels than lean mice. Nevertheless, serum adiponectin levels showed a pattern of changes that was similar to that of the adiponectin transcript amounts in the reproductive adipose tissue. Our results confirm that serum leptin levels are regulated by the body fat mass, predominantly by the subcutaneous adipose tissue mass. Furthermore, our data provide evidence that serum adiponectin levels are influenced by other factors than body fat mass alone.
1. INTRODUCTION
Endocrine disturbances in obese individuals have been associated with the adipose tissue mass since the adipose tissue secretes various hormones, which are termed adipokines. Leptin and adiponectin are the most abundant adipokines [1]. Leptin is an essential hormonal regulator of metabolism that signals energy insufficiency and energy excess to the brain [2]. In steady-state conditions of energy supply, leptin levels correlate well with the amount of adipose tissue [3]. Furthermore leptin stimulates fatty acid oxidation, but also suppresses insulin secretion [4,5]. The hormone adiponectin reflects insulin sensitivity [6], suppresses gluconeogenesis and enhances lipid oxidation in liver and muscle [7]. Particularly, in skeletal muscle, glucose uptake is stimulated, contributing to the insulin-sensitising effect [8]. Compared to other peptide hormones in blood plasma, adiponectin circulates in extremely high levels (~0.01% of total plasma protein) [9].
The regulation of both hormones is altered in the obese state. During obesity, the regulatory function of leptin is impaired, leading to hyperleptinemia in most cases. This observation proposed the idea that obesity is associated with a state of leptin resistance, similar to the insulin resistance of type 2 diabetes [10,11]. In contrast to leptin levels, adiponectin levels are decreased in most cases during rodent and human obesity [12,13]. Even in young individuals increased leptin levels and decreased adiponectin levels were found in response to obesity [14,15]. Although leptin and adiponectin levels are associated with the overall adipose tissue mass, there are hints that the adipokine secretion differs between different adipose tissue depots [16].
The aims of this study were to investigate 1) the agerelated changes of leptin and adiponectin serum levels and 2) the adipose-tissue depot-specific expression of these two adipokines in response to fat accumulation. So far, studies in rodents were carried out only with dietinduced obese models, although the genetic predisposition plays an important role in the development of obesity [17,18]. Our investigation was performed in both sexes of the lean C57BL/6NCrl (B6) and Berlin Fat Mouse Inbred (BFMI) line that is genetically predisposed to obesity. BFMI mice are obese as a result of repeated selection for high fatness over many generations. Therefore, these mice harbour natural mutations causing a higher fat percentage due to hyperphagia and an altered lipid metabolism [19-21]. Each line was divided in a standard diet group and a high-fat diet group which were fed either standard breeding diet (SBD) or a high-fat diet (HFD) until the age of four and 20 weeks. Transcript amounts of the two adipokines were determined in the most abundant adipose tissues, namely reproductive and subcutaneous adipose tissues, at 20 weeks.
2. MATERIALS AND METHODS
2.1. Mice and Diets
The study was carried out with the Berlin Fat Mouse Inbred line 860 (BFMI; Department of Crop and Animal Sciences, Humboldt-Universität zu Berlin, Berlin, Germany) and C57BL/6NCrl (B6) mice (Charles River Laboratories, Sulzfeld, Germany). Three-week-old BFMI and B6 mice were placed on either SBD or HFD. For each age, each sex, and each feeding group, four to eight animals of the BFMI and B6 line were used, respectively. The SBD (diet no. 1314, Altromin, Lage, Germany) had a gross energy content of 12.5 MJ/kg (16% of calories from fat, 27% from protein and 57% from carbohydrates). The HFD had a gross energy content of 16 MJ/kg (45% of calories from fat, 16% from protein and 39% from carbohydrates). Animals had ad libitum access to food and water throughout the experiment. They were housed at 12-hour light/dark cycles. All animal treatments were in accordance with the German Animal Welfare Legislation (approval no. G 0152/04, no. T0149/04).
2.2. Mouse Phenotyping and Tissue Collection
Mice were weighed weekly to examine body weight gain. Body fat mass was measured in non-anaesthetised mice by quantitative magnetic resonance (QMR) analysis using the EchoMRI whole body composition analyser (Echo Medical Systems, Houston, Texas, USA) [22]. QMR measurements were performed in duplicates and the mean was used for further analyses. At four and 20 weeks, mice were sacrificed after a fasting period of two hours (between 8 and 12 a.m.) by cervical dislocation to obtain the largest possible blood volumes for the analysis of serum parameters. The subcutaneous and reproductive adipose tissues were dissected and immediately weighed. The tissues of 20-week-old mice were shock frozen in liquid nitrogen. The inguinal fat depot was collected as subcutaneous adipose tissue and the epididymal fat depot in males and the periuterine fat depot in females were collected as reproductive adipose tissue. Samples were stored at −80˚C for gene expression analyses.
2.3. Hormone Analyses
Serum leptin and adiponectin were determined by enzyme-linked immuno-sorbent assay (ELISA). Leptin levels were measured in duplicates using the commercially available m/rLeptin ELISA kit (mediagnost, Reutlingen, Germany). Samples were diluted 1/10 v/v with dilution buffer to allow use of the kit’s standard curve. Adiponectin was determined in duplicate samples (diluted 1/5000 v/v or 1/8000 v/v with Reagent Diluent) by the DuoSet ELISA Development kit (R&D Systems, Wiesbaden, Germany). According to the manufacturer, intra-assay coefficients of variation (CV) were 4.4% and 5.8%, and inter-assay CVs were 4.7% and 6.0% with sensitivities of 0.01 and 0.003 ng/ml for mouse leptin and adiponectin, respectively.
2.4. Gene Expression Analysis
Subcutaneous and reproductive adipose tissues of 20- weeks old mice were assayed for expression levels of leptin and adiponectin by real-time PCR. Total RNA was isolated from 50 - 60 mg of frozen tissues using the Nucleospin RNA II kit (Machery-Nagel, Düren, Germany). 200 - 500 ng of total RNA was reverse-transcribed into cDNA using AccuScript High Fidelity Reverse Transcriptase (Stratagene Europe, Amsterdam, Netherlands) and random hexamer primers (Invitrogen, Karlsruhe, Germany).
Primer sequences for the genes leptin (Entrez Gene ID 16846) and adiponectin (Entrez Gene ID: 11450) were as follows: Leptin upstream primer 5’-CCA GGG AGG AAA ATG TGC TG-3’; downstream primer 5’-ACC CTC TGC TTG GCG GAT AC-3’; adiponectin upstream primer 5’-CAT GCC GAA GAT GAC GTT AC-3’; downstream primer 5’-CTT CAG CTC CTG TCA TTC CA-3’. beta-actin was used as an invariant control with the upstream primer 5’-GAC GGC CAG GTC ATC ACT AT-3’ and the downstream primer 5’-CTT CTG CAT CCT GTC AGC AA-3’. 10 ng cDNA were mixed thoroughly with the qPCR Mastermix Plus Kit for SYBR Green (Eurogentec, Köln, Germany) with 300 nM of the gene-specific primer in a final volume of 15 µl per reaction. Quantification of mRNA transcript amounts was performed using the Stratagene Mx3000P real-time PCR system and Stratagene MxProTM QPCR Software. The standard amplification protocol consisted of a DNA denaturation step of 5 min at 95˚C followed by 40 amplification cycles consisting of 15 s at 95˚C and 1 min at 60˚C.
Relative transcript amounts were calculated using the relative quantification method (delta/deltaCT method) (24). The relative quantity (RQ) fold change was calculated by the equation RQ = 2−ΔΔCT (fold), where ∆CT equals threshold cycle value (CT) of the target gene (leptin or adiponectin) minus CT of the endogenous control (beta-actin), and ΔΔCT equals ΔCT of the samples for the target gene minus ΔCT of the calibrator of the target gene. For the analysis of the effects in the tissue, B6 males on SBD were defined as the calibrator.
2.5. Mouse Phenotyping and Tissue Collection
To assess the effects of age, line, diet, and sex of the measured traits, ANOVA with the general linear model (GLM) was performed. Welch’s t-test was used to evaluate the differences between the groups at each age. Gene expression data were rank-transformed; all other data were log-transformed prior to ANOVA to obtain a normal distribution. To assess the relationships between the serum adipokine levels with the body fat and the weights of the two adipose-tissue depots Spearman’s correlation coefficients were used after adjustment for age, line, sex, and diet. For the analysis of tissue and adipokine effects on transcript amounts, we included these factors as fixed effects in the ANOVA model. Data are presented as raw data in tables and figures. Data are given as means ± standard deviation (sd). Differences were considered statistically significant if p < 0.05. All analyses were performed using the statistical package R [23].
3. RESULTS
3.1. Age-Related Changes of Body Composition and Adipokines
As early as at the age of four weeks, BFMI males and females deposited three to four times as much fat mass on both diets as B6 mice (p < 0.01; Figure 1(a)). Due to the higher body fat mass, leptin levels of BFMI mice on SBD were 34 and 16 times as high as those of B6 at four weeks in males and females, respectively (Figure 1). When the leptin levels were corrected for the total amount of body fat mass, leptin levels of BFMI mice were still significantly higher than in B6 (Table 1). Consistent with the total fat content, serum adiponectin levels were lower in BFMI mice (approximately 3.5 µg/ml) than in B6 mice (both sexes: 5 - 6 µg/ml). If adiponectin levels were corrected for body fat mass, they were still lower in BFMI than in B6 mice (Table 1).
In response to only one week of HFD-feeding, fourweeks-old BFMI males and females as well as both sexes
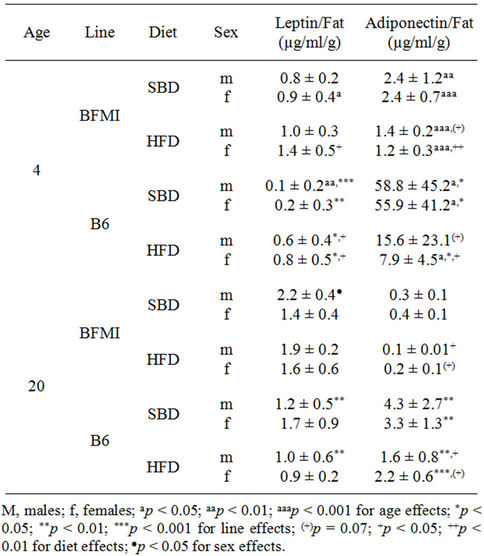
Table 1. Leptin and adiponectin to fat ratios of fourand 20- week-old BFMI and B6 mice fed a standard breeding (SBD) or high-fat diet (HFD).
of B6 showed a high-fat diet-induced fat deposition which was accumulated mainly in the subcutaneous adipose tissue (Figure 1). Likewise, the leptin levels were increased already in four week-old BFMI and B6 mice compared to SBD-fed mice. Between the lines, the leptin levels in BFMI were about five times as high as in B6 males and females on HFD conditions. When the leptin levels were corrected for body fat mass, leptin levels of BFMI mice were still significantly higher than in B6. On serum adiponectin levels HFD had no effect. However, if the levels of adiponectin were corrected for body fat mass, they declined in response to HFD in both lines (Table 1).
Until 20 weeks of age, all mice on SBD gained body fat mass by increasing their mass of subcutaneous as well as of reproductive adipose tissue, except B6 mice on HFD which only increased the reproductive adipose tissue. At 20 weeks, BFMI mice deposited five to ten times as much fat mass on SBD and HFD as B6 mice, respectively (p < 0.01; Figure 1(b)). In response to HFD, all mice gained additional body fat mass, except of BFMI females. The additional body fat mass in BFMI males was deposited mainly in the subcutaneous adipose tissue but in B6 mice, the subcutaneous and the reproductive adipose-tissue depot contributed to the increase of fat mass. Corresponding, with the higher adipose tissue mass in higher ages, leptin levels increased, too. Therefore, age related changes of the leptin could be detected
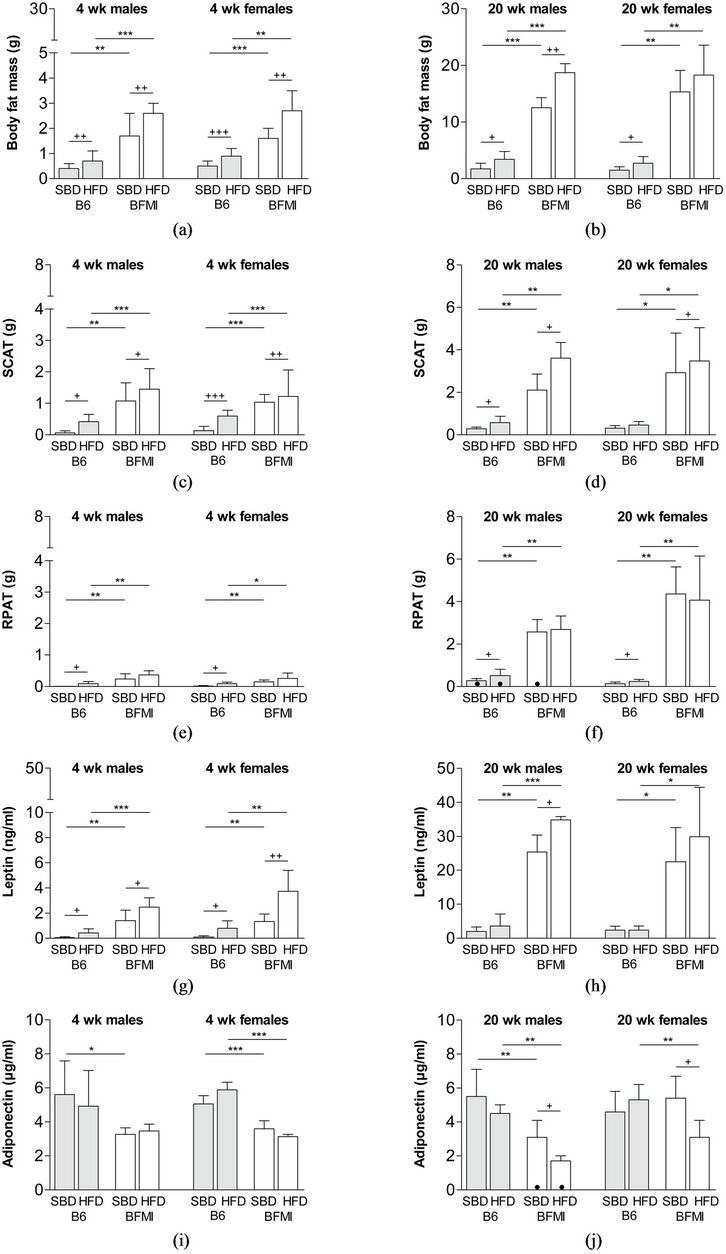
Figure 1. Body fat mass (a/b), subcutaneous adipose tissue (c/d), reproductive adipose tissue (e/f), serum level of leptin (g/h) and serum level of adiponectin (i/j) at four and 20 weeks of age in BFMI and B6 males and females on standard breeding (SBD) and high-fat diet (HFD). RPAT—reproductive adipose tissue; SCAT—subcutaneous adipose tissue; wk—weeks.
in all mice. Leptin levels of BFMI mice on SBD were nine to 13 times as high as those of B6 (Figure 1). The leptin to body fat mass ratio was five to eight times higher in BFMI compared to B6 mice, but age-related changes were only significant in BFMI females and B6 males on SBD. In response to HFD, only BFMI males showed a high-fat diet-induced increase of leptin which was in concordance with the increase of body fat mass. Despite the differences in body fat mass between the ages, adiponectin levels did not differ significantly. Serum adiponectin levels in 20-week-old mice showed similar levels as at four weeks. Changes in adiponectin levels in response to the different diets were only detectable in BFMI mice. Both BFMI males and females responded to HFD with strong reduction of serum adiponectin levels to 1.7 and 2.7 µg/ml, respectively, which were about half of the adiponectin levels found in BFMI mice on SBD and which was markedly smaller than in B6 mice. Serum adiponectin level corrected for fat mass showed a strong age related decline in all mice as well as a strong reduction in BFMI compared to B6 mice and a reduction in response to HFD in both lines.
3.2. Adipose-Tissue Depot-Specific Expression of Leptin and Adiponectin
At four weeks of age, serum leptin levels showed a high correlation with body fat mass (r = 0.63; p < 0.0001) as well as with the amount of subcutaneous adipose tissue (r = 0.59; p < 0.0001), whereas the correlation with the amount of reproductive adipose tissue was weaker (r = 0.37; p = 0.01). At 20 weeks of age, the correlation between the serum leptin levels with body fat mass was comparable; however, the relationship to distinct adipose tissues was less clear. Nevertheless, the correlation of serum leptin levels with subcutaneous adipose tissue (r = 0.44; p < 0.004) was still higher than with the reproductive adipose tissue (r = 0.40; p < 0.01). The leptin transcript amounts in subcutaneous adipose tissue (Figure 2(a)) corresponded well with the pattern of high serum leptin levels as well as the subcutaneous adipose tissue mass in BFMI mice on SBD and HFD (Figures 1(d) and (h)). In reproductive adipose tissue, line differences in leptin mRNA amounts could only be detected in females. Response to HFD was neither found in B6 nor in BFMI mice (Figure 2(c)).
Although serum levels of adiponectin were lower in obese BFMI male and female mice compared to lean B6 mice on both diets, no correlation could be found between serum adiponectin levels with body fat mass or with one of the adipose-tissue depots at either age. The mRNA levels of adiponectin in subcutaneous adipose tissue differed only between BFMI and B6 males on SBD, and only B6 males responded significantly to HFD by reduced cellular adiponectin mRNA amounts. In BFMI, diet-induced reduction of adiponectin mRNA was not found in subcutaneous, but in reproductive adipose tissue (Figures 2(b) and (d)). The effect was statistically significant for males and females, but males responded more strongly than females. In BFMI males, the changes of adiponectin mRNA amounts in response to HFD were in line with the reduced serum adiponectin levels. Although BFMI and B6 females had similar serum adiponectin levels on SBD, the mRNA amounts were lower in BFMI females than in B6.
4. DISCUSSION
As early as at four weeks, an obese phenotype was evident in the BFMI mice and both B6 and BFMI mice showed a significant increase in body fat mass in response to high-fat diet feeding. Fat deposition in both lines was predominant in the subcutaneous adipose tissue. Corresponding, leptin levels were already increased in four week-old BFMI mice in particular in high-fat dietfed mice. At the age of 20 weeks, when both lines gained body fat mass, only the BFMI line showed marked obesity with an increase in both reproductive and subcutaneous adipose tissue. At four and 20 weeks, leptin levels showed a clear correlation with the weight of body fat mass indicating a direct relationship between both. As the excess of adipose tissue causes leptin resistance [10,11], the highly increased serum leptin levels in BFMI mice indicate leptin resistance which is already evident at the age of four weeks. This is further supported by a higher energy uptake per day in BFMI mice compared to B6 mice, which was evident already within the first week after weaning (data not shown). The higher food intake was observed although young BFMI mice have increased leptin levels as well as increased leptin to body fat mass ratios which should signal enough energy supply.
From studies in humans [12] and rodents [24,25], we would expect reduced adiponectin levels with increased fat mass. Accordingly, BFMI mice showed lower adiponectin levels compared to B6 already at the age of four, but also at 20 weeks. However, from four to 20 weeks, adiponectin levels did not further decrease in both lines, although the body fat mass rose considerably. The lack of a correlation of adiponectin with body fat mass or with the mass either of the adipose tissues indicates that other mechanisms are involved in adiponectin secretion than adipose tissue mass alone. Studies in mice [24] showed that adiponectin levels increase during sexual maturation. This increase during puberty might be counterbalancing the decrease due to the larger body fat mass in our mice. When adiponectin levels were corrected for body fat mass, a clear decrease is seen with higher age, with HFD-feeding, and in BFMI mice compared to B6. This supports the hypothesis of Ribot et al. [26] who
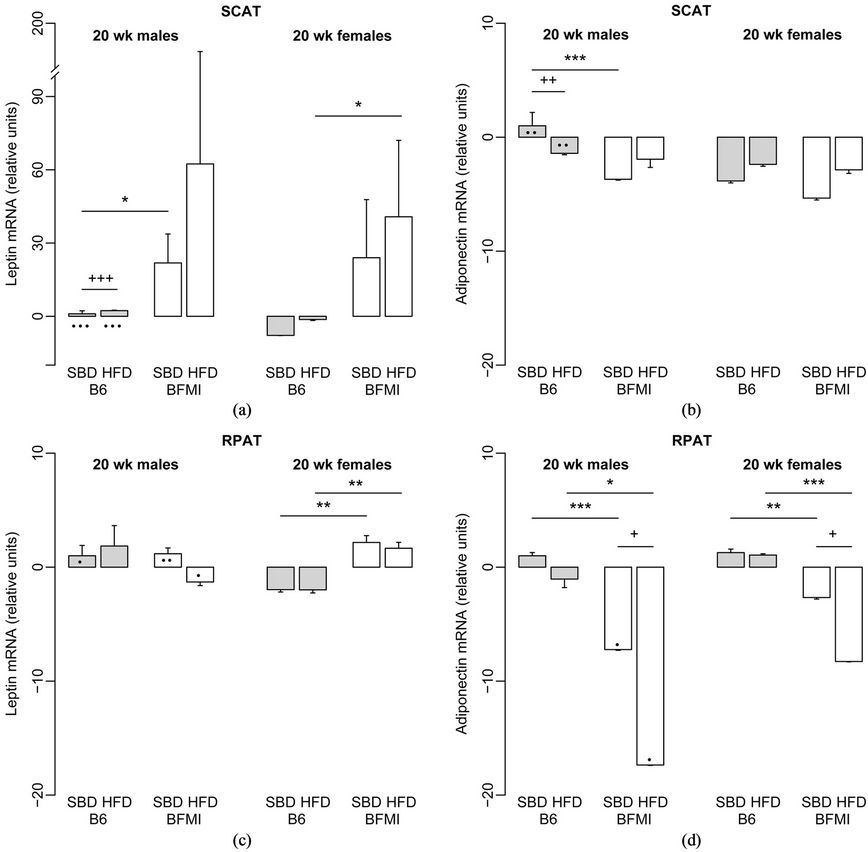
Figure 2. Relative leptin (a/c) and adiponectin (b/d) mRNA amounts in subcutaneous adipose tissue (a/b) and reproductive adipose tissue (c/d) in 20-week-old BFMI and B6 mice on standard breeding and high-fat diet, respectively. B6 males on SBD were defined as the calibrator. HFD—high-fat diet; RPAT—reproductive adipose tissue; SBD—standard breeding diet; SCAT—subcutaneous adipose tissue; wk—weeks.
state that adiponectin expression would depend on the composition of adipose tissue. While hyperplasia produces new adipocytes which might be associated with higher adiponectin expression, mainly adipocyte hypertrophy leads to reduced adiponectin levels. This relationship is indicated by reduced adiponectin to fat mass ratios rather than lowered adiponectin levels itself. Compared to B6, BFMI mice show adipocyte hypertrophy [27] which explains the reduced adiponectin levels in BFMI mice. Between four to 20 weeks, however, hyperplasia occurs in addition to hypertrophy leading to new adiponectin expressing adipocyte. These new cells counterbalance the decrease of adiponectin expression due to higher body fat mass which would explain the lack of an age-related decline of adiponectin levels.
To evaluate the depot-specific differences in leptin expression, gene expression levels were investigated in reproductive and subcutaneous adipose tissues at 20 weeks. Results show that high leptin mRNA expression in subcutaneous adipose tissue is reflected by circulating leptin levels. Further support is given in response to HFD when the additional accumulated fat was deposited mainly in subcutaneous adipose tissue and the leptin mRNA levels further increased. These findings correspond well with studies in other rodents and humans where leptin is also higher expressed in subcutaneous than in other adipose tissues [28,29]. However, the highest correlation was between leptin and the total body fat mass indicating that not only the weight of subcutaneous adipose tissue regulates the leptin expression within this tissue. Corresponding with the effect on serum adiponectin levels, similar patterns of line-, sexand dietspecific effects were found for adiponectin transcript amounts in reproductive adipose tissue. This implies that the reproductive adipose tissue would be important for adiponectin serum levels in prolonged obesity. However, after short-term HFD-feeding of rats an altered adiponectin mRNA expression could not be found [26]. Different from other diet-induced obesity models [30], the weight of adipose tissue did not correlate with adiponectin serum levels in this study. Significant line-bydiet interactions for serum adiponectin levels in our experiment indicate a complex pattern of genetic and diet influences on adiponectin than body fat mass alone.
In addition, although BFMI males and females on HFD had similar body fat mass, BFMI females had generally higher serum adiponectin levels than males, which is in line with other reports in rodents [26]. Even the adiponectin levels of BFMI females on SBD were high and did not differ from those of B6. Higher adiponectin levels in females than in males were also found in B6. This observation raises the question if females are able to counterbalance increased fat deposition by increasing their serum adiponectin. Such a counterregulation might be restricted to females only as adiponectin production is influenced by sexual hormones [24]. This mechanism might make females more robust against the onset of later complications of obesity like reduced insulin sensitivity, diabetes or cardiovascular disease.
Our results demonstrate that serum leptin levels depend on body fat mass irrespective of age and that leptin is expressed predominantly by the subcutaneous adipose tissue. Serum adiponectin levels, however, do not directly depend on the weight of body fat mass but also on other influences such as adipose tissue composition or the genetic background.
5. ACKNOWLEDGEMENTS
The project was funded by grants from the National Genome Research Network (NGFN-Plus, registration No. 01GS0829) and the Deutsche Forschungsgemeinschaft (GK 1208).
REFERENCES
- Tilg, H. and Moschen, A.R. (2006) Adipocytokines: Mediators linking adipose tissue, inflammation and immunity. Nature Reviews Immunology, 6, 772-783. doi:10.1038/nri1937
- Flier, J.S. (1998) Clinical review 94: What’s in a name? In search of leptin’s physiologic role. Journal of Clinical Endocrinology & Metabolism, 83, 1407-1413. doi:10.1210/jc.83.5.1407
- Friedman, J.M. and Halaas, J.L. (1998) Leptin and the regulation of body weight in mammals. Nature, 395, 763-770. doi:10.1038/27376
- Minokoshi, Y., Kim, Y.B., Peroni, O.D., Fryer, L.G., Muller, C., Carling, D. and Kahn, B.B. (2002) Leptin stimulates fatty-acid oxidation by activating AMP-activiated protein kinase. Nature, 415, 339-343. doi:10.1038/415339a
- Lee, Y.H., Magkos, F., Mantzoros, C.S. and Kang, E.S. (2011) Effects of leptin and adiponectin on pancreatic beta-cell function. Metabolism, 60, 1664-1672. doi:10.1016/j.metabol.2011.04.008
- Basu, S., Laffineuse, L., Presley, L., Minium, J., Catalano, P.M. and Hauguel-de Mouzon, S. (2009) In utero gender dimorphism of adiponectin reflects insulin sensitivity and adiposity of the fetus. Obesity (Silver Spring), 17, 1144- 1149.
- Kadowaki, T. and Yamauchi, T. (2005) Adiponectin and adiponectin receptors. Endocrine Reviews, 26, 439-451. doi:10.1210/er.2005-0005
- Yamauchi, T., Kamon, J., Minokoshi, Y., Ito, Y., Waki, H., Uchida, S., Yamashita, S., Noda, M., Kita, S., Ueki, K., Eto, K., Akanuma, Y., Froguel, P., Foufelle, F., Ferre, P., Carling, D., Kimura, S., Nagai, R., Kahn, B.B. and Kadowaki, T. (2002) Adiponectin stimulates glucose utilization and fatty-acid oxidation by activating AMP-activated protein kinase. Nature Medicine, 8, 1288-1295. doi:10.1038/nm788
- Kadowaki, T., Yamauchi, T., Kubota, N., Hara, K., Ueki, K. and Tobe, K. (2006) Adiponectin and adiponectin receptors in insulin resistance, diabetes, and the metabolic syndrome. Journal of Clinical Investigation, 116, 1784- 1792. doi:10.1172/JCI29126
- Frederich, R.C., Hamann, A., Anderson, S., Lollmann, B., Lowell, B.B. and Flier, J.S. (1995) Leptin levels reflect body lipid content in mice: Evidence for diet-induced resistance to leptin action. Nature Medicine, 1, 1311-1314. doi:10.1038/nm1295-1311
- Caprio, S., Tamborlane, W.V., Silver, D., Robinson, C., Leibel, R., McCarthy, S., Grozman, A., Belous, A., Maggs, D. and Sherwin, R.S. (1996) Hyperleptinemia: An early sign of juvenile obesity. Relations to body fat depots and insulin concentrations. American Journal of Physiology, 271, E626-E630.
- Arita, Y., Kihara, S., Ouchi, N., Takahashi, M., Maeda, K., Miyagawa, J., Hotta, K., Shimomura, I., Nakamura, T., Miyaoka, K., Kuriyama, H., Nishida, M., Yamashita, S., Okubo, K., Matsubara, K., Muraguchi, M., Ohmoto, Y., Funahashi, T. and Matsuzawa, Y. (1999) Paradoxical decrease of an adipose-specific protein, adiponectin, in obesity. Biochemical and Biophysical Research Communications, 257, 79-83. doi:10.1006/bbrc.1999.0255
- Weyer, C., Funahashi, T., Tanaka, S., Hotta, K., Matsuzawa, Y., Pratley, R.E. and Tataranni, P.A. (2001) Hypoadiponectinemia in obesity and type 2 diabetes: Close association with insulin resistance and hyperinsulinemia. Journal of Clinical Endocrinology & Metabolism, 86, 1930-1935. doi:10.1210/jc.86.5.1930
- Diamond Jr., F.B., Cuthbertson, D., Hanna, S. and Eichler, D. (2004) Correlates of adiponectin and the leptin/adiponectin ratio in obese and non-obese children. Journal of Pediatric Endocrinology & Metabolism, 17, 1069- 1075.
- Gil-Campos, M., Canete, R. and Gil, A. (2004) Hormones regulating lipid metabolism and plasma lipids in childhood obesity. International Journal of Obesity and Related Metabolic Disorders, 28, S75-S80. doi:10.1038/sj.ijo.0802806
- Einstein, F.H., Atzmon, G., Yang, X.-M., Ma, X.-H., Rincon, M., Rudin, E., Muzumdar, R. and Barzilai, N. (2005) Differential responses of visceral and subcutaneous fat depots to nutrients. Diabetes, 54, 672-678. doi:10.2337/diabetes.54.3.672
- Barsh, G.S., Farooqi, I.S. and O’Rahilly, S. (2000) Genetics of body-weight regulation. Nature, 404, 644-651.
- Rankinen, T., Zuberi, A., Chagnon, Y.C., Weisnagel, S.J., Argyropoulos, G., Walts, B., Perusse, L. and Bouchard, C. (2006) The human obesity gene map: The 2005 update. Obesity (Silver Spring), 14, 529-644. doi:10.1038/oby.2006.71
- Meyer, C.W., Wagener, A., Rink, N., Hantschel, C., Heldmaier, G., Klingenspor, M. and Brockmann, G.A. (2009) High energy digestion efficiency and altered lipid metabolism contribute to obesity in BFMI mice. Obesity (Silver Spring), 17, 1988-1993. doi:10.1038/oby.2009.124
- Neuschl, C., Hantschel, C., Wagener, A., Schmitt, A.O., Illig, T. and Brockmann, G.A. (2010) A unique genetic defect on chromosome 3 is responsible for juvenile obesity in the Berlin Fat Mouse. International Journal of Obesity, 34, 1706-1714. doi:10.1038/ijo.2010.97
- Wagener, A., Schmitt, A.O., Aksu, S., Schlote, W., Neuschl, C. and Brockmann, G.A. (2006) Genetic, sex, and diet effects on body weight and obesity in the Berlin Fat Mouse Inbred lines. Physiological Genomics, 27, 264-270. doi:10.1152/physiolgenomics.00225.2005
- Tinsley, F.C., Taicher, G.Z. and Heiman, M.L. (2004) Evaluation of a quantitative magnetic resonance method for mouse whole body composition analysis. Obesity Research, 12, 150-160. doi:10.1038/oby.2004.20
- R Development Core Team (2011) R: A Language and Environment for Statistical Computing. R Foundation for Statistical Computing, Vienna. http://www.R-project.org
- Combs, T.P., Berg, A.H., Rajala, M.W., Klebanov, S., Iyengar, P., Jimenez-Chillaron, J.C., Patti, M.E., Klein, S.L., Weinstein, R.S. and Scherer, P.E. (2003) Sexual differentiation, pregnancy, calorie restriction, and aging affect the adipocyte-specific secretory protein adiponectin. Diabetes, 52, 268-276. doi:10.2337/diabetes.52.2.268
- Pajvani, U.B., Du, X., Combs, T.P., Berg, A.H., Rajala, M.W., Schulthess, T., Engel, J., Brownlee, M. and Scherer, P.E. (2003) Structure-function studies of the adipocytesecreted hormone Acrp30/adiponectin. Implications fpr metabolic regulation and bioactivity. Journal of Biological Chemistry, 278, 9073-9085. doi:10.1074/jbc.M207198200
- Ribot, J., Rodriguez, A.M., Rodriguez, E. and Palou, A. (2008) Adiponectin and resistin response in the onset of obesity in male and female rats. Obesity (Silver Spring), 16, 723-730. doi:10.1038/oby.2008.113
- Wagener, A., Goessling, H.F., Schmitt, A.O., Mauel, S., Gruber, A.D., Reinhardt, R. and Brockmann, G.A. (2010) Genetic and diet effects on Ppar-? and Ppar-? signaling pathways in the Berlin Fat Mouse Inbred line with genetic predisposition for obesity. Lipids in Health and Disease, 9, 99. doi:10.1186/1476-511X-9-99
- Montague, C.T., Prins, J.B., Sanders, L., Digby, J.E. and O’Rahilly, S. (1997) Depotand sex-specific differences in human leptin mRNA expression: Implications for the control of regional fat distribution. Diabetes, 46, 342-347. doi:10.2337/diabetes.46.3.342
- Hube, F., Lietz, U., Igel, M., Jensen, P.B., Tornqvist, H., Joost, H.G. and Hauner, H. (1996) Difference in leptin mRNA levels between omental and subcutaneous abdominal adipose tissue from obese humans. Hormone and Metabolic Research, 28, 690-693. doi:10.1055/s-2007-979879
- Bullen Jr., J.W., Bluher, S., Kelesidis, T. and Mantzoros, C.S. (2007) Regulation of adiponectin and its receptors in response to development of diet-induced obesity in mice. American Journal of Physiology—Endocrinology and Metabolism, 292, E1079-E1086. doi:10.1152/ajpendo.00245.2006