Journal of Modern Physics
Vol. 2 No. 8 (2011) , Article ID: 6818 , 9 pages DOI:10.4236/jmp.2011.28108
Optical Properties and Activation Energy of a Novel System of CdTe Nanoparticles Embedded in Phosphate Glass Matrix
1Physics and Engineering Mathematics Department, Faculty of Electronic Engineering, Menufiya University, Menouf Egypt
2Department of Physics, Faculty of Science, Menoufia University, Shebin El-Koom, Egypt
3Department of Physics, Faculty of Science, Ibb University, Ibb, Yemen
E-mail: wageh1@yahoo.com, wageh.swailam@el-eng.menofia.edu.eg
Received February 12, 2011; revised April 28, 2011; accepted May 18, 2011
Keywords: Nanoparticles, CdTe-Optical Properties, Activation Energy
ABSTRACT
We report growth and optical properties of a novel system of CdTe nanoparticles doped P2O5-Na2O-ZnO-Li2O glass matrix. We have investigated the effect of concentration, annealing time and temperature on the band gap and size of the CdTe semiconductor nanoparticles. In addition the effect of adding ZnO to the glass matrix on the growing of the nanoparticles has been investigated. We found that the addition of ZnO to the glass composition is strongly affecting the growth of the nanoparticles. On the other hand, we have calculated the size polydispersity index which showed narrow size distribution for the prepared nanoparticles. Furthermore, we have estimated the activation energy of diffusion for the prepared CdTe nanoparticles which gave the activation energy with low value ~44 KJ·mol–1.
1. Introduction
Semiconductor quantum dots have attracted a great interest in recent years because of their unique chemical, physical, optical and electrical properties which are different from those of either the bulk materials or single atoms. These unique properties of quantum dots arise from the quantum confinement of charge carriers. The quantum confinement effect is induced for semiconductor by reducing their size to less than 10 nm [1-7]. II-VI semiconductor quantum dots have attracted much attention due to both their unique properties brought by the three dimensional quantum confinement and their potential for photonic applications as optical devices [8-10]. CdTe is one of the II–VI semiconductor nanocrystals which have a large exciton Bohr diameter ~15 nm, and therefore it offers the possibility of studying quantum confinement effects in higher cluster size regimes. Up to now very rare work are published about the glass matrices doped with CdTe nanocrystals [11-17].
To the best of our knowledge, CdTe nanocrystal doped sodium/lithium-mixed phosphate glass matrix has not been reported since our published work May 2011 [17]. Our nanoparticles doped sodium/lithium-mixed phosphate glass matrix begun in 2008 [18] and 2009 [19], and we have studied the growth of CdSe and PbSe nanocrystals in this glass matrix. In this work, it is intended to study the growth of CdTe nanoparticles in P2O5-Na2OZnO-Li2O glass matrix. We have studied the effect of concentration, annealing time and temperature on the growing of nanoparticles. In addition the activation energy of diffusion for the prepared CdTe nanoparticles has been estimated for different concentrations of doping. The prepared samples characterized by X-ray diffraction, differential thermal analysis and optical absorption spectroscopy.
2. Preparation
In this work we have prepared a new system of CdTe nanoparticles doped phosphate glass matrix. Firstly, we have prepared two systems with different base of glass. These two systems are P2O5-Na2O-Li2O: 2 wt% (CdO+Te) and P2O5-Na2O-ZnO-Li2O: 2 wt% (CdO+Te). We found that the second system which includes ZnO in glass matrix is improving the formation of nanoparticles. So, we selected this system to study the effect of different concentrations of CdO and Te on the nanoparticles growth and to calculate the activation energy for growing CdTe nanoparticles in phosphate glass matrix. The concentrations of (CdO+Te) are 1, 1.5, 2 and 2.5 wt%. Hereafter, we call the two base glasses P2O5-Na2O-Li2O and P2O5-Na2O-ZnO-Li2O, PNL and PNZL, respectively. The raw materials used in preparation are Li2CO3, Na2CO3, ZnO, P2O5, CdO and Te reagent grades. The raw materials were weighted, mixed and stirred mechanically many times to obtain homogeneous mixture. The mixture has put in porcelain crucibles and inserted in an electric furnace held at 250˚C for 1 h. This process of heat treatment allows the P2O5 decompose and react with other raw materials before melting. Then the mixtures have transferred to a second furnace which held at 1100˚C for 15 min for melting (the melting temperature is depending on the composition of the base glass). Then the melt has poured into two mild steel split mould previously heated to 200˚C. Then the samples immediately transferred to an annealing furnace held at 210˚C, only for 1 min then the composite was allowed to cool gradually to room temperature to remove excess internal stress in the glass base and to initiate the nucleation of the nanoparticles. This adopted method allows producing small nanoparticles with narrow size distribution. The samples have been kept in desiccator to prevent possible attack by moisture. Some samples were polished to optical quality for optical measurements. For this purpose, ethylenglycole have been used to avoid the selective removal of any components from the surface layer.
3. Characterization
The obtained composites were characterized by different techniques. Thermal properties were studied using Shimadzu DTA-50 in a platinum crucible and nitrogen flux with flow rate of 10 ml/min to determine glass transition temperature (Tg), crystallization onset temperature (Tx), and crystallization peak temperature (Tc). The X-ray analysis was performed on a Philips Pw1373 X-ray diffractometer with Cu radiation (λ = 1.542 ºA) and Ni filter operated at 36 kV and 20 mA with a scanning rate of 2 deg min–1 in the angular range 20˚ to 70˚. The optical absorption spectra were recorded using a UV-VIS spectrophotometer (Unico UV-VIS double beam model 4862, USA) in the spectral range 200 - 1000 nm at room temperature.
4. Results and Discussions
Figure 1 shows the DTA measurements for the PNZL
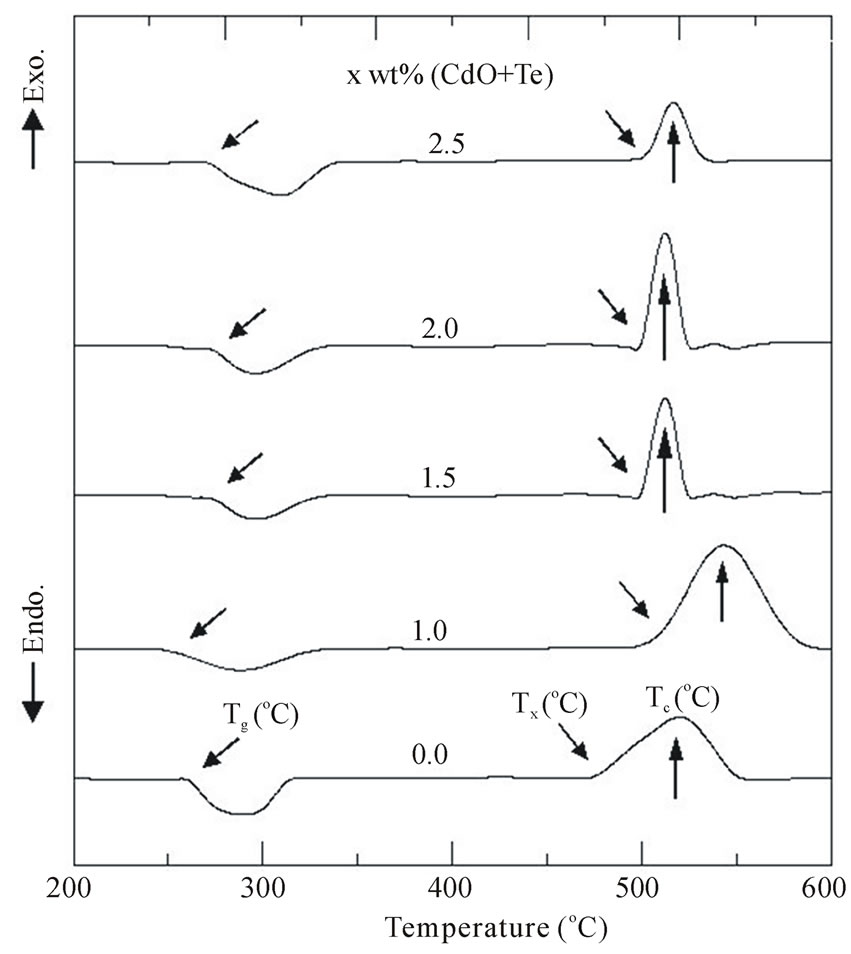
Figure 1. DTA curves of the as quenched P2O5-Na2OZnO-Li2O (PNZL) glass matrix doped with x wt% (CdO +Te) (x = 0.0, 1, 1.5, 2 and 2.5).
glass composite with different weight percent of CdO and Te. We have determined the glass transition temperature (Tg), crystallization onset temperature (Tx) and crystallization peak temperature (Tc). As we can see the thermal properties of the base glass are influenced by the doping of CdO and Te. The increasing of doping with CdO and Te leads to a slightly change in Tg and decrease of the Tx. As our cooling process was achieved only to 210˚C temperature and the glass base have low transition temperatures nearly 250˚C. This low difference in temperatures leads to a decrease in cooling rate in the range around the transition temperature and in turn cause of growing and crystallization of nanoparticles. So, we attributed the decrease in Tx with increasing the concentration of doping to the increase in resistance of heat transfer. We attributed the increase in resistance of heat transfer to the increase of the number of nanoparticles with increasing doping concentrations.
Figures 2 and 3 show the X-ray diffraction patterns of the as quenched PNL and PNZL glass doped with 2 wt% CdO and 2 wt% Te. The observed X-ray diffractions peak positions compared with JCPDS data file: 80-0089- Hexagonal and 75-2083 Cubic system are tabulated in Table 1. According to the peak positions the structural of as quenched PNL glass doped with (CdO+Te) is fit into hexagonal structure of CdTe. While for PNZL glass doped with (CdO+Te) the structural of CdTe nanoparticles is fit into hexagonal structure with little fractions
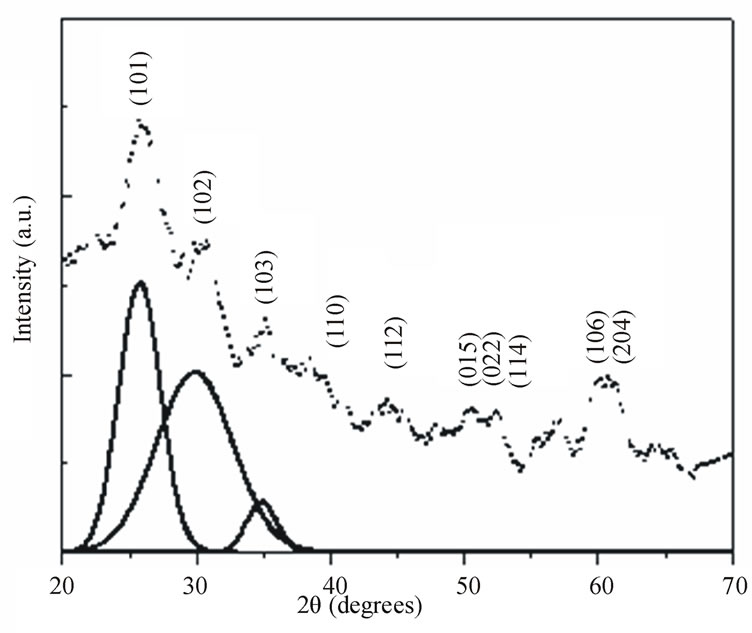
Figure 2. X-ray diffraction pattern of as quenched P2O5Na2O-Li2O (PNL) glass doped with 2 wt% (CdO+Te). Solid lines are the Gaussian fits to (101), (102) and (103) CdTe Hexagonal diffraction planes.
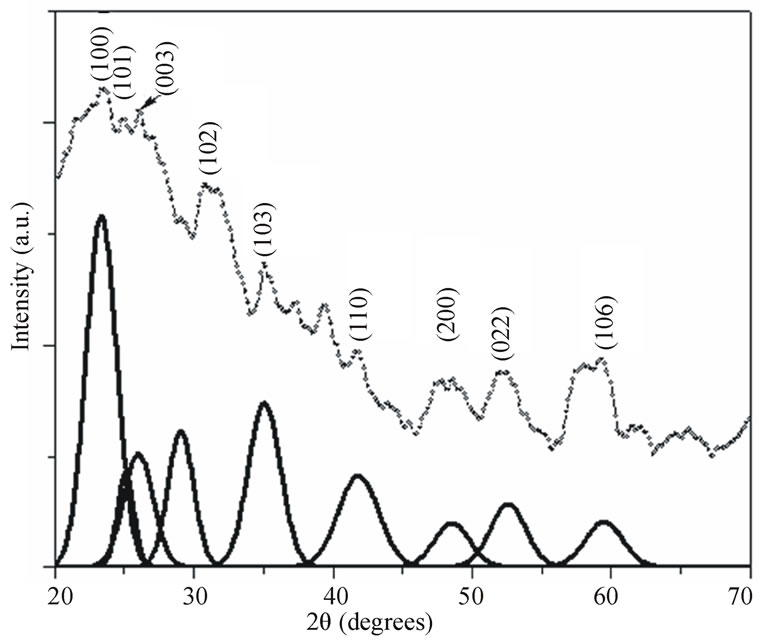
Figure 3. X-ray diffraction pattern of as quenched P2O5Na2O-ZnO-Li2O (PNZL) glass samples doped with 2 wt% (CdO+Te). Solid lines are the Gaussian fits to CdTe Hexagonal diffraction planes.
of cubic phase. In addition to, there are some diffraction lines which are related to TeO2 at the surface of CdTe nanoparticles for both of PNL and PNZL glasses samples. These results indicate that our quenching method leads to formation and crystallization of CdTe nanoparticles with some oxides on the surface of the nanoparticles. On the other hand, there is a remarkable difference between the two diffraction patterns of PNL and PNZL glass composite. The most important change is the appearance of peak at 2θ = 23.58 with high intensity which corresponding to (100) plane of Hexagonal CdTe in PNZL glass composite. This result revealed that the addition of ZnO in the expense of Na2O to the glass composition is strongly affecting the nanoparticles formation. We attributed this result to the high field strength of Zn2+ ions relative to Na+ ions will affect on the chain length of the glass structure which in turn affect on the growing and nucleation of the nanoparticles.
The sizes of CdTe nanoparticles in PNL and PNZL glasses doped with 2 wt% CdO and 2 wt% Te, are calculated using Debye–Scherrer equation [20],
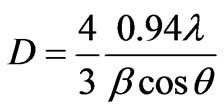 (1)
(1)
where D is the diameter of nanoparticles,  is the wavelength of X-ray radiation,
  is the angle of diffraction and
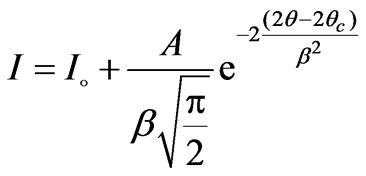
  is the full width at half maximum of the peak. To determine the full width at half maximum we have used Gaussian function to fit the diffraction lines as following:
 (2)
(2)
where I is the intensity of the diffraction line, Io is the offset,  is factor that controls the width of the peak and is related to full width at half maximum through
where  is the diffraction angle and
  is the diffracting angle that corresponds to the center of the peak. Using Equation (2), we have fitted the X-ray diffraction patterns of the samples. The Gaussian fitting of the diffraction lines for PNL and PNZL glass systems doped with 2% of CdTe are shown in Figures 2 and 3. The sizes of CdTe nanoparticles of as quenched PNL and PNZL glasses doped with 2 wt%( CdO+Te) were calculated using the (101) and (100) reflections, respectively. The calculated nanoparticles diameter using Equations (1) and (2) for the PNL and PNZL glass composite doped with 2 wt% CdO and 2 wt% Te are 2.56 and 3.14 nm, respectively.
As the CdTe have relatively large Bohr radius of approximately 7.5 nm which is greater than the diameter of the prepared nanoparticles, suggesting that quantum confinement substantially alter the optoelectronic properties of this material. We have used the optical absorption spectroscopy to analyze the influence of doping concentration and heat treatment temperature and duration on the light absorption mechanisms in CdTe nanoparticles doped glass. All the absorption spectra recorded at room temperatures for the present glass samples.
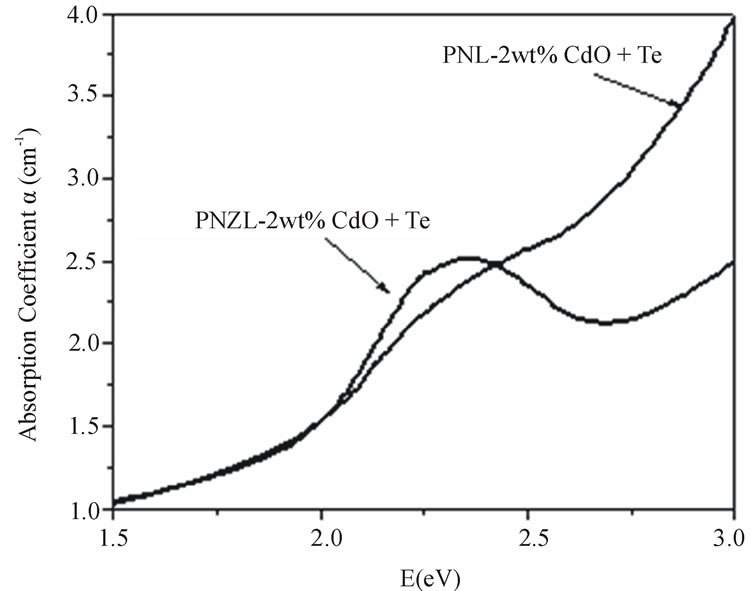
Figure 4(a) shows the comparison between the absorption spectra for the as quenched PNL and PNZL glass composite doped with 2 wt% CdO and 2 wt% Te. The absorption band of CdTe nanoparticles in PNL glass show an initial step at 2.42 eV. This unresolved peak at 2.42 eV is blue shifted by 0.99 eV from the bulk band gap of CdTe. While the absorption band of CdTe nano-
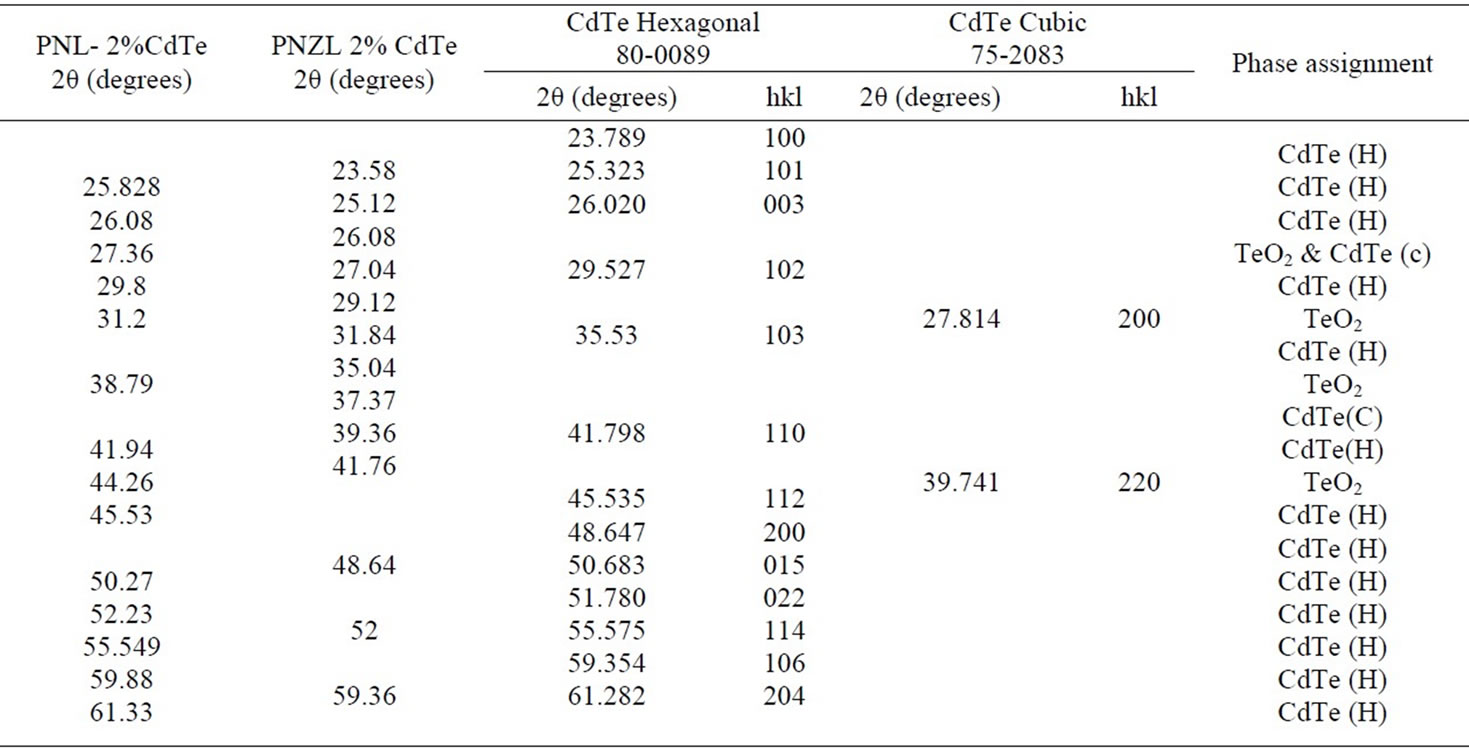
Table 1. Diffractions angle (2θ) and phase assignment of as quenched PNL and PNZL glass samples doped with 2% of (CdO+Te) compared with JCPDS 80-0089 of Hexagonal CdTe and JCPDS 75-2083 of Cubic CdTe .
 (a)
(a)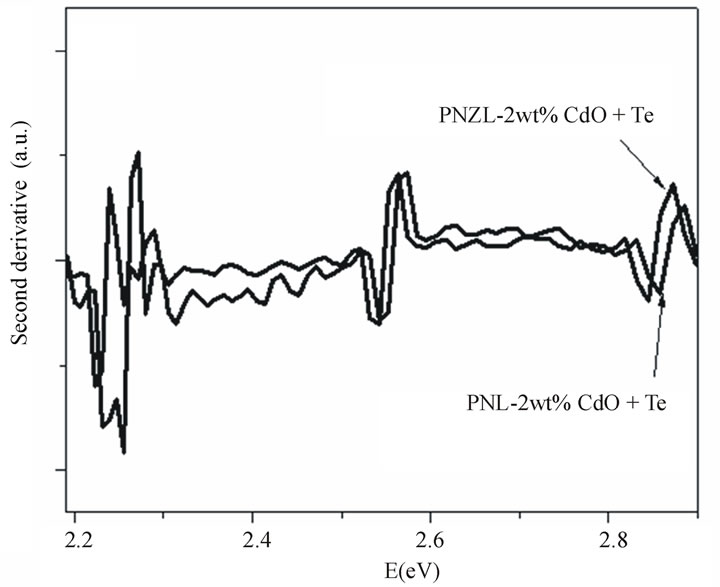 (b)
(b)
Figure 4. (a) Absorption spectra of as quenched P2O5Na2O-ZnO-Li2O (PNZL) and P2O5-Na2O-Li2O (PNL) glasses doped with 2 wt% CdO –2 wt%Te and (b) the second derivative of the absorption spectra in panel a in the range from 2.2 to 2.9 eV.
particles doped PNZL glass is clearly different as shown in Figure 4. A distinct peak appears at 2.34 eV and is blue shifted by 0.91 eV from the bulk band gap of CdTe. These results indicate a coexistence of nucleation and growth of nanopaticles during the quenching process due to the low rate of cooling around the transition temperature. To clarify the differences between the two absorption spectra we have calculated the second derivative as shown in Figure 4(b). The difference between the absorption spectra of CdTe nanoparticles in both of PNL and PNZL glasses reveal that the size of the nanoparticles formed in glass contains ZnO is greater than the particles formed in Zn free glass. These results indicate that the presence of ZnO in the host glass matrix leads to an increase in the number of CdTe nanoparticles nucleated during the quenching of the melt to room temperature. This result confirms the obtained results from X-ray analysis. It’s worth mention that there is a differrrence of the optical band gap of the two hosts of glass systems. This difference of the optical band gap of host glass leads to a change in the degree of confinement of the nanoparticles which in turn affect on the energy of the absorption spectra and oscillator strength.
Figure 5 shows the optical absorption spectra of the PNZL glass doped with different concentrations of CdO and Te. Clearly, with increasing the concentration of the semiconductor material the absorption coefficient of absorption maximum increases which indicates to the increasing number of nanoparticles. This result confirms the obtained result from differential thermal analysis. In addition the half width of the absorption bands increases with increasing the concentration of doping semiconductor, which indicates the increase in size distribution.
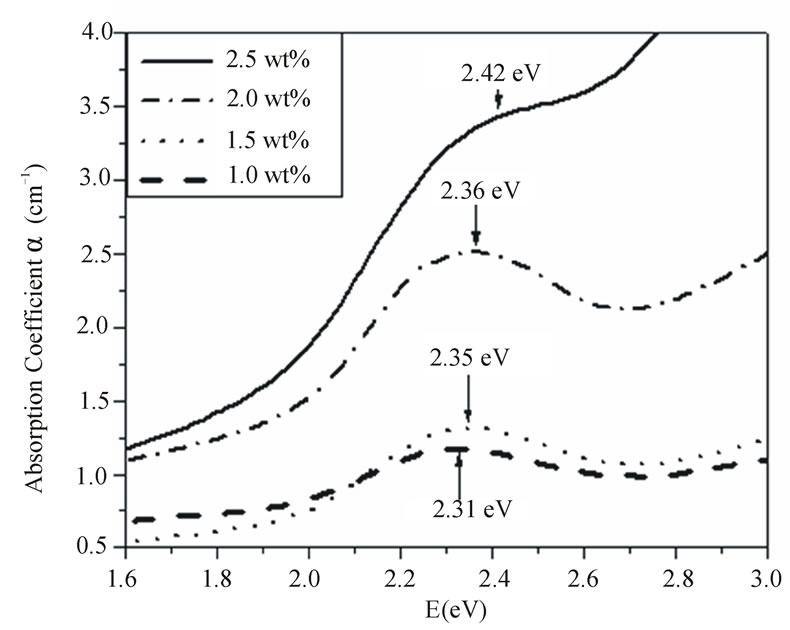
Figure 5. Absorption spectra of the as quenched P2O5-Na2O-ZnO-Li2O glass doped with x wt% (CdO+Te) (x = 1, 1.5, 2 and 2.5).
Besides, the increase in half width with increasing the concentration of the elemental semiconductor material the absorption maximum is little shifted to higher energy (as shown in Figure 5). This result indicates that there is an increase of the volume fraction of the small nanoparticles inside the whole distribution with increaseing the concentration of the elemental semiconductor material. This result is consistent with the previously reported theoretical results by M. P. Shepilov [21].
We have studied the effect of heat treatment duration and temperature on the optical absorption for different concentrations of CdTe doped PNZL glass matrix. For all spectra obtained in this study we have calculated the effective band gap of the CdTe nanoparticles from the energy dependence of the absorption coefficient near the band edge using the following relation [22]
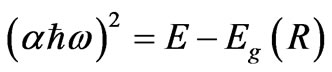 (3)
(3)
where α is the absorption coefficient, E = ħw is the photon energy and Eg(R) is the effective band gap energy of CdTe nanoparticles.
Figure 6 shows as an example of the relation between  as a function of photon energy and the linear fitting to this relation for as quenched PNZL glass matrix doped 2 wt% CdO and 2 wt% Te. The values of band gaps Eg(R) for the nanoparticles were determined by extrapolating the straight line of the linear fit to the energy axis at
 = 0.
= 0.
Figure 7 shows the effect of annealing temperature on the optical band gap for the different concentrations of doping. Obviously, the band gap decreases with increasing the annealing temperature but with a slow rate at low temperature range from 310˚C to 350˚C for the two samples doped with low concentrations 1.0% and 1.5%. Conversely, at higher temperature range from 350˚C to 380˚C the rate of decreasing the band gap increases with increasing the temperature. The low rate of changing the band gap at low temperatures may be due to the reduction of intrinsic defects at the nanoparticles glass interface [23] and can be explained as following. At these low temperatures we have two opposite effects on the energy of the absorption edge (1) effect of growing which lead to a shift of absorption to lower energy side and (2) the reduction of intrinsic defects which causes a slight shift to higher energy side. This two effects lead to the change in the energy of the absorption edge is small. On the other hand, for the two samples doped with low concentrations 1% and 1.5 % there is no remarakable change in the band gap for the annealing at high temperature greater than 380˚C. We attributed this result to the formation of oxide
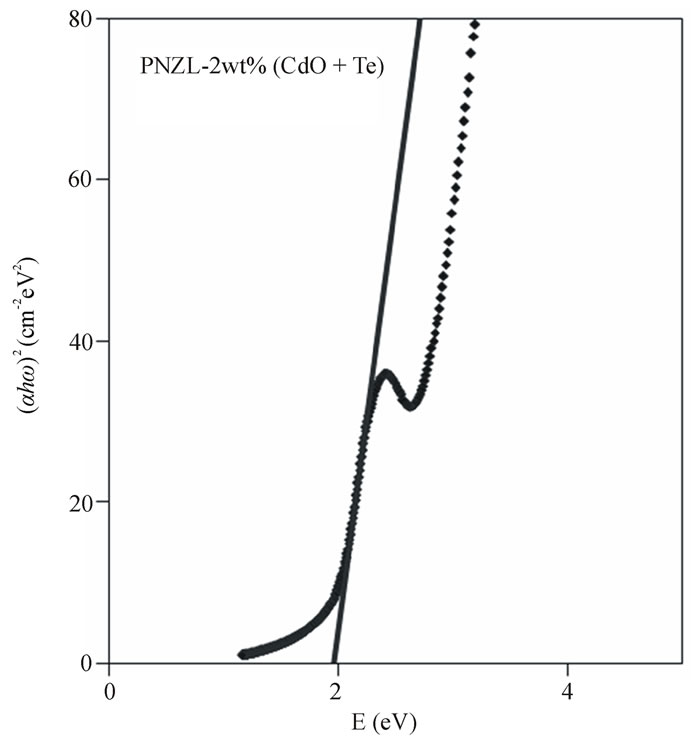
Figure 6. Variation of  as a function of photon energy and the linear fitting to this relation for as quenched PNZL glass matrix doped 2 wt% CdO and 2 wt% Te.
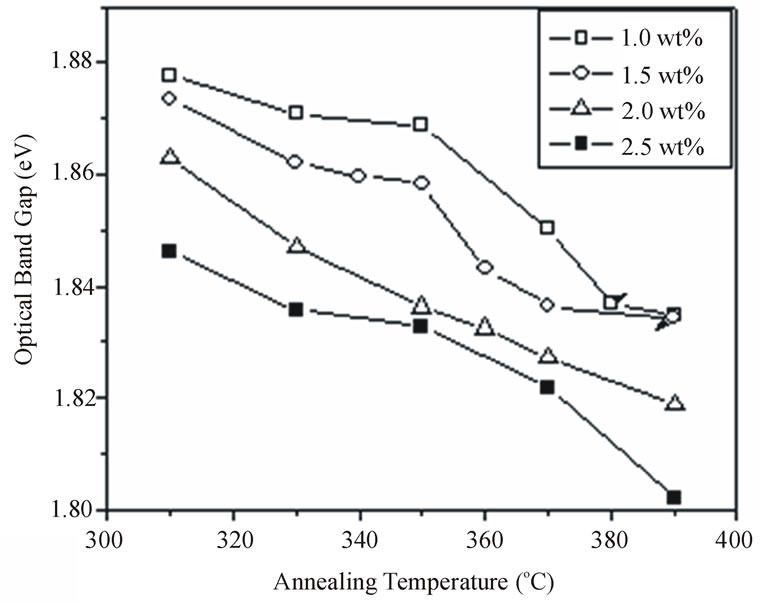
Figure 7. The effect of annealing temperature on the optical band gap for the different concentrations of CdTe nanoparticles embedded in PNZL glass matrix at constant annealing time 60 min.
layer at the surface of the nanoparticle. As our samples annealed in air, diffusion of ambient oxygen will takes place through glass matrix and the reaction of oxygen with CdTe at the nanoparticle surface will cause a formation of thin oxide layer on the surface of the nanoparticles.
Figure 8 shows the relation between the optical band gap energy and the duration of annealing at constant annealing temperature (350˚C). Clearly, with increasing the annealing time the optical band gap energy decreases. The rate of decreasing the optical band gap is relatively fast for the first 10 minutes after that the band gap energy gradually decreases with a slow rate with increasing the annealing time due to the decrease in supersaturation.
We have calculated the average sizes of the CdTe nanoparticle by the simple model of quantum confinement, within the effective mass approximation which predict the difference in the band gap with size of nanoparticle according to [24]
 (4)
(4)
where Eg(R) is the energy of the optical absorption edge of CdTe nanoparticles, Eg the is the energy of the optical absorption edge of bulk CdTe semiconductor, m* is electron and hole effective mass, h is Plank’s constant and R is the radius of the nanoparticles. The obtained results for nanoparticle sizes with different doping concentration prepared at different heat treatment temperature and duration are shown in Figures 9 and 10.
Also we have calculated the nanoparticle diameter from the energy of the absorption maximum. The difference
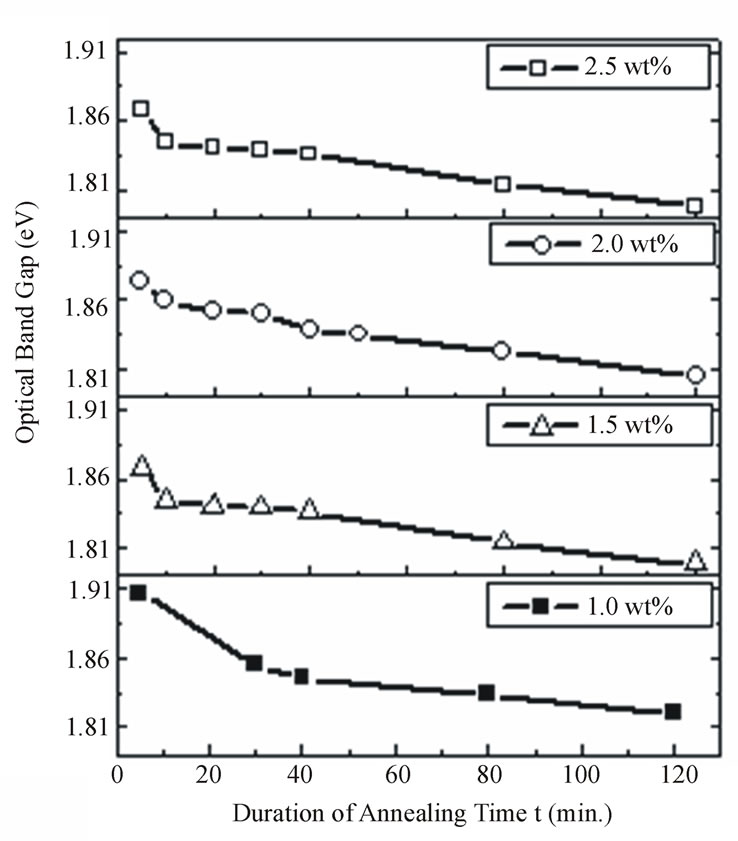
Figure 8. The effect of annealing duration on the optical band gap energy for different concentrations of CdTe nanoparticles embedded in PNZL glass matrix at constant annealing temperature 350˚C.
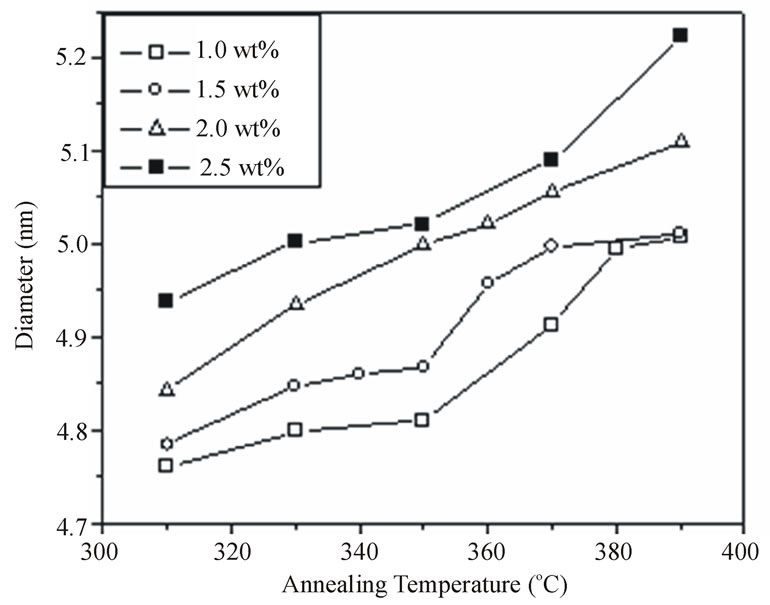
Figure 9. The effect of annealing temperature on the nanoparticles size in diameter for the different concentrations of CdTe nanoparticles embedded in PNZL glassmatrix at constant annealing time 60 min.
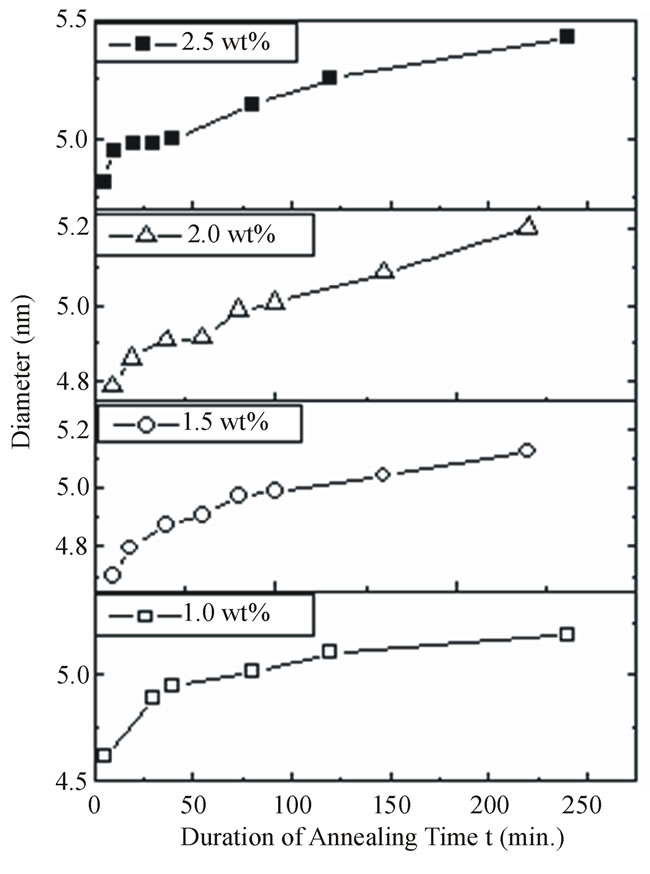
Figure 10. The effect of annealing duration on the CdTe nanoparticles size in diameter embedded in PNZL glass matrix at constant annealing temperature 350˚C.
between the particle size calculated from the band edge and that one calculated from the energy of first absorption maximum gives the width of size distribution (D1/2) [25]
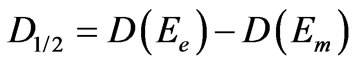 (5)
(5)
where Ee and Em are the band edge energy and the energy of the first absorption maximum, respectively. D1/2, can be taken to be twice the standard deviation s if we assuming the Gaussian distribution of nanoparticles and Dm will approximate the mean nanoparticle diameter. We then define the size polydispersity index for each absorption spectrum [26]
size polydispersity index = 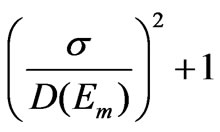 (6)
(6)
The calculated values of size polydispersity index for all samples in this work have values between 1.03 and 1.08 which indicates that the nanoparticles have very narrow size distribution.
We have also calculated the activation energy for the various concentration of the doping. Knowledge of the activation energy gives important information about the growing of the nanoparticles.
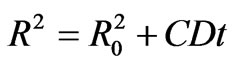
Figure 11 shows the relation between the nanoparticle radii calculated from the absorption edge and the square root of the heat-treatment duration time for different concentration of semiconductor materials and at constant heat treatment temperature (350˚C). A least-square straight-line fit to R against t1/2 data also are shown in Figure 11. The straight line is extrapolated to obtain the initial value of particle radius (R0) as intercepts with t1/2 = 0 line.
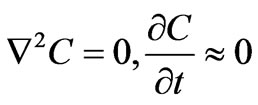
In diffusion limited growth of the particles, all nuclei are assumed to be extrinsic and created at t = 0 prior to the heat treatment during quenching the melt to room temperature. According to the diffusion-limited growth, for the case of quasi static diffusion around a particle
and the radius of the particles increases as [6]
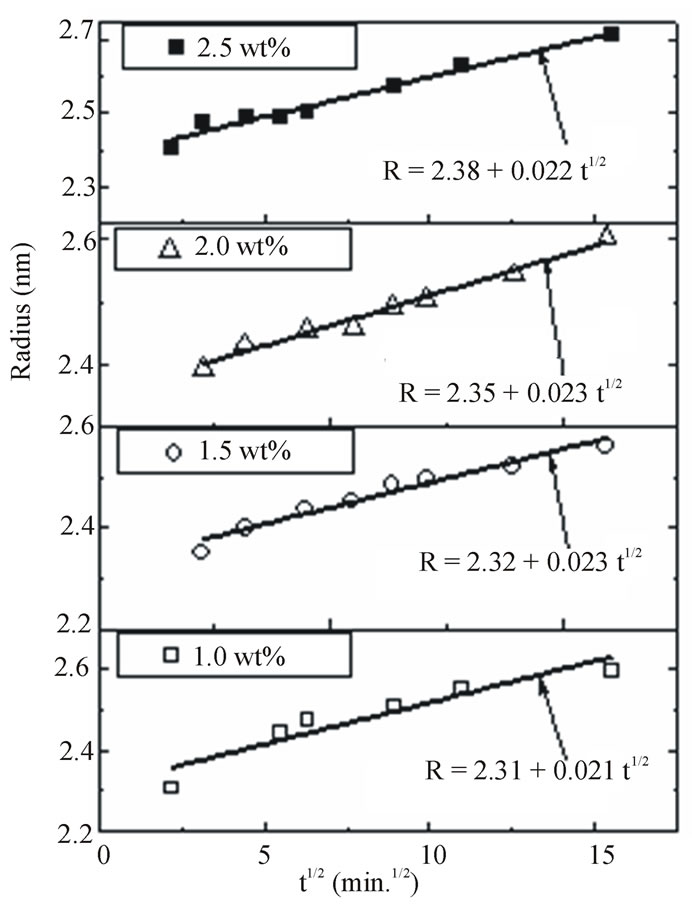
Figure 11. Nanoparticles radius R against the square root of heat treatment time for different concentration of CdTe doped PNZL glass matrix at constant annealing temperature (350˚C). Solid lines and equations show a leastsquares fit to the data.
 (7)
(7)
 (8)
(8)
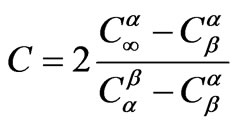
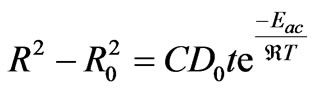
where D is the diffusion constant, t is heat treatment time,  is the concentration of limiting reactant in particles (β phase),
  is the concentration of limiting reactant in glass (α phase),
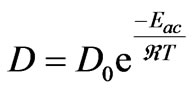
  is the concentration of limiting reactant at particle-glass interface (equilibrium concentration). The diffusion coefficient at constant pressure is correlated with temperature through an Arrhenius relationship,
 (9)
(9)
where D0 is a frequency factor, Eac. is molar activation energy, T is heat treatment and  is universal gas constant (
 = NAKB = 8.3415 × 10⁻³ kJ·mol–1K–1). Combining Equations (7) and (9) we find the following equation:
 (10)
(10)
Take the natural logarithm of both sides of Equation (10) then
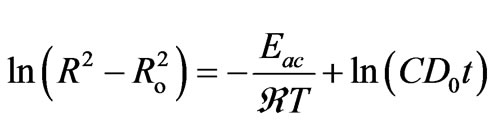 (11)
(11)
Figure 12 shows the relation between 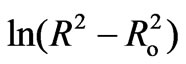 and 1000/T (K–1) for different doping concentration of semiconductor materials (CdTe) at constant heat treatment time (60 min). As the second term in Equation (11) is constant, so, the activation energy of the diffusion is calculated from the slope of the least-squares fit to data. Figure 13 shows the estimated activation energy of diffusion as a function of different concentration of CdTe in glass matix. The value of activation energy about 43.8 kJ/mol for 1 wt% concentration of CdTe and decreased with increasing the concentration of doping materials. To the best of our knowledge, this is the first work of activation energy of growth of nanoparticles in phophasate glass matrix. The value of activation energy about 43.8 (kJ/mol) is very close to the previously reported value of activation energy of growing CdS nanoparticles which was equal (0.55eV) or 53 kJ/mol [27], this lower value of activation energy of growing CdTe in phosphate glass matrix reflects the higher solubility of semiconductor components in this type of glass matrix. The decrease of activation energy with increasing the doping concentrations also confirms the increase in solubility of semiconductor components and increase in diffusion coefficients in our glass matrix. On the other hand this value of activation energy is very small relative to the previously reported value of CdTe in commerciall schott
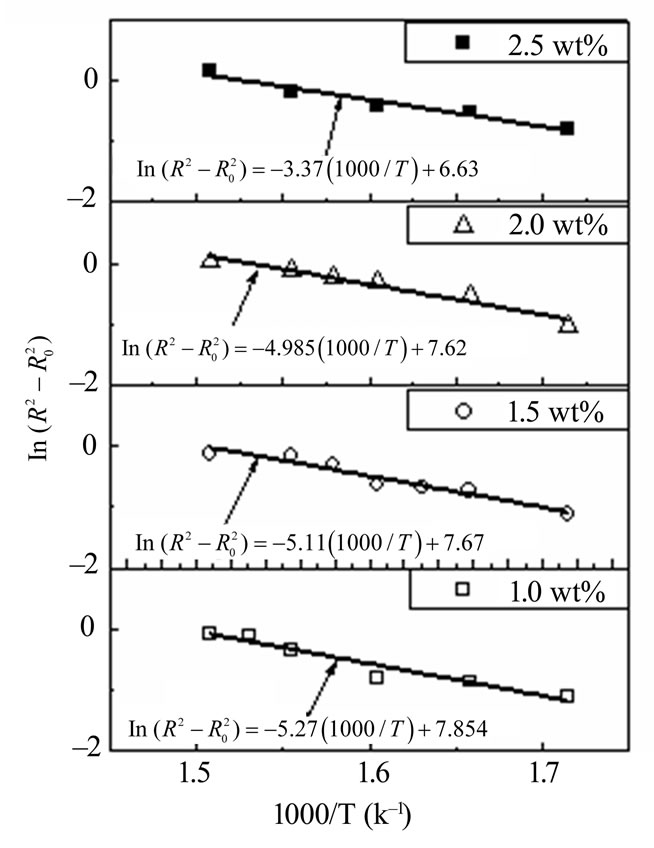
Figure 12. The relation between 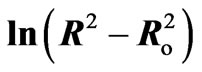 against 1000/T(K) for different doping concentration of semiconductor materials (CdTe) embedded in PNZL glass matrix at constant heat treatment time (60 min). Solid lines and equations show a leastsquares fit to the data.
Figure 13. The activation energy of diffusion as a function of different concentration of CdTe nanoparticles embedded in PNZL glass matrix.
filters glass (SiO2-K2O-ZnO-B2O3) which was 170 kJ/mol [13]. The annealing temperatures for the growing of nanoparticles are (310˚C - 390˚C) which experienced here are less than those used for silicate glass (575˚C - 675˚C). Besides, the annealing time for growing the nanoparticles is very short due to the low viscosity of phosphate glass at temperatures above the glass transition temperature [15,18]. This low viscosity leads to faster diffusion in this kind of glass which in turn affect on the value of activation energy.
5. Conclusions
We have adopted prepration method of a novel system of CdTe embedded in phosphate glass matrix. The prepared samples characterized by X-ray diffraction, differential thermal analysis (DTA) and optical absorption spectroscopy. The X-ray diffraction study showed the prepared nanoparticles are crystallized in hexagonal structure. Also, X-ray analysis showed that the formation of the nanoparticles is strongly affected by the incorporation of ZnO into the glass matrix. On the other hand, we have studied the effect of concentration, annealing duration and temperatures on the band gap and sizes of nanoparticles through the optical absorption spectroscopy. Furthermore, we have calculated size polydispersity index from the absorption spectra and found it has values between 1.03 and 1.08 which indicates that the CdTe nanoparticles have very narrow size distribution. Finally, we have estimated the activation energy of diffusion for the growing of CdTe in phosphate glass matrix and yields very low value as compared to CdTe prepared in silicate glass matrix.
REFERENCES
- L. Brus, “Electronic Wave Functions in Semiconductor Cluster: Experiments and Theory,” The Journal of Chemical Physics, Vol. 90, No. 12, 1986, pp. 2555-2560. doi:10.1021/j100403a003
- M. V. Rama Krishna and R. A. Friesner, “Quantum Confinement Effects in Semiconductor Clusters,” The Journal of Chemical Physics, Vol. 95, No. 11, 1991, pp. 8309- 8322. doi:10.1021/j100403a003
- S. Wageh, S. L. Zhao and X.-R. Xu, “Growth and Optical Properties of Colloidal ZnS Nanoparticles,” Journal of Crystal Growth, Vol. 255, No. 3-4, 2003, pp. 332-337. doi:10.1016/S0022-0248(03)01258-2
- S. Wageh, S.-M. Liu, T. Y. Fang and X.-R. Xu, “Optical Properties of Strongly Luminescing MercaptoaceticAcid-Capped ZnS Nanoparticles,” Journal of Luminescence, Vol. 102-103, 2003, pp. 768-773. doi:10.1016/S0022-2313(02)00639-7
- S. Wageh, S.-M. Liu and X.-R. Xu, “Effect of Aging on CdSe Nanocrystals,” Physica E, Vol. 16, No. 2, 2003, pp. 269-273. doi:10.1016/S1386-9477(02)00694-X
- S. Wageh, “Raman and Photoluminescence Study of CdSe Nanoparticles Capped with a Bifunctional Molecule,” Physica E, Vol. 39, No.1, 2007, pp. 8-14. doi:10.1016/j.physe.2006.12.003
- S. Wageh and M. H. Badr “Cd1-xZnxS Nanoparticles Stabilized by a Bifunctional Organic Molecule,” Physica E, Vol. 40, No. 7, 2008, pp. 1157-1163.
- J. Warnock and D. D. Awschalom, “Quantum Size Effects In Simple Colored Glass,” Physical Review B, Vol. 32, No. 8, 1985, pp. 5529-5531. doi:10.1103/PhysRevB.32.5529
- B. G. Potter and J. H. Simmons, “Quantum Size Effects in Optical Properties of CdS-Glass Composites,” Physical Review B, Vol. 37, No. 18, 1988, pp. 10838–10845. doi:10.1103/PhysRevB.37.10838
- N. F. Borrelli, D. W. Hall, H. J. Holland and D. W. Smith, “Quantum Confinement Effects of Semiconducting Microcrystallites in Glass,” Journal of Applied Physics, Vol. 61, No. 12, 1987, pp. 5399-5409. doi:10.1063/1.338280
- J. A. Medeiros Neto, L. C. Barbosa, C. I. Cesar, O. L. Alves, F. Galembeck, “Quantum Size Effects on CdTexS1−x Semiconductor-Doped glass,” Applied Physics Lettersers, Vol. 59, 1991, p. 2715. doi:10.1063/1.105894
- L. C. Barbosa, V. C. S. Reynoso, A. M. de Paula, C. R. M. de Oliveira, O. L. Alves, A. F. Craievichc, R. E. Marottia, C. H. Brito Cruz and C. L. Cesar, “CdTe Quantum Dots by Melt Heat Treatment in Borosilicate Glasses,” Journal of Non-Crystalline Solids, Vol. 219, 1997, pp. 205-211. doi:10.1016/S0022-3093(97)00330-X
- M. H. Yukselici, Allahverdi, “Solid-Phase Precipitation of Cdte Nanoparticles in Glass,” Physica Status Solidi, Vol. 236, No. 3, 2003, pp. 694-701.
- A. A. Lipovskii, E. V. Kolobkova and V. D. Petrik, “Formation of II–VI Nanocrystals in a Novel Phosphate Glass,” Journal of Crystal Growth, Vol. 184-185, 1998, p. 365.
- S. Wageh, A. A. Higazy, A. H. Khafagy and A. S. Eid, “Synthesis and Characterization of CdTe Nanoparticles embedded in Novel Glass Matrix,” International Journal of Nanoscience, Vol. 8, No. 6, December 2009, pp. 605- 610. doi:10.1142/S0219581X09006468
- S. Wageh, S. L. Zhao and Z. Xu, “An Optical and Structural Investigation into CdTe Nanocrystals Embedded into the Tellurium Lithium Borophos-phate Glass Matrix,” Science in China Series G: Physics, Me-chanics and Astronomy, Vol. 53, No. 5, May 2010, pp. 818-822. doi:10.1007/s11433-010-0178-y
- Wageh Swelm, Anwar Higazy and Mohammed Algradee, “Growth and Characterization of Novel System of Nanoparticles Embedded in Phosphate Glass Matrix,” World Journal of Condensed Matter Physics, Vol. 1, No. 2, 2011, pp. 24-32. doi:10.4236/wjcmp.2011.12005
- S. Wageh, A. S. Eid, S. El-Rabaiea and A. A. Higazy, “CdSe Nanocrystals in Novel Phosphate Glass Matrix,” Physica E, Vol. 40, No. 10, 2008, pp. 3049-3054. doi:10.1016/j.physe.2008.04.008
- S. Wageh, A. S. Eid, S. El-Rabaie and A. A. Higazy, “Strong Confinement of PbSe Nanocrystals in Phosphate Glass,” Physica E, Vol. 41, No. 7, 2009, pp. 1157-1163. doi:10.1016/j.physe.2009.01.011
- A. Guinier, “X-Ray Diffraction in Crystals, Imperfect Crystals, and Amorphous Bodies,” W. H. Freeman and Company, San Francisco and London, 1963.
- M. P. Shepilov, “A Model for Calculation of Isothermal Kinetics of the Nucleation-and-Growth Type Phase Separation in the Course of One-Step Heat Treatment,” Journal of Non-Crystalline Solids, Vol. 208, No. 1-2, 1996, pp. 64- 80. doi:10.1016/S0022-3093(96)00499-1
- Y. Wang, A. Suna, W. Maheler and R. Kasowski, “PbS in Poly-mers, From Molecules to Bulk Solids,” Journal of Chemical Physics, Vol. 87, No. 12, 1987, pp. 7315-7322. doi.org/10.1063/1.453325
- H. Mathieu, T. Richard, J. Allegre, P. Lefebvre and G. Arnaud, “Quantum Confinement Effects of Cds Nanocrystals in a Sodium Borosilicate Glass Prepared by the Sol Gel Process,” Journal of Applied Physics, Vol. 77, No. 1, 1995, pp. 287-293 doi:10.1063/1.359389
- A. L. Efros, Al. L. Efros, “Interband Absorption of Light in a Semiconductor Sphere, Soviet Physics-Semiconductors. Vol. 16, No. 7, 1982, pp. 772-775.
- H. J.Watzke and J. H. Fendler, “Quantum Size Effects of in Situ Generated Colloidal Cadmium Sulfide Particles in Dioctadecyldimethylammonium Chloride Surfactant Vesicles,” Journal of Physical Chemistry, Vol. 91, No. 4, 1987, pp. 854-861. doi:10.1021/j100288a019
- M. Moffitt and A. Eisenberg, “Size Control of Nanoparticles in Semiconductor-Polymer Composites. 1. Control via Multiplet Aggregation Numbers in Styrene-Based Random Ionomers Control via Multiplet Aggregation Numbers in Styrene-Based Random Ionomers,” Chemistry of Materials, 1995, Vol. 7, No. 6, pp. 1178-1184. doi:10.1021/cm00054a017
- T. M. Hayes, L. B. Lurio and P. D. Persans, “Growth and Dissolution of CdS Nanoparticles in Glass,” Journal of Physics: Condensed Matter, Vol. 13, No. 3, 2001, pp. 425- 432. doi:10.1088/0953-8984/13/3/305