Applied Mathematics
Vol.3 No.8(2012), Article ID:21478,8 pages DOI:10.4236/am.2012.38140
FEM Based Study of Concentration of Proliferating Cell in Brain Tumor
Department of Mathematics, Sagar Institute of Research and Technology, Bhopal, India
Email: sknema9@indiatimes.com, vinodpsaxena@gmail.com
Received May 8, 2012; revised July 6, 2012; accepted July 14, 2012
Keywords: Deterministic Model; Gliomas; White Matter; Gray Matter; Proliferation; Motile Cells
ABSTRACT
In this chapter we have developed a deterministic model of growth of abnormal cell concentration in a human subject at different positions. The diffusion-reaction Equation has been applied to satisfy growth dynamics. The whole tumor region is divided into layers which, with the growth of tumor form necrotic, quiescent and region of proliferating of tumor cells. Finite element method for one dimension has been employed for solving the Equations. Here we have taken into account the cellular motility along with proliferative growth ,which is particularly required in case of some of the brain tumors, where motility of gliomas cells differ widely in gray and white matter.
1. Introduction
The investigations have shown that the brain cancer cells spread preferentially, along the paths of elevated water diffusion; such as along nerve fiber bundles and this can be measured by magnetic resonance (MR)-diffusionweighted imaging (DWI) (see [1]). The migration of cancer cells away from the primary tumor can be predicted using computational models that incorporate DWI information. The invention, therefore applies DWI and models of cell migration to develop appropriate nonsymmetric margins for radiation treatment of malignant brain tumors. We investigate here the case of Gliomas, which consist of highly motile cells that can proliferate as well as migrate with different diffusivity in different directions [2-4]. These factors make its growth pattern elusive to be captured by any advanced techniques available so far. Its invasiveness makes it almost impossible to define the growth rate as a classical volumedoubling time. Diffusive nature of these tumors inhibits the apparent boundary between cancerous and healthy regions, therefore the conventional therapy, like surgical resection and radiotherapy become ineffective. The current imaging techniques are able to see only a part of the total tumor. We have tried to capture growth pattern based on two parameters i.e. growth rate and coefficient of diffusivity, by taking different values of them. We have tried to apply the concentration level of oxygen at different part of brain to assess the actual number of tumor cells in the second part of this paper.
2. Mathematical Modeling
Growth of an infiltrating glioma was provided by Murray [5]. He formulated the problem as a conservation Equation.
The rate of change of tumor cell population = the diffusion motility of tumor cells + the net proliferation of tumor cells.
Then the growth of cell can be captured in single one partial differential Equation that is, diffusion-reaction Equation. Where
 (1)
(1)
p = Relative density of proliferating cell at a given time t. α = Net growth rate of proliferating cells which depends on the concentration of nutrient. ![]() Distance from the beginning position of tumor.
Distance from the beginning position of tumor.
 = Diffusion coefficient of the cells in the interstitial fluid.
  describes the invasion of tumor cells by means of a Brownian motion, which is characterized by the diffusion coefficient
 . The second term in the Equation,
  describes the rate of growth the proliferation of tumor cells.
Boundary-Conditions.
 (2)
(2)
 . (3)
. (3)
3. Finite Element Discretization
Comparing the Equation (1) with Euler-Lagrange differential Equation given as
 (4)
(4)
Here, ![]() =
= .
.
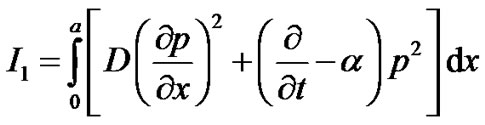
The corresponding variation functional of PDE (1) is obtained as
 (5)
(5)
Equation (1) is equivalent to (5) for optimum value of I (see [5]). Now to apply finite element one dimensional approach, the tumor region is divided into three linear parts as shown in Figure 1. This approximates the solution in each element. The higher degree shape functions have not been taken due to micro-level dimensions.
Descretization of tumor region in three linear parts is as follows
 (6)
(6)
Assumptions are made as given in Table 1. Here p0 and p3 are determined, while nodal values of p1 and p2 are to be determined parameters A and B are determined with the help of above assumptions for each part in R, the shape functions for each linear element are given below in Table 2.
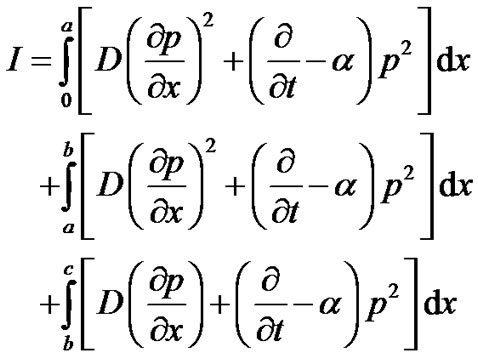
Element wise variational integrals are as following In the region 
 (7)
(7)
In the region 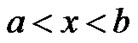
 (8)
(8)
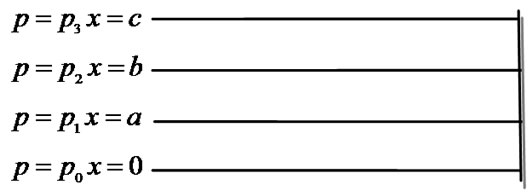
Figure 1. Linearly descretized region of tumor.
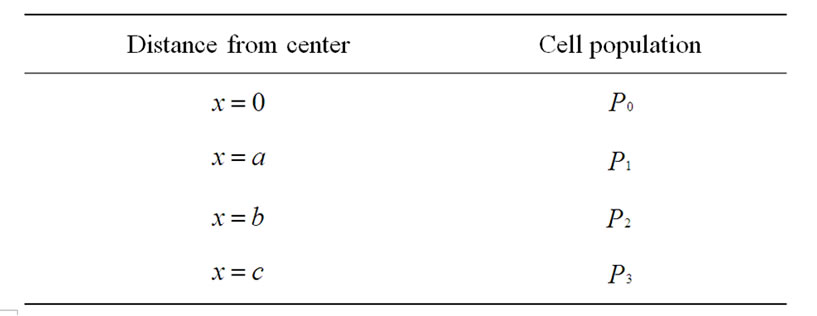
Table 1. Cell populations at nodes.

Table 2. Elements-wise shape functions.
In the region 
 (9)
(9)
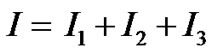
Substituting for p, from Table 1 and Table 2 in Equations (7), (8) and (9) respectively. On adding, Equations (7), (8) and (9), we get
 (10)
(10)
 (11)
(11)
Integrating Equation (11) with respect to x, we get
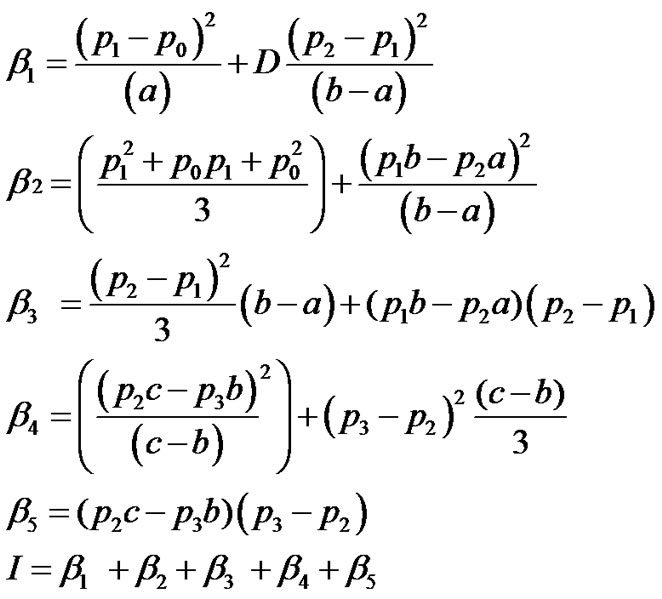 (12)
(12)
For optimization, differentiating I, with respect to  and
and  and equating the result to zero, we obtain following Equations,
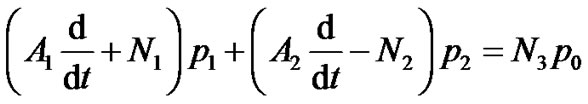 (13)
(13)
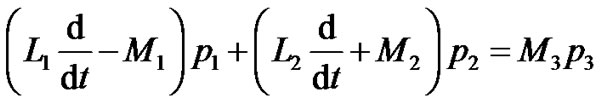 (14)
(14)
where  are given in Appendix-1.
Above first order linear Equations are solved by normal differential Equation solution.
Solutions are of the form
 (15)
(15)
 (16)
(16)
 (17)
(17)
Here ![]() and
and  are constants of integration, which are determined by the following conditions 1)
2)  (18)
(18)
Finally we get
 (19)
(19)
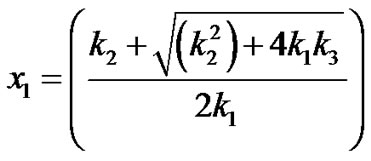
By solving Equation (13) or (14) for  after substituting
  from Equations (19) in Equation (13) or (14), we get
Therefore
 (20)
(20)
Finally, substituting  and
and  from Equations (19) and (20) respectively into shape functions of the respective elements. We obtain the Equations governing cell densities at each descretized linear region. These Equations are as followCell density in the region 0 < x < a
 (21)
(21)
Cell density in the region a < x < b
Cell density in the region b < x < c
 (23)
(23)
4. Parameter Values
The diffusion coefficient of oxygen in the brain is known to be . Oxygen consumption rate constant of cancer cells has been experimentally determined to be = 6.25 × 10⁻¹⁷ mole/cell/sec (see [6]).
We have assumed the threshold concentration, 
where  mole/gm of tissue (see [6]).
The parameter values given above are only approximate, and much manipulation of the existing data is required to derive these estimates.
5. Discussion
5.1. Cell Densities Patterns at Different Distance Away from Center of Tumor
Our findings are shown in Figures 2-7. We assumed a single tumor cell at the , directly from there, we have applied diffusion model as diffusion is random walk, inherent even in a single cell. We try to analyze the pattern of density of tumor cells at point
  then from 0.1 to 0.2 and 0.2 to 0.3 mm positions and tried to understand the elusive nature of pattern of growth, as is shown in Figure 3.
We have investigated growth pattern at each of the three regions, mentioned above with variable growth rate and diffusive coefficient. Growth rate α is measured in cell/day and coefficient of diffusivity D is in mm2/sec.
Figure 2 shows the growth pattern near the origin of
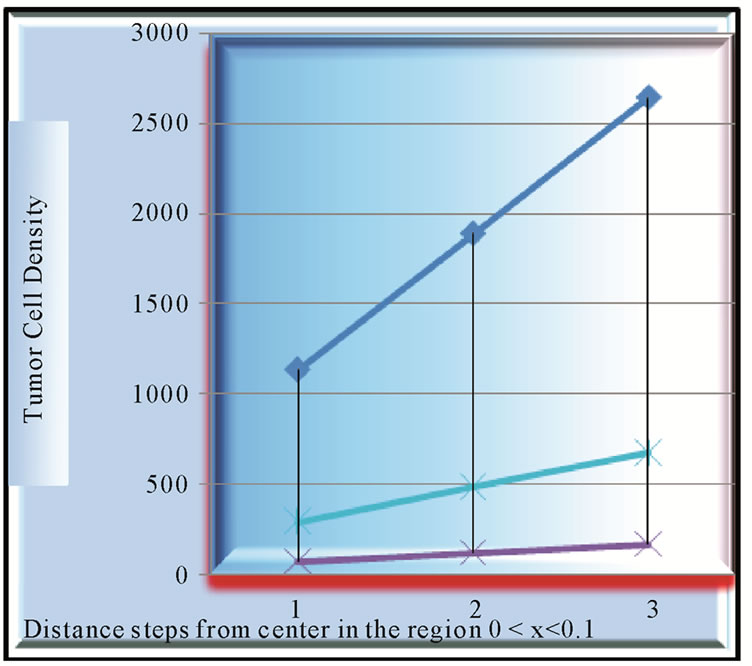
Figure 2. Analysis of growth of tumor with the variation in diffusivity coefficient of cells and growth rate in 0 < x < 0.1 mm region in first tumor with growth rate = 0.058, D = 0.0018 and 2nd tumor with growth rate = 0.058, D = 0.0024.
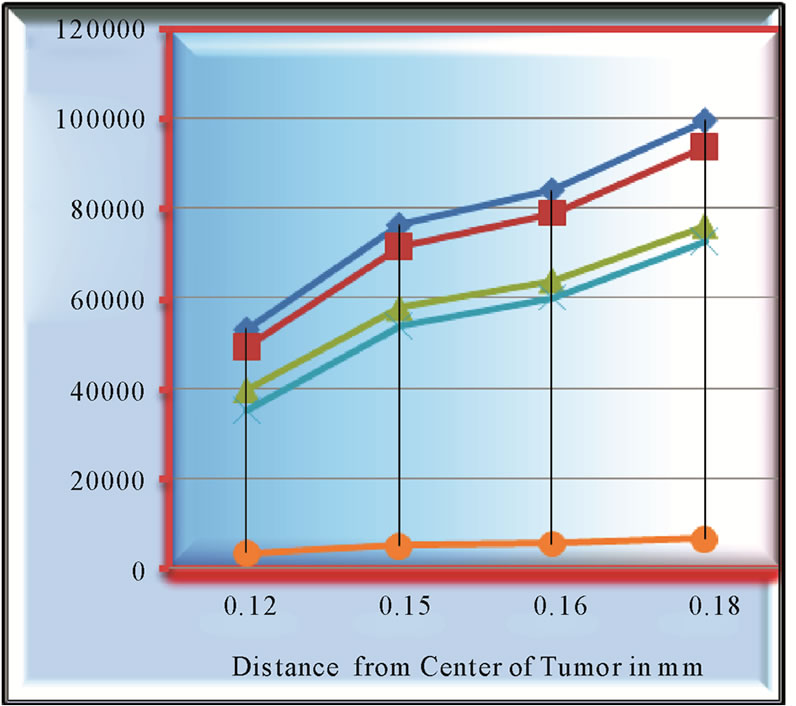
Figure 3. Growth patterns of four tumors at (1) growth rate = 0.058, D = 0.0018 (2) growth rate = 0.058, D = 0.0024 (3) growth rate = 0.040, D = 0.0018 (4) growth rate = 0.040, D = 0.0012.
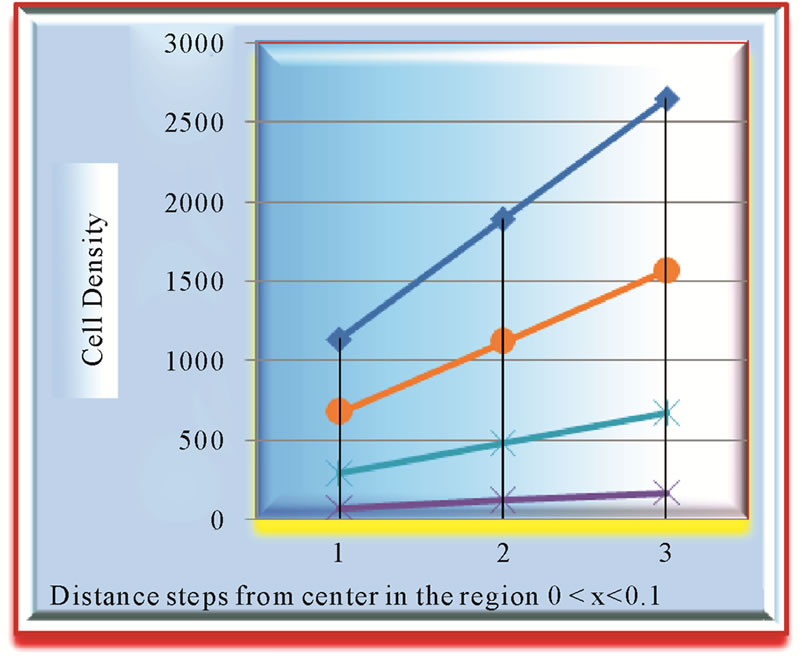
Figure 4. Analysis at growth rate 0.045, comparison of growth patterns of two tumors (1) diffusivity coefficient D = 0.0012 and (2) diffusivity coefficient D = 0.0018.
tumor in the region . Here growth pattern of three tumors
 ,
,  ,
,  have been compared to judge the interplay of diffusivity with growth rate.
1) Tumor ;
;
2) Tumor ;
;
3) Tumor .
.
By comparing the growth pattern of  tumors, where
  tumor falls below in cell concentration not only the cell concentrations of
  but, that of
  also, whose growth rate is far below at
  than that of B, we get insight, as to how, the represented density of cells may play a flaw.
In the same Figure 2 the tumors  and
and , having

Figure 5. At growth rate 0.055, comparison of growth patterns of two tumors (1) diffusivity coefficient D = 0.0012, and (2) diffusivity coefficient D = 0.0018.
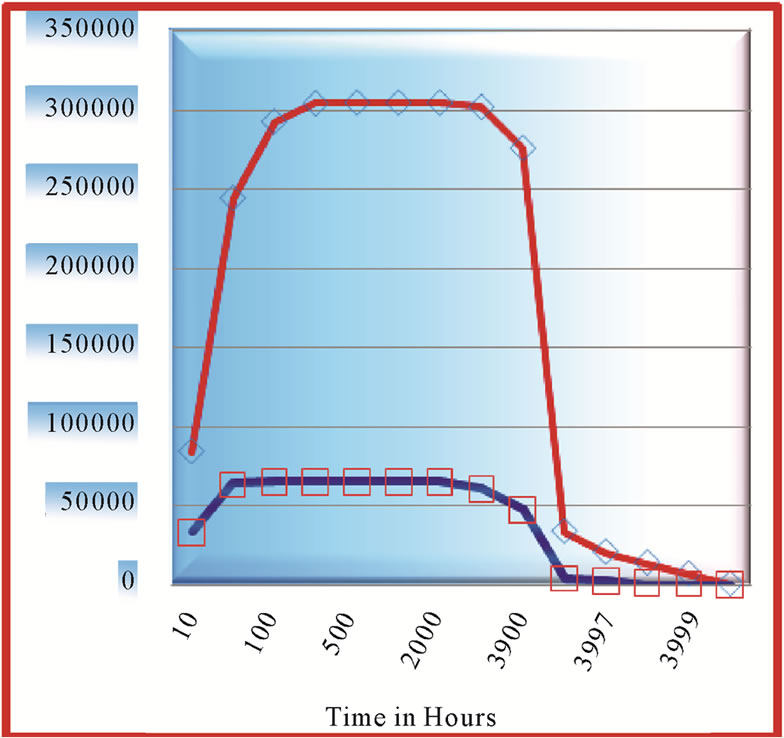
Figure 6. At growth rate 0.045, comparison of growth patterns of two tumors (1) diffusivity coefficient D = 0.0012, and (2) diffusivity coefficient D = 0.0018.
same diffusivity but different growth rates have been compared for their cell growth patterns. Here results are commensurate with the obvious fact that the tumor, with higher growth rate, progresses faster.
The growth patterns of tumors ,
,  are found to be same. The point to be marked here, is that, both tumors differ only marginally in their ratios of α/D (growth rate to coefficient of diffusivity) with tumor
 (appox). Figure 3 emphasizes this point more resoundingly, where growth
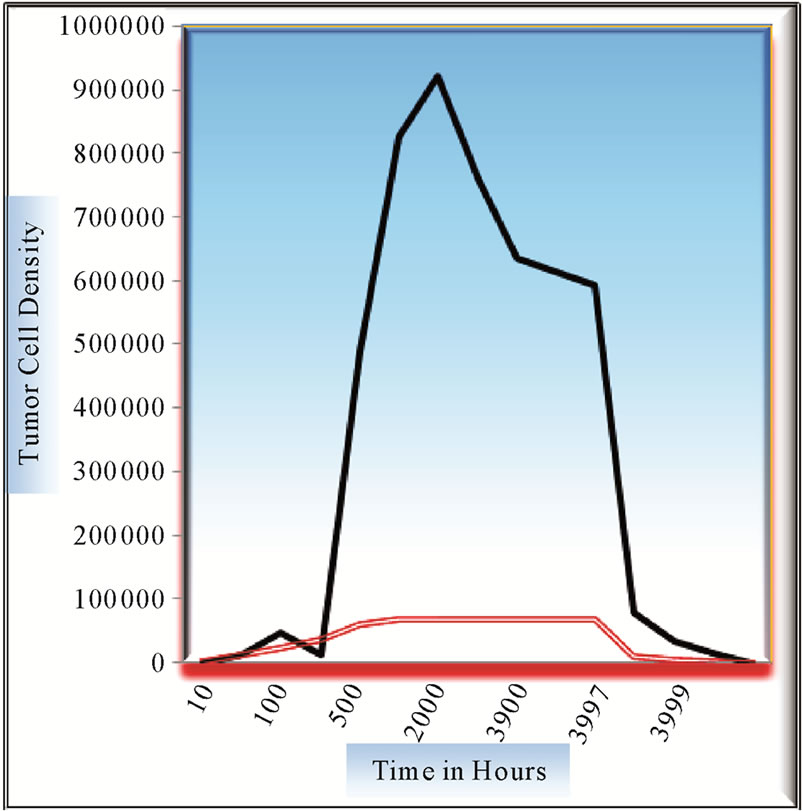
Figure 7. Comparison of growth patterns at x = 0.1 and x = 0.2 mm distance from center of tumor with growth rate = 0.045 and diffusivity coefficient = 0.0076.
patterns of four tumors have been evaluated.
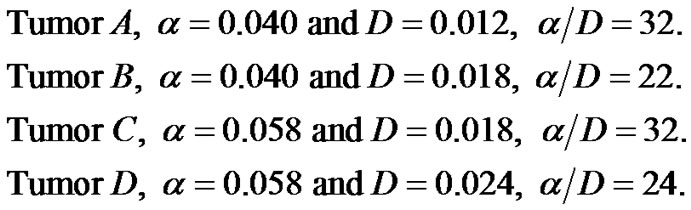
Growth pattern of A and C show resemblance while same can be observed for B and D tumors. Obviously, parameter α/D prove to be a deciding factor. We further analyze the growth pattern of same tumors in Figure 4. at  distance from center of tumor and here, we find a large difference in their cell concentrations at the corresponding positions. The tumor observed are (1) with growth rate at
  and at
  and (2) with growth rate
  with
with . The slower growth is registered at the later stage of growth (invariable in all tumors) as compared to that, in the beginning phase of tumor growth.
Although actual tumor with higher growth rate is more lethal then that at lower progressing one but any CT scan may pick up just otherwise as is obvious from Figure 4.
5.2. Comparison of Growth at a Little Higher Growth Rate
In Figure 5 peak concentrations of cells of two tumors at growth rate a equal to 0.055 and with diffusivity coefficients,  are shown, while Figure 6 shows peak concentrations of tumors with
  with the same diffusive coefficients as above. We conclude by comparing these two figures that the peak concentration values do not differ that much at higher growth rate, as is the case at lower growth rate.
Figure 7 shows the contrast of variation of in growth of proliferating cell at pos . There is tremendous growth observed at lower position around 0.1 positions, in contrast to the growth at around 0.2 positions. In fact, tumor exhibits a decaying or dormant pattern near 0.2 mm, as if saturation in cell concentration is reached, but to our exasperation, that is never the actual case. Ratio of growth rate to diffusion coefficient here is taken to be 59. A close and comparative study shows that diffusivity factor plays prominently when growth rate is at extreme, either very low or very high.
6. Conclusions
Some of tumors, like tumors of brain where diffusive coefficient are higher and varied, they despite being potent, may not be diagnosed properly and their malignancy may not be assessed even by any advanced image scan. (see [3]). Exact metastasized extend can only be estimated when number of diffused cells are known correctly, which attempts to clarify the pattern of highly malignant tumor growth, vis-à-vis concentration of nutrient.
This model can be used as the basis for finding the growth in the tumor when anisotropic nature of tumor is also taken into account, as it is an established fact that diffusivity of cell in white matter is five times more than that in gray matter (see [7,8]). It can be used to explore further to find out exactly the direction of growth of tumor for clinical treatment. However, we have not taken the death rate of cells into account as cell death rate is small as compared to proliferating rate, during initial state of tumor growth.
This model may be of clinical help as model can be adapted to patient-specific cases and could be used for quantification of apparent growth by extracting invasion speed and a better therapy planning by suggesting irradiation regions adapted to growth dynamics or optimal dose/temporal planning of chemotherapy can be done . Here we have modeled the process of growth only macroscopically without considering the microscopic details like brain geometry, tissue in homogeneity and fiber structures, the estimated speeds in the white and in the gray matter.
7. Current Status of the Application and Latest Progress in the Current Problem
Gliomas are diffuse and highly invasive brain tumors, accounting for about 50% of all primary brain tumors see ([7,8]). The prognosis for patients with gliomas depends on many factors, including the histological type and grade of malignancy, the patient’s age and level of neurological functioning [9]. But most unfortunate aspect
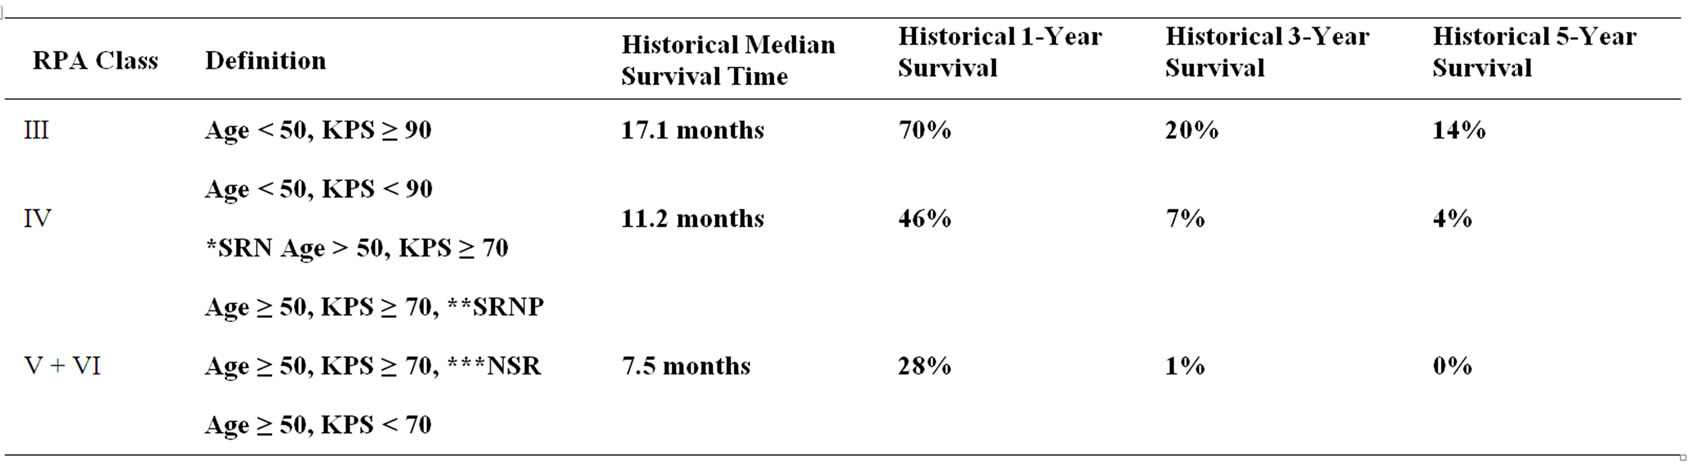
Table 3. According to a 2003 study, glioblastoma multiforme prognosis can be divided into three subgroups dependent on KPS, the age of the patient, and treatment SRN = surgical removal with good neurologic function, SRNP = surgical removal with poor neurologic function NSR = no surgical removal.
of its malignancy is that it is never defined or measured accurately because of high and variable motility of malignant cells in the various parts of brain.
Another challenge faced during its diagnosis as well in therapy is that the boundary between tumor and normal tissue is not sharp and the number of cells in the “normal tissue” is not determinable. However a major breakthrough in the practical application of the model (1) was the availability of the brain web atlas [10]. This allowed the model to be applied to anatomically correct brains [12,13]. Among other things it made it possible to refine the gross anatomic boundaries and to vary the degree of motility of glioma cells in grey or white matter:
The brain was considered to be homogeneous matter bounded by the ventricles and skull in initial models (see [11-13]). Even with such a simple anatomical model the predictions of the analysis were broadly in line with patient observation of both low and high grade brain tumors.
The limitations of current imaging techniques were clear. The model was then used to mimic various accepted medical treatments, specifically radiation, surgical resection (see [14-16]) and chemotherapy. A three dimensional model was proposed and studied by Burgess et al. [17], (see also [18]), who were the first to demonstrate that cancer cell diffusion, mainly ignored up to that time, is a major component of glioma growth. They showed that only those tumors with a low diffusion rate could benefit from wide surgical resection although eventually there will be multifocal recurrence.
However surgery is still the first stage of treatment of glioblastoma. An average GBM tumor contains  cells, which is on average reduced to
  cells after surgery (a reduction of
 ) [18-21]. It is used to take a section for a pathological diagnosis, to remove some of the symptoms of a large mass pressing against the brain, to remove disease before secondary resistance to radiotherapy and chemotherapy, and to prolong survival. The greater the extent of tumor removal, the better. Removal of
  or more of the tumor has been associated with a significantly longer healthier time than if less than
  of the tumor is removed The chances of nearcomplete initial removal of the tumor can be greatly increased if the resection area is assessed by a mathematical model along with area presented apparently by scans. GBM cells are widely infiltrative through the brain at diagnosis, and so despite a “total resection” of all obvious tumor, most people with GBM later develop recurrent tumors either near the original site or at more distant “satellite lesions” within the brain. Particularly keeping its fatality factor in view as shown by data in Table 3, an assessment of the exact spread of tumor cells through mathematical model becomes a critical need.
We have also extended investigation in our next pape where by reduction in the concentration of oxygen in the region gives the corresponding increases in the tumor cells. By the same logic correspondence between the actual numbers of cells to the numbers represented by any advanced scan can be established.
Applying mathematical model for virtual growth of brain tumor cell is the latest development (see [22]) in this area.
REFERENCES
- L. C. H. Cruz Jr. and A. G. Sorensen, “Diffusion Tensor Magnetic Resonance Imaging of Brain Tumors,” Neurosurgery Clinics of North America, Vol. 16, No. 1, 2005, pp. 115-134.
- J. Bernstein, W. Goldberg and E. J. Laws, “Human Malignant Astrocytoma Xenografts Migrate in Rat Brains: A Model for Central Nervous System Cancer Research,” Journal of Neuroscience Research, Vol. 22, No. 2, 1989, pp. 134-143. doi:10.1002/jnr.490220205
- M. R. Chicoine and D. L. Silbergeld, “Assessment of Brain Tumor Cell Motility in Vivo and in Vitro,” Journal of Neurosurgery, Vol. 82, No. 4, 1995, pp. 615-622. doi:10.3171/jns.1995.82.4.0615
- C. P. Geer and S. A. Grossman, “Interstitial Fluid Flow along White Matter Tracts: A Potentially Important Mechanism for the Dissemination of Primary Brain Tumors,” Journal of Neuro-Oncology, Vol. 32, No. 3, 1997, pp. 193-201. doi:10.1023/A:1005761031077
- J. D. Murray, “Mathematical Biology. II Spatial Models and Biomedical Applications,” 3rd Edition, Springer, New York, 2003.
- J. J. Casciari, S. V. Sotirchos and R. M. Sutherland, “Variations in Tumor Cell Growth Rates and Metabolism with Oxygen Concentration, Glucose Concentration, and Exrans-Cellular,” Cell Physiology, Vol. 151, 1992, pp. 386-394
- K. Swanson, E. Alvord and J. Murray, “A Quantitative Model for Differential Motility of Gliomas in Grey and White Matte,” Cell Prolific, Vol. 33, 2000, pp. 317-329. doi:10.1046/j.1365-2184.2000.00177.x
- A. Giese, L. Kluwe, B. Laube, H. Meissner, M. Berens and M. Westphal, “Migration of Human Glioma Cells on Myelin,” Neurosurgery, Vo. 38, No. 4, 1996, pp. 755-764. doi:10.1227/00006123-199604000-00026
- D. L. Silbergeld and M. R. Chicoine, “Isolation and Characterization of Human Malignant Glioma Cells from Histologically Normal Brain,” Journal of Neurosurgery, Vol. 86, No. 3, 1997, pp. 525-531. doi:10.3171/jns.1997.86.3.0525
- D. L. Collins, A. P. Zijdenbos, V. Kollokian, J. G. Sled, N. J. Kabani, C. J. Holmes and A. C. Evans, “Design and Construction of a Realistic Digital Brain Phantom,” IEEE Transactions on Medical Imaging, Vol. 17, No. 3, 1998, pp. 463-468. doi:10.1109/42.712135
- G. C. Cruywagen, D. E. Woodward, P. Tracqui, G. T. Bartoo, J. D. Murray and E. C. Alvord Jr., “The Modeling of Diffusive Tumors,” Journal of Biological Systems, Vol. 3, No. 4, 1995, pp. 937-945. doi:10.1142/S0218339095000836
- D. E. Woodward, J. Cook, P. Tracqui, G. C. Cruy wagen, J. D. Murray and E. C. Alvord Jr., “A Mathematical Model of Glioma Growth: The Effect of Extent of Surgical Resection,” Cell Proliferation, Vol. 29, No. 6, 1996, pp. 269-288. doi:10.1111/j.1365-2184.1996.tb01580.x
- P. Tracqui, G. C. Cruywagen, D. E. Woodard, G. T. Bartoo, J. D. Murray and E. C. Alvord Jr., “A Mathematical Model of Glioma Growth: The Effect of Chemotherapy on Spatio-Temporal Growth,” Cell Proliferation, Vol. 28, 1995, pp. 17-31. doi:10.1111/j.1365-2184.1995.tb00036.x
- D. L. Silbergeld, R. C. Rostomily and E. C. Alvord Jr., “The Cause of Death in Patients with Glioblastoma Is Multifactorial: Clinical Factors and Autopsy Findings in 117 Cases of Supratentorial Glioblastoma in Adults,” Journal of Neuro-Oncology, Vol. 10, 1999, pp. 179-185.
- K. R. Swanson, “Mathematical “ Modeling of the Growth and Control of Tumors,” Ph.D. Thesis, University of Washington, Washington, 1999.
- K. Swanson, E. Alvord and J. Murray, “Quantifying Efficacy of Chemotherapy of Brain Tumors with Homogeneous and Heterogeneous Drug Delivery,” Acta Biotheoretica, Vol. 50, No. 4, 2002, pp. 223-237.
- P. K. Burgess, P. M. Kulesa, J. D. Murray and E. C. Alvord Jr., “The Interaction of Growth Rates and Diffusion Coefficients in a Three-Dimensional Mathematical Model of Gliomas,” Journal of Neuropathology & Experimental Neurology, Vol. 56, 1997, pp. 704-713.
- O. Clatz, M. Sermesant, P. Bondiau, H. Delingette, S. Warfield, G. Malandain and N. Ayache, “Realistic Simulation of The 3d Growth of Brain Tumors in MR Images Coupling Diffusion with Biomechanical Deformation,” IEEE Transactions on Medical Imaging, Vol. 24, No. 10, 2005, pp. 1334-1346.
- J. D. Murray, “Mathematical Biology,” 3rd Edition, Springer, New York, 2002.
- N. Lyubimova and J. W. Hopewell, “Experimental Evidence to Support the Hypothesis That Damage to Vascular Endothelium Plays the Pri Mary Role in the Development of Late Radiation-Induced CNS Injury,” British Journal Radiadiolgy, Vol. 77, No. 918, 2004, pp. 488-492. doi:10.1259/bjr/15169876
- E. C. Alvord Jr. and C. M. Shaw, “Neoplasms Affecting the Nervous System of the Elderly,” In: S. Duckett, Ed., The Pathology of the Aging Human Nervous System, Lea and Fabiger, Philadelphia, 1991, pp. 210-286.
- S. Gu and J. Claridge, “Applying a Patient-Specific BioMathematical Model of Glioma Growth to Develop Virtual[18F]-FMISO-PETmages,” Mathematical Medicine and Biology, Vol. 29, No. 1, 2012, pp. 31-48.
Appendix-1