Journal of Signal and Information Processing
Vol. 3 No. 2 (2012) , Article ID: 19586 , 11 pages DOI:10.4236/jsip.2012.32036
Human Identity Verification Using Multispectral Palmprint Fusion
![]()
1Department of Computer Science and Engineering, Asansol Engineering College, Asansol, India; 2Department of Electrical and Electronics Engineering, University of Cagliari, Cagliari, Italy; 3Department of Computer Science and Engineering, Indian Institute of Technology Kanpur, Kanpur, India; 4Department of Computer Science and Engineering, Jadavpur University, Kolkata, India; 5Department of Computer Science, Texas State University, San Marcos, USA.
Email: *drkisku@ieee.org
Received December 9th, 2011; revised December 17th, 2011; accepted February 20th, 2012
Keywords: Palmprint Verification; Multispectral Image Fusion; Gabor Wavelet Filters; Ant Colony Optimization; Support Vector Machines
ABSTRACT
This paper presents an intra-modal fusion environment to integrate multiple raw palm images at low level. Fusion of palmprint instances is performed by wavelet transform and decomposition. To capture the palm characteristics, the fused image is convolved with Gabor wavelet transform. The Gabor wavelet based feature representation reflects very high dimensional space. To reduce the high dimensionality, ant colony optimization algorithm is applied to consider only relevant, distinctive and reduced feature set from Gabor responses. Finally, the reduced set of features is trained with support vector machines and accomplished user recognition tasks. For evaluation, CASIA multispectral palmprint database is used. The experimental results reveal that the system is robust and encouraging while variations of classifiers are used.
1. Introduction
There exists a large number of computational approaches in intra-modal fusion [1,2] at different levels of human recognition. However, there are some incapable constraints in mono-modal biometric as well as intra-modal biometric systems, such as lack of accurate image registration methods [2], template matching with loss of complementary information [2], and association of redundant adaptive parameters [2]. These factors make the poor performance of the system. Intra-modal biometric image fusion can remove some of the limitations of uni-biometric systems [3] because the uni-modal biometric system usually compensates for the inherent limitations of the secondary sources. Intra-modal systems have the following advantages [4-6] over uni-modal biometric systems.
• Fusion of the evidence obtained in different form from the same or different sources can significantly improve the overall accuracy of the biometric system.
• Intra-modal biometric can address the problem of nonuniversality which often occurs in uni-modal system.
• Intra-modal systems can provide certain degrees of flexibility.
• The availability of multiple sources of information can reduce the redundancy in uni-modal system.
Biometric image fusion at sensor level/low level refers to a process that fuses multispectral biometric images captured by identical or different biometric sensors. This fusion produces an image in spatially enhanced form which contains richer, intrinsic and complementary information. Biometric verification systems seek considerable amount of improvement with respect to their reliability and accuracy.
Automatic authentication of users by their respective characteristics plays an important role in security. A biometric system recognizes the identity of a person with certain physiological/behavioral characteristics, such as fingerprints, face, iris, speech, hand geometry, etc. Biometric systems based on palmprint have been proposed in [7-13]. The palmprint recognition system has many advantages over other biometric systems in respect of reliability, low cost and user friendly. Palmprint is one of the most reliable means in personal identification because of its stability user friendliness, acceptability and uniqueness [7,12,13].
Palmprint image consists of wrinkles and creases along with three principal lines, namely, heart line, headline and life line. These lines vary little over time while wrinkles are much thinner than the principal lines and much more irregular. Creases which are detailed textures, like the ridges in a fingerprint, found all over the palmprint, can only be captured using high-resolution cameras. With the low-resolution palmprint image, the principal lines and thick wrinkles can be used for recognition.
Variations in different palmprint images of an individual can be combined to produce a fused palm image. Images acquired through different imaging sensors have been fused using various techniques discussed in [4-6]. The necessity for fusion techniques is increased with the inception of new image acquisition devices. By fusing images, it is possible to discern the useful information from the input images. However, biometric fusion using multiple palm images [5,6] at low level is expected to produce more accurate results than the systems that integrate information at later stages, namely, feature level, score level, etc. [2]. This is because of the availability of more relevant and precise raw information. Apart from integrating the contributive features to other levels of fusion, an image fusion scheme of a higher abstraction suppresses inconsistencies, artifacts and noise in the fused images.
Another problem often occurred in biometric applications is the selection of a set of features [14]. Feature selection is the most important step that can affect the performance of recognition system. It is often necessary to select that set of features which reflects the relevancy among the features.
Review of Some State-of-the-Art Systems
There exist many palmprint authentication systems which exhibit encouraging results. But there is a need to improve the performance of the existing systems. To cope up with spoof attacks and to make it tamper proof, multispectral algorithms can be used to high security zones where vulnerability often happens. In the recent years, a few multispectral palmprint systems have been developed for reliable means of authentication. In this section we briefly describe some well known multispectral palmprint authentication systems.
A multispectral palmprint recognition system using wavelet based image fusion has been proposed in [15]. It uses a multispectral capture device to sense the palm images under different illumination conditions, including red, blue, green and infrared. Further wavelet transform is used for combining the palmprint images obtained from different channels. During image acquisition the situation of hand movement is also considered. Finally, competitive coding scheme has been adopted for matching. It uses Wavelet based image fusion as data-level. Again this system has been further extended in [16] where features extraction and matching have been made of red, green, blue and NIR bands of a multispectral palm image. Finally these matching scores obtained from matching against different bands are fused using simple sum rule.
A contact-free palmprint verification system has been presented in [5] using multispectral palm image by means of feature level registration and pixel level fusion strategies. Initially a sequence of multispectral hand images is obtained by illuminating the hand with multiple active lights. Coarse localization of ROIs is performed through preprocessing on each image and it is then further refined through feature level registration. Finally, authors integrate the multiple image sources and the fusion is performed with multi-scale decomposition, activity measure and coefficient combining methods.
Feature band selection based multispectral palmprint recognition has been proposed in [17] where the statistical features are extracted to compare each single band. Score level fusion is performed to determine the best combination from all candidates. The most discriminative information of palmprint images can be obtained from two special bands. Region of Interest (ROI) is determined from hyper-spectral palm cube using local coordinate system.
In [18], multispectral palmprint recognition has been presented where multiple information related to hand are used. Hand shape, fingerprints and palmprint modalities are used for recognition. This system shows good recognition accuracy on a medium size database while fusion is performed with multiple fingers and fusion of finger and palm.
A comparative study of several multispectral palm image fusion techniques has been presented in [6] and some well-studied criteria are used as objective fusion quality measure. However, the curvelet transform is found to be the best among others in preserving discriminative patterns from multispectral palm images.
This paper presents a novel palmprint verification method in which palm images are fused at low level by wavelet transform [4] and fused palm is then represented by Gabor wavelet transform [8-10] to capture the palm characteristics in terms of neighborhood pixel intensity changes. Gabor palm responses contain high dimensionality features and due to this high dimensionality ant colony optimization (ACO) [19] is applied to select the optimal set of distinct features. Finally, support vector machines (SVMs) [20] are used to train the reduced feature sets of different individuals and verify the identity. Proposed palmprint system is evaluated with CASIA palmprint database [5,6] and the results are also compared with other existing methods to measure the effectiveness and robustness of the system.
The paper is organized as follows. Section 2 presents some preliminaries used for the proposed system. Section 3 briefly describes the proposed model and waveletbased palm image fusion scheme. Gabor wavelet representation of fused palm image is discussed in the next section. Feature selection using ant colony optimization algorithm is presented in Section 5. Classification method is discussed in Section 6. Experimental results are analyzed in the next section. Finally, conclusions are given in the last section.
2. Preliminaries
2.1. Region of Interest (ROI) Detection from Palm Image
Major issues for the degradation of a palmprint recognition system are accurate registration, palm feature representation and redundancy exploitation. Method of ROI detection [8] is employed to reduce the error caused due to translation and rotation. This process roughly aligns the palmprint and it does not reduce the effect of palmprint distortion.
To extract the ROI of palm image, it is necessary to define a coordinate system based on which different palm images are aligned for matching and verification. Gaps between fingers have been used in [8] as reference points for determining the coordinate system. This paper also applies this technique to determine the ROI of the multispectral palm image. The following algorithm is followed to extract the central part of the palmprint image as ROI and further this ROI is used for multispectral fusion of palm images.
• Step 1: Convert the multispectral palm image to a binary image. Gaussian smoothing can be used to enhance the image.
• Step 2: Apply boundary-tracking algorithm to obtain the boundaries of the gaps between the fingers. Since the ring and the middle fingers are not useful for processing. Therefore, boundary of the gap between these two fingers is not extracted.
• Step 3: Determine palmprint coordinate system by computing the tangent of the two gaps with any two points on these gaps. The y-axis is considered as the line which joining these two points. To determine the origin of the coordinate system, midpoint of these two points are taken through which a line is passing and the line is perpendicular to the y-axis.
• Step 4: Finally, extract ROI for feature extraction which is the central part of the palmprint.
Figure 1 illustrates ROI of palm image which is cropped from palmprint image. In practice, it has been seen that principal lines do not contribute adequately to high accuracy because of their similarity amongst different palms. Although wrinkles play an important role in palmprint authentications it is still a difficult task to extract them accurately. This problem motivates to apply texture analysis to palmprint authentication. There exist many texture based palmprint verification schemes including Gabor filtering, wavelet, etc. [8-11].

Figure 1. Detection of ROI and cropped palm image.
2.2. Palm Image Fusion Using Wavelet Decomposition
The image fusion extracts information from each source image and obtains the effective representation in the final fused image. The aim of image fusion technique is to process the detailed information that is found from both the source images.
By convention, multi-resolution images are used for image fusion which are obtained from different sources. Multi-resolution analysis [4] of images provides useful information for several computer vision and image analysis applications. The multi-resolution image is used to represent the signals where decomposition is performed for obtaining finer detail. Multi-resolution image decomposition gives an approximation image and three other images viz., horizontal, vertical and diagonal images of coarse detail. The Multi-resolution techniques are mostly used for image fusion using wavelet transform and decomposition.
Prior to image fusion, wavelet transforms are obtained from face and palmprint images. The wavelet transform contains low-high bands, high-low bands and high-high bands of the face and the palmprint images at different scales including the low-low bands of the images at coarse level. The low-low band has all the positive transform values and remaining bands have the transform values that are fluctuating around zeros. Larger transform values in these bands respond to sharp changes in brightness and thus to the changes of salient features in the image such as edges, lines, and boundaries. The proposed image fusion selects the larger absolute values of the two wavelet coefficients at each point. Therefore, a fused image is produced by performing an inverse wavelet transform which is based on integration of wavelet coefficients corresponding to the decomposed face and palmprint images.
More formally, wavelet transform decomposes an image recursively into several frequency levels and each level contains transform values. Let I be a gray-scale image after the first level of wavelet decomposition. One gets
 (1)
(1)
where  represents the base image which contains coarse detail of positive transform values and the other high frequency details such as
  and
and  represent the vertical, the horizontal and the diagonal details of transform values, respectively.
After nth level decomposition of the base image in low frequency, the nth level decomposition can be expressed as
 (2)
(2)
So, the nth level decomposition consists of 3n + 1 subimage sequences. Different wavelet fusion rules on the low and high frequency parts are applied to fuse the 3n + 1 sub-image sequences. Finally, inverse wavelet transformation is performed to restore the fused image. The generic wavelet-based decomposition and image fusion approach is illustrated in Figure 2.
2.3. Gabor Wavelets Filters
Fundamentally, 2D Gabor filter [8,9,21] can be defined as a linear filter whose impulse response function is the multiplication of harmonic function and Gaussian function in which Gaussian function is modulated by a complex sinusoid. In this regard, the convolution theorem states that the Fourier transform of a Gabor filter’s impulse response is the convolution of the Fourier transform of the harmonic function and the Fourier transform of the Gaussian function. Gabor function is a non-orthogonal wavelet and it can be specified by the frequency of the sinusoid  and the standard deviations of
  and
and .
.
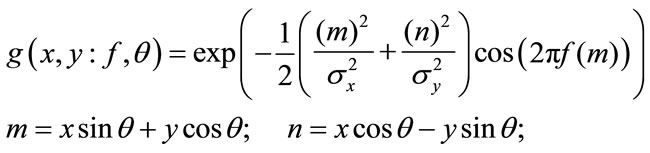
The 2D Gabor wavelet Filter can be defined as
 (3)
(3)
where f is the frequency of the sinusoidal plane wave along the direction  from the x-axis,
  and
and  specify the Gaussian envelop along x-axis and along yaxis, respectively. This can be used to determine the bandwidth of the Gabor filter.
3. Multispectral Palm Image Fusion
The wavelet transform [4] provides a multi-resolution decomposition of an image. In wavelet based palm image fusion, decomposition is done with high-resolution palmprint images. Decomposition generates a set of low-resolution images with wavelet coefficients at each level where the basis functions are generated from one single basis function known as the mother wavelet. The mother wavelet is shifted and scaled to obtain the basis functions. Then, it replaces a low-resolution image with a multispectral (MS) band at the same spatial resolution level. Finally, a reverse wavelet transformation is performed to convert the decomposed and set to the original resolution level.
The operations of a wavelet fusion scheme are outlined in Figure 3. The multispectral palm images are obtained under different illumination conditions as red, blue, green and NIR bands which are then decomposed by a discrete wavelet transform and the wavelet coefficients are selected using a wavelet fusion rule [4] and an inverse discrete wavelet transform is performed to reconstruct the fused image. In this paper Haar wavelet is used for extracting wavelet coefficients and fusion is performed at data-level. The wavelet fusion method is used to combine the wavelet coefficient information obtained from the multispectral images of the same subject. In order to do so, Discrete Wavelet Transform (DWT) is used to decompose a single image into different coefficients that preserves the image information and the different coefficients obtained from different palm images can be combined to obtain new coefficients. Also, the
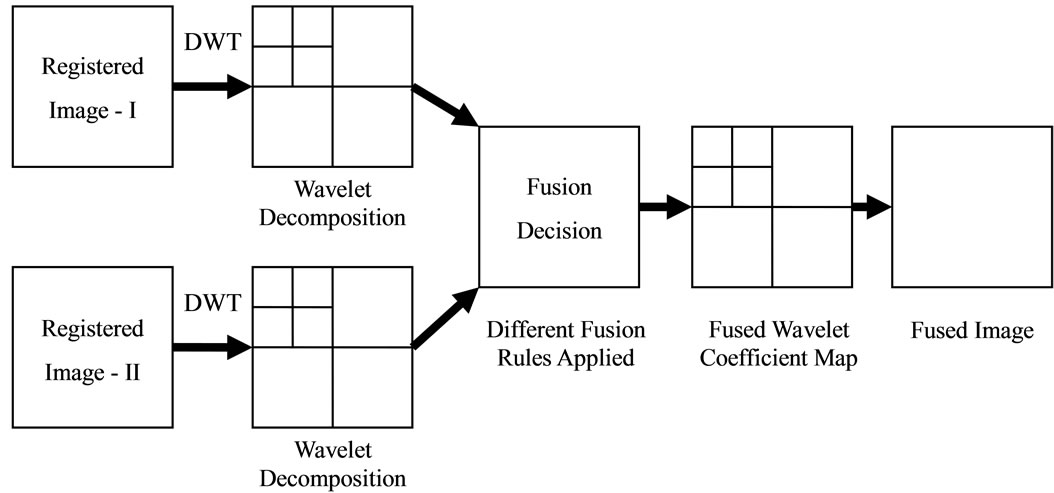
Figure 2. Generic structure of wavelet based fusion approach.

Figure 3. Wavelet based palmprint fusion technique (using “Haar” wavelet).
fused image can be obtained by applying Inverse Discrete Wavelet Transform (IDWT) to the new coefficients and the merged coefficients can generate an image that maintains the image information.
4. Gabor Responses of Fused Image
The proposed work uses gray scale fused palm image with the size of 40 × 40 and resolution of 200 dpi. It also uses 40 spatial frequencies with f = π/2i, (i = 1, 2, ,5) and θ = kπ/8, (k = 1,2,
 ,8). For Gabor palm representation, fused palm image is convolved with the Gabor filter bank for capturing substantial amount of variations of palm images. Gabor filter bank with five frequencies and eight orientations are used for generation of 40 spatial frequencies and for Gabor palm extraction.
In order to compute the Gabor responses of a fused palm image, Gabor filter is convolved with the fused image. Let f(x, y) be the intensity of the point (x, y) in a fused image and its convolution with Gabor filter G(x, y: f, θ) can be given as
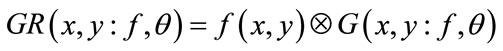 (4)
(4)
where  denotes the convolution operator. The response to each Gabor kernel representation is the complex function of real part Â(GR(x, y : f, q)) and an imaginary part
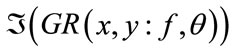 . The magnitude response is represented by
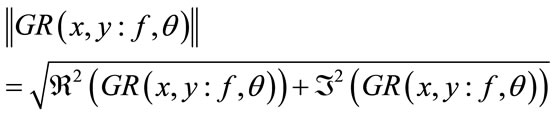 (5)
(5)
Here, the magnitude responses are used as wavelet coefficient features. The variation in lighting conditions can be normalized by the output of the Gabor filter about each direction.
5. Optimal Feature Selection Using Ant Colony Optimization
One of the critical issues concerned with the instancebased learning is the way to improve the quality of features. Feature quality can be improved generally by two ways. One way is to select the relevant and distinct features, while another way is to assign weights to features. This paper follows the first approach and feature selection from high dimensional Gabor response space is accomplished with a swarm intelligence technique, namely, ant colony optimization algorithm.
The motivation of applying feature selection techniques is to build a real prerequisite model for the proposed system. In the proposed multispectral palmprint recognition system, ant colony optimization (ACO) technique has been used to obtain an optimal set of features. In contrast to other feature dimensionality techniques like projection (principal component analysis) or data compression (information theory), ACO based feature selection technique does not alter the original representation of the features but selects a subset of features from the feature space. It also preserves the original semantics of the features and offers the advantage of interpretability by a domain expert.
The objectives of ACO based feature selection are manifold such as 1) to avoid overfitting problem and improve classification performance, 2) to provide faster and cost-effective models and 3) to gain a deeper insight into the underlying processes that generated data. Apart from these advantages, ant colony optimization algorithm easily scales the very high dimensional feature space into intrinsic and low dimensional feature space and it is independent of classification algorithms.
Ant colony optimization algorithm [19] is inspired by ant’s social behavior in the search for the shortest paths to reach to food sources. In the proposed algorithm, classifier performance and the length of selected feature vector are adopted as heuristic information for ACO. So, we can select the optimal feature subset without the prior knowledge of features.
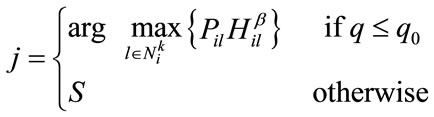
Initially artificial ants are placed randomly on the coefficient features of the Gabor responses. The ACO algorithm works as follows. In each iteration, each ant computes the probability of moving to a new not yet visited feature point not yet visited using a pseudo-random proportional rule. This rule is a trade-off between exploration and exploitation. An ant either with probability q0 exploits the available information about previous good solutions or with probability (1 – q0) explores new areas of the solution space focusing on shorter distance with pheromone rate. An ant k located at node i chooses the new feature point j to move to according to the following
 (6)
(6)
where Pij is the pheromone trail on connection between feature point i and j, Hij is the problem dependent heuristic,  is the set of remaining feature points to be visited by the kth ant located at node I, β is a parameter that determines the relative importance of pheromone versus heuristic, q is a random variable distributed in [0, 1], q0 is a parameter, 0 ≤ q0 ≤ 1 and S is a random variable selected according to the following probabilistic rule.
 (7)
(7)
After all artificial ants have completed their tours, only the ant that finds the global best tour (the so far best tour obtained from the beginning of the algorithm’s execution) reinforces the pheromone trails on the distance belong to its tour. The amount of deposited pheromone is inversely proportional to the length of the global best tour. This is called global pheromone update and is given by:
 (8)
(8)
where  is the pheromone quantity added to the connection (i, j) that belongs to the best solution
  and is given by:
 (9)
(9)
where σ is the trail evaporation such that (1 – σ) represents the pheromone persistence. This parameter is used to avoid unlimited accumulation of pheromone trails and allows the algorithm to forget previously done bad choices.
Updating of the global pheromone increases the probability for other ants to use the short distance that have greater amount of pheromone trail and in turn, increases the probability to build better solution. The pheromone evaporation mechanism is applied only on the edges that have been used by an ant. Every time an ant uses a distance, it decreases the pheromone intensity on this distance. This is called local pheromone update and is given by:
 (10)
(10)
where  is another pheromone evaporation parameter and P0 is the initial pheromone value. Updatation of the local pheromone encourages the exploration of new areas of the search space by reducing the importance of the visited edges while modification of the global pheromone encourages the exploitation of previously good solution by giving an extra weight to the distance of global best solution.
For classification, a subset of important features is selected. Suppose, G is the original set of n features representing Gabor palm responses and S is the reduced set of features of m dimensions, (where m < n). In the process of searching a subset of features from Gabor responses, each ant randomly chooses a feature subset of m features. First, the best k subsets (k < number of ants) are used to update the pheromone trial and influence the feature subsets in the next iteration. In the subsequent iterations, each ant starts with m – p features that are randomly chosen from the previously selected k-best subsets where p is an integer lying between 1 and m – 1. In this way, features that constitute the best k subsets have more chance to be present in the subsets of the next iteration. However, it is still possible for each ant to consider other features as well. For a given ant j, those features are the ones that achieve the best compromise between pheromone trails and local importance with respect to Sj, where Sj is the subset that consists of the features that have already been selected by ant j. The time complexity of ant colony optimization algorithm with n ants would be O(1/ρ n2 m log n) for shortest path with n nodes and m paths, where ρ is an evaporation rate.
6. Classification Using Support Vector Machines
After applying ant colony optimization system, a subset of features is obtained which is the best compromise between pheromone trails and local importance. In order to make criterion for decision-making, Support Vector Machines (SVMs) [20] are used. SVM is known as statistical learning theory that can be used for classification of test samples with respect to training samples. SVMs are built based on the principle of structural risk minimization. The aim is to minimize the upper bound on expected or actual risk that is defined as
 (11)
(11)
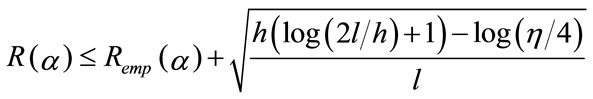
where α is a set of parameters which can be used to define a trained machine and z is a class label associated with a training sample x, f(x, α) is a function which can be used to map a training sample to class labels and P(x, z) is the unknown probability distribution associating a class label with each training sample. Let l denote the number of training samples and choose some η such that 0 ≤ η ≤ 1. On expected risks with the probability 1 – η, the following bound holds
 (12)
(12)
where h is a non-negative integer called Vapnik Charvonenkis (VC) dimension [20] and is a measure of the complexity of the given decision function. The term in R.H.S. is known as VC bound. Minimizing the empirical risk as well as VC dimension, one can minimize the risk.
To separate a given training sample, an optimal hyperplane is chosen from a set of hyperplane. This optimal hyperplane minimizes the VC confidence that provides best generalization capabilities. The optimal hyperplane is used to minimize the sum of the distances to the closest positive and negative training samples. This sum is known as the margin of the separating hyperplane. It can be shown that the optimal hyperplane w·x + b = 0 is obtained by minimizing  subject to a set of constraints which is a quadratic optimization problem.
It is inspired to apply this for non-separable and nonlinear case. Adding a term to the expression subject to minimization one can solve the separability problem. This term is the sum of the deviations of the non-separable training samples from the boundary of the margin. To control the cost of misclassification, sum is weighted. Mapping of the training samples to a high-dimensional feature space using kernel functions solves the problem of non-linear decision boundaries. In this high-dimensional space, the decision boundary is linear. For the proposed system, two kernel functions are used, namely, linear and radial basis functions (RBFs) which are given by
 (13)
(13)
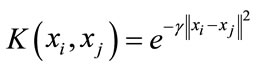 (14)
(14)
where xi and xj denote two training samples and γ is the user-controlling parameter in case of Radial Basis Function (RBF).
In addition to SVMs with kernel functions, the following classification rule is implemented as baseline for experiment
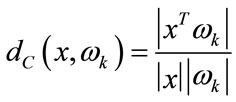 (15)
(15)
The normalized correlation (NC) measure is used as classification rule specified in Equation (15) and a claimed identity is accepted if the normalized correlation measure dC(x, ωk) exceeds a pre-specified threshold τCk.
The pre-specified threshold is determined from Receiver Operating Characteristic (ROC) curves computed on an independent evaluation set which is compared with the training set. ROC curves are produced by generating false accept (FA) and false reject (FR) rates separately.
7. Experimental Results
The CASIA Multi-Spectral Palmprint database [6] contains 3600 palm images acquired from 100 subjects. The palm images are captured by using multispectral sensors as shown in Figure 4 and in two differrent sessions for each hand and the images are set to 8 bit gray-level BMP files. In each session three different sets of images are captured and each set contains 6 palm images that are captured with 6 different electromagnetic spectrums. Between two sets, a certain degree of posture variations is allowed. All palm images are taken with uniformly distributed illumination and with uniform colored background.
For the experiments with the CASIA Multi-Spectral Palm Database, a unified framework is built with a simple protocol. In order to construct the protocol, the entire multi-spectral palm database is divided into three disjoint sets of palm images. The first set contains training set of 1985 palm images and evaluation set contains 966 palm images while query set contains 649 palm images. The training set is used to build client models, the evaluation set is used to obtain the client and imposter scores for verification thresholds and the query set of palm images is used for obtain the verification rates. The experiments are conducted in two phases. The first phase of experiment is conducted in which feature selection is performed using ant colony optimization technique and in the second phase, experiment is performed without using

Figure 4. Multiple spectral sensor [6].
feature selection technique. Then these results are compared with the methods in [5,15] which are also built using multispectral palm images.
7.1. Experimental Evaluation—I
This subsection discusses the performance of the proposed multispectral palmprint system on the CASIA Multi-Spectral Palm database when ant colony optimization algorithm is not used to select optimal number of features. Multispectral bands viz. red, green, blue and NIR are fused using wavelet decomposition and transform method which is followed by Gabor wavelet transform to represent this fused image. Gabor coefficients with higher dimension are used as the raw feature set. Two different classifiers, namely, normalized correlation metric and SVM with two kernel functions, viz. linear and RBF kernels are used for matching. However, the kernel parameter is used with RBF kernel only. Equal Error Rates (EER) and Total Error (TE) are computed on the evaluation set of palm images while FA, FR and TE are found from the query set. Experimental results are given in Table 1. The normalized correlation is found to be more sensitive to outliers than the other two classifiers. Since the most prominent Gabor coefficient features are mixed with irrelevant features, there are noises in different bands causing degradation of the performance. However, it can improve its performance when linear kernel is used with SVM classifier. But this improvement does not have much impact on the overall performance. For these two classifiers, differences of TE in evaluation and query sets are found to be 4.52% and 1.36% respectively. When SVM with the RBF kernel function is used, it gives 11.66% and 10.68% TE rates for evaluation and query sets respectively. It also improves FA and FR rates.
7.2. Experimental Evaluation—II
Table 2 shows the performance of the proposed multispectral palm image fusion on CASIA database with two different classifiers, namely, normalized correlation and SVM. Results are obtained when feature selection is performed using ant colony optimization algorithm. Further, SVM classifier is used with two kernel functions viz. linear and RBF. Kernel parameter for RBF function is set to 0.015. On the other hand, linear kernel and normalized correlation are used without using kernel functions. Prior to Gabor wavelet coefficients extraction from a fused palm image, fused palm image is normalized using histogram equalization. Image enhancement using histogram equalization makes the intensity distribution uniform. This can compensate or suppress the noise. Ant Colony Optimization system is applied to obtain the reduced set of transformed coefficients that reflect rich and distinctive features. SVM is used for authentication of query palm samples. By using evaluation set, Equal Error Rates (EER) and Total Errors (TE) are determined and further these error rates are used to compute the False Accept (FA), False Reject (FR) and Total Error (TE) rates for query set. Normalized Correlation (NC) is found to be sensitive to coefficients. However, SVM classifier with linear and RBF kernels are found to be robust to wavelet coefficients as well as reduced set of features. When normalized correlation (NC) is used as classifier, FA, FR and TE are found to be 4.51%, 6.27% and 10.78% respectively. On the other hand, these error rates are found to be 3.09%, 5.11% and 8.2% respectively when SVM classifier is used with linear kernel function. Use of linear function with SVM classifier reduces total error by 2.58%. Better performance is observed when RBF kernel function is used. Total error is reduced to 4.53% and 1.95% when the performance of RBF kernel is compared with normalized correlation and linear kernel function

Table 1. Performance of the system without ant colony optimization.

Table 2. Performance of the system with ant colony optimization.
respectively. Thus• SVM can be efficient while it is applied to the reduced set of features and even little noise is present with the fused palm image.
• The combination of Gabor wavelet features and ant colony optimization is found to be useful to extract the most relevant and distinctive coefficients.
• Wavelet decomposition is used to fuse multi-spectral palm images to a fused one in which initial raw characteristics are present with intensity distortions and illumination noise. However, these noises are minimized when ant colony optimization and SVM classifier are used.
• Classification through SVM with RBF kernel is found to be better than the classification through SVM with linear function and normalized correlation.
Thus, one can make the following observations.
• SVM with RBF kernel is found to be superior to the other two classifiers while ant colony optimization algorithm is not used to select optimal set of features. But its performance is poor when it is compared with the results of the system which uses ant colony optimization algorithm.
• Normalized correlation metric is found to be much more sensitive to outliers when it is compared with ant colony optimization based system.
• Gabor wavelet representation is not characterized by ant colony optimization. Since feature selection is not accomplished, distinctive wavelet coefficients are found with significant number of outliers and noise. Effect of these outliers and noise cannot be minimized. As a result, these outliers affect the overall performance of the system. When the ant colony optimization algorithm is used for feature selection from Gabor wavelet coefficients, noise are minimized and only the features having more discriminative power are selected.
• The system, which does not use the ant colony optimization algorithm for selecting optimal set of features, is slow because of its high dimensional Gabor wavelet coefficients.
• Moreover, use of ant colony optimization is efficient when illumination distortion and noise are present in the red, green, blue and NIR of different bands under varying illumination.
7.3. Comparison with Well Known Methods
The proposed multi-spectral palm image fusion is also compared with a well-known method presented in [5] where pixel-level multi spectral palm image fusion is performed. The later uses some preprocessing steps to detect ROIs on multi spectral palm images and further the localized palm ROIs are registered by a feature level image registration method. Finally, multi-scale decomposition, activity measures and coefficients combining methods with variations of fusion techniques are used to fuses these multi spectral palm images and identity verification is performed by Hamming distance measure. Test of the palm image fusion method is performed on CASIA palmprint database in which 165 persons are contributed. A total of 5940 palm images are used for evaluation and from each individual 3 image sequences are captured. Original size of each palm image is 768 × 576. However, for experiment ROIs are normalized to 128 × 128 after registration. Two performance measure parameters, viz. EER (Equal Error Rate) and discriminating index (d’) are used to verify the robustness of the system [5]. In this experiment different fusion strategies are used, namely, Gradient Pyramid (GP), Morphological Pyramid (MP), Shift-Invariant Digital Wavelet Transform (SIDWT) and Curvelet Transform (CT) with different visible spectrum and infrared lights. Among these four fusion rules, the best performance is achieved by CT fusion rule. It produces 0.5% and 0.58% EERs for two different combinations of visible spectrums. However, the proposed multi spectral palm image fusion method uses wavelet decomposition and transformation for fusion of palm images with Haar wavelet coefficients and Gabor wavelet is used for feature extraction. Further, distinctive features are selected by ant colony optimization algorithm and finally recognition task is performed by SVM. Use of this combination is found to be robust, since it can be dealt with even presence of little noise in the fused image. The proposed method uses two classifiers, namely, normalized correlation and SVM with linear and RBF kernels. The method presented in [5] uses several fusion rules to fuse the palm images while the proposed method uses Haar wavelet coefficients with “Maximum” fusion rule. The proposed method achieves 3.97% and 3.12% EERs on evaluation and query sets while SVM classifier with RBF kernel is used.
As a classifier, SVM is found to be the most widely used and robust to classification while the Hamming distance measure used in [5] is found to be robust to certain types of features with customized measures. The proposed method is dealt with the small numbers of distinct features which are selected through ant colony optimization algorithm while the method presented in [5] uses all the features of fused palm image. A comparison table for both of these methods is shown in Table 3.
One can observe from the table that there exists a system [5] which performs better than the proposed multispectral palmprint authentication system. But the proposed system has several advantages over the system in [5]. Some of them are discussed below.
• Extraction of Gabor coefficients from multispectral palm images seems to be a novel feature representa-
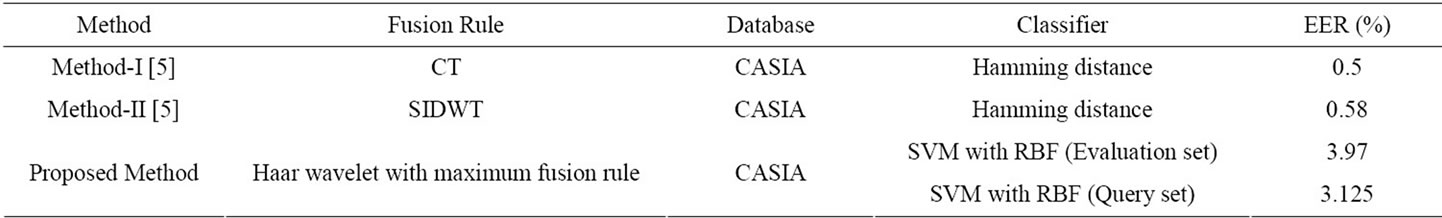
Table 3. Comparison table.
tion technique. It accumulates most of the prominent and distinctive features. Using ant colony optimization algorithm, a small set of distinctive features is found. This optimal set of features is used for authentication. It not only increases the efficacy of the system, but also reduces the time to authenticate a person.
• The system in [5] uses mutual information based registration for feature representation of multispectral palm images. Also, it has used pixel-level fusion to fuse multispectral palm images and feature-level image registration is applied for alignment. However, in this method there is a possibility of occurring errors due to alignment at the time of feature-level registration and as a result, its performance may not be robust. But this is not the case with the proposed system.
Another multispectral palmprint authentication system has been presented in [15] where the wavelet based image fusion scheme is applied. Gabor wavelet is used with the competitive code scheme for features extraction and data-level fusion is applied with discrete wavelet transform and decomposition for fusion of multispectral palm images. The test is performed on two sets of multispectral images: original multispectral images and simulated palm images with motion blurred effect. The experimental results are determined from 6000 groups of palm images. It shows superior performance when EER are computed from each band of red, green, blue and IR separately, as well as from the fused representation of these bands.
Several observations can be made where not only different multispectral palm images achieve high EER, but also the fused image of different bands achieves high EER. In the original set, red band shows 0.0248% EER while the fused RGBI shows 0.0696% EER. In case of simulated one, blurred red image shows 0.0822% EER while blurred RGBI fused image has 0.0786% EER. It can be seen clearly that the original ones achieve high EER than the simulated ones when the results are compared with the simulated ones.
From Table 2, it can be observed that EERs are found to be 3.97% and 6.19% in case of evaluation set when SVM with RBF and normalized correlation are used for classification respectively. Moreover, these EERs are obtained when ant colony optimization algorithm is used for scaling the high dimensional feature space of Gabor wavelets coefficients and obtain an optimal set of features. On the other hand, EERs of [15] and [5] are found to be 0.0696% and 0.5%, respectively. In the proposed system, a novel feature representation technique is adopted while it extracts Gabor coefficients from multispectral palm images. In addition, a small set of distinctive features is selected using ant colony optimization which has several advantages as a high dimensional feature space reduction technique. However, due to several demerits detected in ant colony optimization algorithm, performance of the proposed system degrades and EERs are found similar to those mentioned earlier in this section. The fundamental problem with ant colony optimization algorithm is that it ignores the interaction with the classifiers and each feature is considered separately. Moreover, it ignores the feature dependencies which may lead to worse classification performance when it is compared to other feature selection techniques. But in case of [5] and [15] no such problem has been detected when the systems have been implemented with different strategies. The system in [5] uses mutual information based registration and pixel-level fusion to fuse multispectral palm images. Error occurs during feature-level image registration does not affect much to the overall performance of the system. While in case of [15], Gabor wavelet is used with the competitive code scheme for features extraction and data-level fusion is applied with discrete wavelet transform and decomposition for fusion of multispectral palm images. However, the proposed method shows the results on fused image of multispectral bands rather than individual bands.
8. Conclusion
In this paper, an efficient palmprint authentication system based on the fusion of multi-spectral palm images has been proposed. It uses wavelet decomposition for palm image fusion, Gabor wavelets for coefficients extraction and ant colony optimization system for selection of prominent features. For authentication, SVM is used to classify of query samples from the training samples. Multi-spectral palm images are fused at low level by wavelet transform and decomposition where fused palm image is further represented by Gabor wavelet transform to capture the minimal intra-class diversity of the same instances and the inter-class differences between the different subjects are maximized in terms of neighborhood pixel intensity changes. Gabor palm responses contain high dimensionality features and due to this high dimensionality, ant colony optimization (ACO) algorithm is applied to choose a set of distinct features. Finally, two different classifiers are used, namely, normalized correlation and SVM with linear and RBF kernels. To measure the efficacy and robustness of the proposed system, CASIA multi-spectral palm database has been used. Experimental results reveal that the proposed system has performed better that the well-known systems.
9. Acknowledgements
Authors would like to thank the reviewers for their valuable comments which have helped to improve the quality of the manuscript.
REFERENCES
- Y. W. Wong, K. P. Seng, L.-M. Ang, W. Y. Khor and F. Liau, “Audio-Visual Recognition System with Intra-Modal Fusion,” Proceedings of the International Conference on Computational Intelligence and Security, Harbin, 15- 19 December 2007, pp. 609-613.
- A. K. Ross, K. Nandakumar and A. K. Jain, “Handbook of Multibiometrics,” Springer Verlag, New York, 2006.
- A. K. Jain, P. Flynn and A. Ross, “Handbook of Biometrics,” Springer-Verlag, New York, 2007.
- D. R. Kisku, J. K. Sing, M. Tistarelli and P. Gupta, “Multisensor Biometric Evidence Fusion for Person Authentication using Wavelet Decomposition and Monotonic-Decreasing Graph,” Proceedings of the 7th IEEE International Conference on Advances in Pattern Recognition, 4-6 February 2009, pp. 205-208.
- Y. H. Z. Sun, T. Tan and C. Ren, “Multi-Spectral Palm Image Fusion for Accurate Contact-Free Palmprint Recognition,” Proceedings of the IEEE International Conference on Image Processing, Beijing, 12-15 October 2008, pp. 281-284.
- Y. Hao, Z. Sun and T. Tan, “Comparative Studies on Multispectral Palm Image Fusion for Biometrics,” Proceedings of the Asian Conference on Computer Vision, Vol. 2, 2007, pp. 12-21.
- D. Zhang, “Palmprint Authentication,” Kluwer Academic Publishers, Boston, 2004.
- D. Zhang, W. K. Kong, J. You and M. Wong, “On-Line Palmprint Identification,” IEEE Transactions on Pattern Analysis and Machine Intelligence, Vol. 25, 2003, pp. 1041-1050. doi:10.1109/TPAMI.2003.1227981
- A. Kong and D. Zhang, “Competitive Coding Scheme for Palmprint Verification,” Proceedings of the International Conference on Pattern Recognition, Vol. 1, 2004, pp. 520- 523.
- L. Zhang and D. Zhang, “Characterization of Palmprints by Wavelet Signatures via Directional Context Modeling,” IEEE Transactions on SMC-B, Vol. 34, No. 3, 2004, pp. 1335-1347.
- W. K. Kong, D. Zhang and W. Li, “Palmprint Feature Extraction Using 2-D Gabor Filters,” Pattern Recognition, Vol. 36, No. 10, 2003, pp. 2339-2347. doi:10.1016/S0031-3203(03)00121-3
- Z. Guo, D. Zhang, L. Zhang and W. Zuo, “Palmprint Verification Using Binary Orientation Co-Occurrence Vector,” Pattern Recognition Letters, Vol. 30, No. 13, 2009, pp. 1219-1227. doi:10.1016/j.patrec.2009.05.010
- Z. Sun, T. Tan, Y. Wang and S. Z. Li, “Ordinal Palmprint Representation for Personal Identification,” Proceedings of the IEEE Computer Society Conference on Computer Vision and Pattern Recognition, Beijing, 20-25 June 2005, pp. 279-284.
- M. Dash and H. Liu, “Feature Selection for Classification,” Intelligent Data Analysis, Vol. 1, No. 1-4, 1997, pp. 131-156. doi:10.1016/S1088-467X(97)00008-5
- D. Han, Z. Guo and D. Zhang, “Multispectral Palmprint Recognition Using Wavelet-Based Image Fusion,” Proceedings of the International Conference on Signal Processing, Hong Kong, 26-29 October 2008, pp. 2074-2077.
- D. Zhang, Z. Guo, G. Lu, L. Zhang and W. Zuo, “An Online System of Multi-Spectral Palmprint Verification,” IEEE Transactions on Instrumentation and Measurement, Vol. 59, No. 2, 2010, pp. 480-490. doi:10.1109/TIM.2009.2028772
- Z. Guo, L. Zhang and D. Zhang, “Feature Band Selection for Multispectral Palmprint Recognition,” Proceedings of the 20th International Conference on Pattern Recognition, 2010, pp. 1136-1139.
- R. K. Rowe, U. Uludag, M. Demirkus, S. Parthasaradhi and A. K. Jain, “A Multispectral Whole-Hand Biometric Authentication System,” Proceedings of the Biometric Symposium (BSYM), 11-13 September 2007, pp. 1-6. doi:10.1109/BCC.2007.4430532
- M. Dorigo, L. M. Gambardella, M. Birattari, A. Martinoli, R. Poli and T. Stützle, “Ant Colony Optimization and Swarm Intelligence,” Proceedings of the 5th International Workshop ANTS, LNCS 4150, Springer Verlag, New York, 2006.
- C. J. C. Burges, “A Tutorial on Support Vector Machines for Pattern Recognition,” Data Mining and Knowledge Discovery, Vol. 2, No. 2, 1998, pp. 121-167. doi:10.1023/A:1009715923555
- T. S. Lee, “Image Representation using 2D Gabor Wavelets,” IEEE Transactions on Pattern Analysis and Machine Intelligence, Vol. 18, No. 10, 1996, pp. 959-971. doi:10.1109/34.541406
NOTES
*Corresponding author.