Agricultural Sciences
Vol.3 No.2(2012), Article ID:18395,11 pages DOI:10.4236/as.2012.32035
Relationship of late-season ear leaf nitrogen with earlyto mid-season plant height of corn
![]()
1Department of Plant Sciences, The University of Tennessee, Jackson, USA; *Corresponding Author: xyin2@utk.edu
2West Tennessee Research and Education Center, The University of Tennessee, Jackson, USA
Received 8 December 2011; revised 25 January 2012; accepted 4 February 2012
Keywords: Corn; Ear Leaf N; Plant Height; Relationship; Models; Cropping Systems
ABSTRACT
Nitrogen concentration in the ear leaf is a good indicator of corn (Zea mays L.) N nutrition status during late growing season. This study was done to examine the relationship of late-season ear leaf N concentration with earlyto mid-season plant height of corn at Milan, TN from 2008 to 2010 using linear, quadratic, square root, logarithmic, and exponential models. Six N rate treatments (0, 62, 123, 185, 247, and 308 kg·N·ha−1) repeated four times were implemented each year in a randomized complete block design under four major cropping systems: corn after corn, corn after soybean [Glycine max (L.) Merr.], corn after cotton [Gossypium hirsutum (L.)], and irrigated corn after soybean. The relationship of ear leaf N concentration determined at the blister growth stage (R2) with plant height measured at the 6-leaf (V6), 10-leaf (V10), and 12-leaf (V12) growth stages was statistically significant and positive in non-irrigated corn under normal weather conditions. However, the strength of this relationship was weak to moderate with the determination coefficient (R2) values ranging from 0.21 to 0.51. This relationship was generally improved as the growing season progressed from V6 to V12. Irrigation and abnormal weather seemed to have adverse effects on this relationship. The five regression models performed similarly in the evaluation of this relationship regardless of growth stage, year, and cropping system. Our results suggest that unlike the relationship of corn yield at harvest with plant height measured during earlyto mid-season or the relationship of leaf N concentration with plant height when both are measured simultaneously during earlyto mid-season, the relationship of late-season ear leaf N concentration with earlyto mid-season plant height may not be strong enough to be used to develop algorithms for variable-rate N applications on corn within a field no matter which regression model is used to describe this relationship.
1. INTRODUCTION
Precision N management has shown beneficial effects on increasing crop productivity and economic returns and reducing N losses [1-4]. Similar to canopy normalized difference vegetation index (NDVI) [5,6], plant height has been increasingly examined during the past several years for its potential to be utilized in developing algorithms to guide variable-rate N applications within a field since plant height can be measured non-destructively and at high resolutions during the growing season via ultrasound distance sensing [7]. If plant height can be used to estimate the spatial variability of crop response to N fertilization within a field during the earlyto mid-season, the integration of plant height sensing with variable-rate application and the Global Positioning System will enable on-the-go diagnosis of crop N deficiencies within a field, real-time application of N fertilizer at variable rates to correct those deficiencies, and precisely treating each part of the field sensed without data pre-processing or determining location within a field beforehand. Therefore, this system can minimize labor and cost on variable-rate N applications at high resolutions compared with the other precision N management systems such as grid sampling of soil or/and plant.
Compared with canopy NDVI [1,2,4-6,8], much less information is available about the possible physiological bases for using plant height in precision N management [9-11]. Katsvairo et al. [9] and Sadler et al. [11] observed significant and consistent spatial variability in plant height within a field during corn vegetative growth. Katsvairo et al. [9] and Machado et al. [10] reported that there was a close correlation between corn yield and plant height during earlyand mid-season, but this correlation was affected by locations and years. Yin et al. [12] found that corn yield related well with plant height at V10 to V12 under major corn production systems and normal weather conditions. The relationship of plant biomass with plant height of corn was strong when both measurements were taken at the V6 growth stage [13]. Yin et al. [13] reported that leaf N closely regressed with plant height when both measurements were taken at the same time during V6 to V12 under normal weather conditions. However, the relationship of late-season leaf N concentration with earlyto mid-season plant height has so far not been documented.
Nitrogen fertilizer recommendations for corn are made based on yield goals in many areas. Additionally, plant N nutrition status is also used to assess corn N needs and guide in-season N applications. Therefore, the investigations of Yin et al. [12,13] provide some sound physiological bases for using plant height sensing as a viable means to predict corn yield and assess plant N nutrition status and thus estimating the spatial variability of corn responses to N fertilization.
Plant N nutrition status during late growing season is critical in corn production. Nitrogen concentration in the ear leaf is a good indicator of plant N nutrition status of corn during late growing season. If plant height measured during earlyto mid-season is used to guide variable-rate N applications on corn during the season, whether late-season ear leaf N concentration relates to earlyto mid-season plant height becomes an interesting research topic. The objective of this study was to evaluate the relationship of ear leaf N concentration determined in late growing season with plant height measured during earlyto midseason under major corn cropping systems using different regression models.
2. MATERIALS AND METHODS
A field experiment was conducted on the University of Tennessee’s Research and Education Center at Milan, TN from 2008 through 2010. Six N rate treatments of 0, 62, 123, 185, 247, and 308 kg·N·ha−1 were replicated four times in a randomized complete block design. These six N treatments were implemented each year under four different corn cropping systems which were continuous corn, corn after soybean, corn after cotton, and irrigated corn after soybean. The three non-irrigated cropping systems were placed in adjacent parts of the same field, and the irrigated cropping system was arranged in an adjacent field each season. All fields used in this trial had an over 10-year continuous no-tillage production history. The three non-irrigated cropping systems were evaluated on a Grenada soil (fine-silty, mixed, active, thermic Oxyaquic Fraglossudalfs) in all three years. The irrigated cropping system was tested on a Loring soil (fine-silty, mixed, active, thermic Oxyaquic Fragiudalfs) each year.
In this trial, the plots were 9.1 m long and 4.6 m wide. All N fertilizer was uniformly broadcast on the soil surface within a week after corn planting as ammonium nitrate (N-P-K = 34-0-0) each year. Corn (c.v. Pioneer 33N58) was planted in a 76 cm row width under no-tillage for all cropping systems on 22 April 2008, 17 April 2009, and 13 April 2010 with a John Deere vacuum planter (John Deere, Moline, IL). Weeds, pests, and diseases were managed as needed according to the University of Tennessee Extension Service’s recommended management practices for corn. Both P and K fertilizers were applied each year according to the University of Tennessee Extension Service’s recommendations based on soil test results [14]. A Valley linear irrigation system (Valmont Irrigation, Valley, NE) was used to irrigate corn in the irrigated cropping system. The same amount of irrigation water was applied to all treatments at each irrigation event based on the MOIST soil moisture management system [15].
A composite soil sample comprised of 10 cores was taken randomly with a hand probe of 2.5 cm diameter from the experimental area at the 0 - 15 cm depth during the previous fall of each year. After the samples were air-dried, ground to pass through a 2 mm screen, and mixed, they were analyzed for soil pH and available P and K. Soil pH was measured in a 1:1 soil: H2O solution [16]. Soil available P and K were extracted with the Mehlich I method [17].
Plant height measurements were taken from eight randomly selected plants in the two center rows of each plot with a meterstick at growth stages of around V6 (11 June 2008 and 25 May 2010), V10 (19 June 2008, 17 June 2009, and 10 June 2010), and V12 (2 July 2008, 24 June 2009, and 16 June 2010). Plant height was measured from the soil surface to the top of the most recently fully developed leaf. Average plant height was calculated for each plot in each cropping system-year.
Ear leaf samples were collected at random from eight plants in the two center rows of each plot for all cropping system-years at the growth stage of around R2 (18 July 2008, 23 July 2009, and 14 July 2010). All leaf samples were oven-dried at 65˚C, and ground to pass through a 1-mm screen. Total N content in ear leaf was determined by dry combustion with a Leco TruSpec C and N Analyzer (Leco, St. Joseph, MI) [18].
The two center rows of corn were harvested from each plot at physiological maturity for grain yield using a small plot combine with an automatic weighing scale and a moisture meter. Non-irrigated corn was harvested on 9 September 2008, 9 September 2009, and 23 August 2010, respectively. Irrigated corn was combined on 11 September 2008, 28 September 2009, and 23 August 2010. Grain yield was adjusted to a standard moisture content of 155 g·kg−1. Daily rainfall and air temperatures were recorded on site for all three growing seasons.
Regression analyses were conducted with early leaf N concentration determined at R2 as the dependent variable and plant height measured at V6, V10, and V12 as the independent variable to assess the relationship of ear leaf N at R2 with plant height at V6, V10, and V12, respectively. Linear (y = a + b × x), quadratic (y = a + b × x + c × x2), square root (y = a + b × ), logarithmic, (y = a + b × ln (x)), and exponential (y = a × eb×x) models were used for these analyses. Regressions were conducted on the following four different types of data: Each cropping system-year, each cropping system across the three years, each year across the four cropping systems, and across the four cropping systems and the three years.
Relative ear leaf N concentration was calculated for each plot within each cropping system-year as follows: Relative ear leaf N concentration = ear leaf N concentration of an individual plot/maximum plot ear leaf N concentration within the cropping system-year × 100. The relative data of ear leaf N concentration were used only in the regression analyses on data of each cropping system across the three years, each year across the four cropping systems, and across the four cropping systems and the three years.
In this study, the determination coefficient (R2) value was used to assess the relationship of ear leaf N concentration at R2 with plant height at V6, V10, and V12. The R2 value was calculated as the quotient of the sum of squares for regression divided by the corrected total sum of squares (SSregression/SScorrected total) for all models so that the five models are comparable. The GLM procedure in SAS for Windows V9.2 (SAS Institute, Cary, NC) was used for the linear, quadratic, square root, and logarithmic models. For the square root and logarithmic models, new variables of square root (x) and ln (x) were generated, respectively, before performing the GLM analyses. The NLIN procedure in SAS was employed for the exponential model. Probability levels lower than 0.05 were designated as significant for all models.
3. RESULTS
Weather conditions varied among the three growing seasons (Figures 1 and 2). The 2010 season received an obviously higher amount of rainfall, particularly at the beginning of the season, than the other two seasons. Irrigated corn received 156 mm of irrigation water from 17 June to 26 August in 2008, 83 mm from 23 June to 13 August in 2009, and 177 mm from 17 June to 12 August in 2010. It is obvious that 2009 was somewhat cooler in July and August, but 2010 was unusually hotter during June to August, relative to 2008.
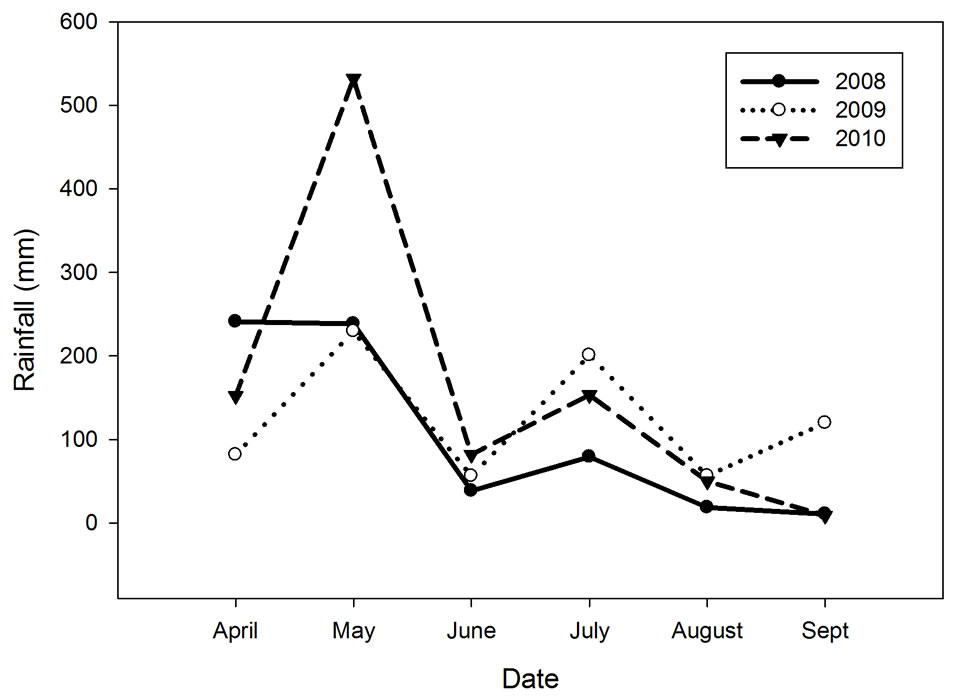
Figure 1. Rainfall during the growing season in 2008, 2009, and 2010 at Milan, TN.
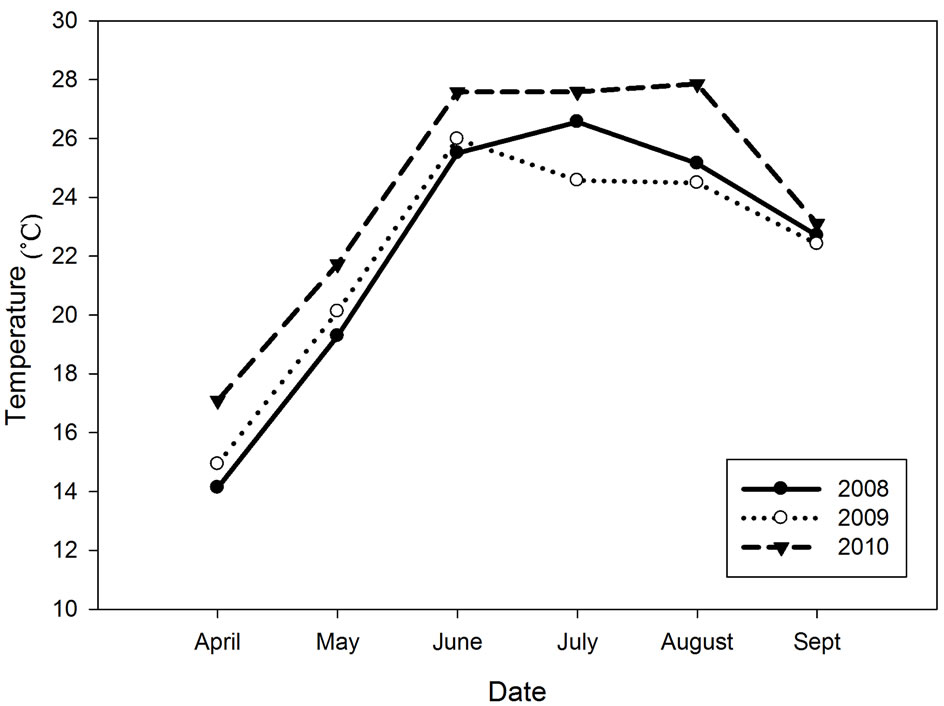
Figure 2. Air temperature during the growing season in 2008, 2009, and 2010 at Milan, TN.
3.1. Comparison of Models in Evaluating the Relationship of Ear Leaf N Concentration with Plant Height
The R2 and P values for the regression of ear leaf N concentration at R2 with plant height at V6, V10, and V12 were generally similar for the linear, quadratic, square root, logarithmic, and exponential models under each cropping system in all three years and on the averages of the three-year combined data (Tables 1-4). Similar trends were observed when data were combined across the four cropping systems within each year, and when data were combined across the four cropping systems and three years simultaneously (Table 5). Since corn produced at different yield levels under the four cropping systems [12], and the rainfall and air temperatures varied noticeably among the three growing seasons (Figures 1 and 2) in this study; our results suggest that the performances of these five regression models remain comparable under different corn cropping systems and
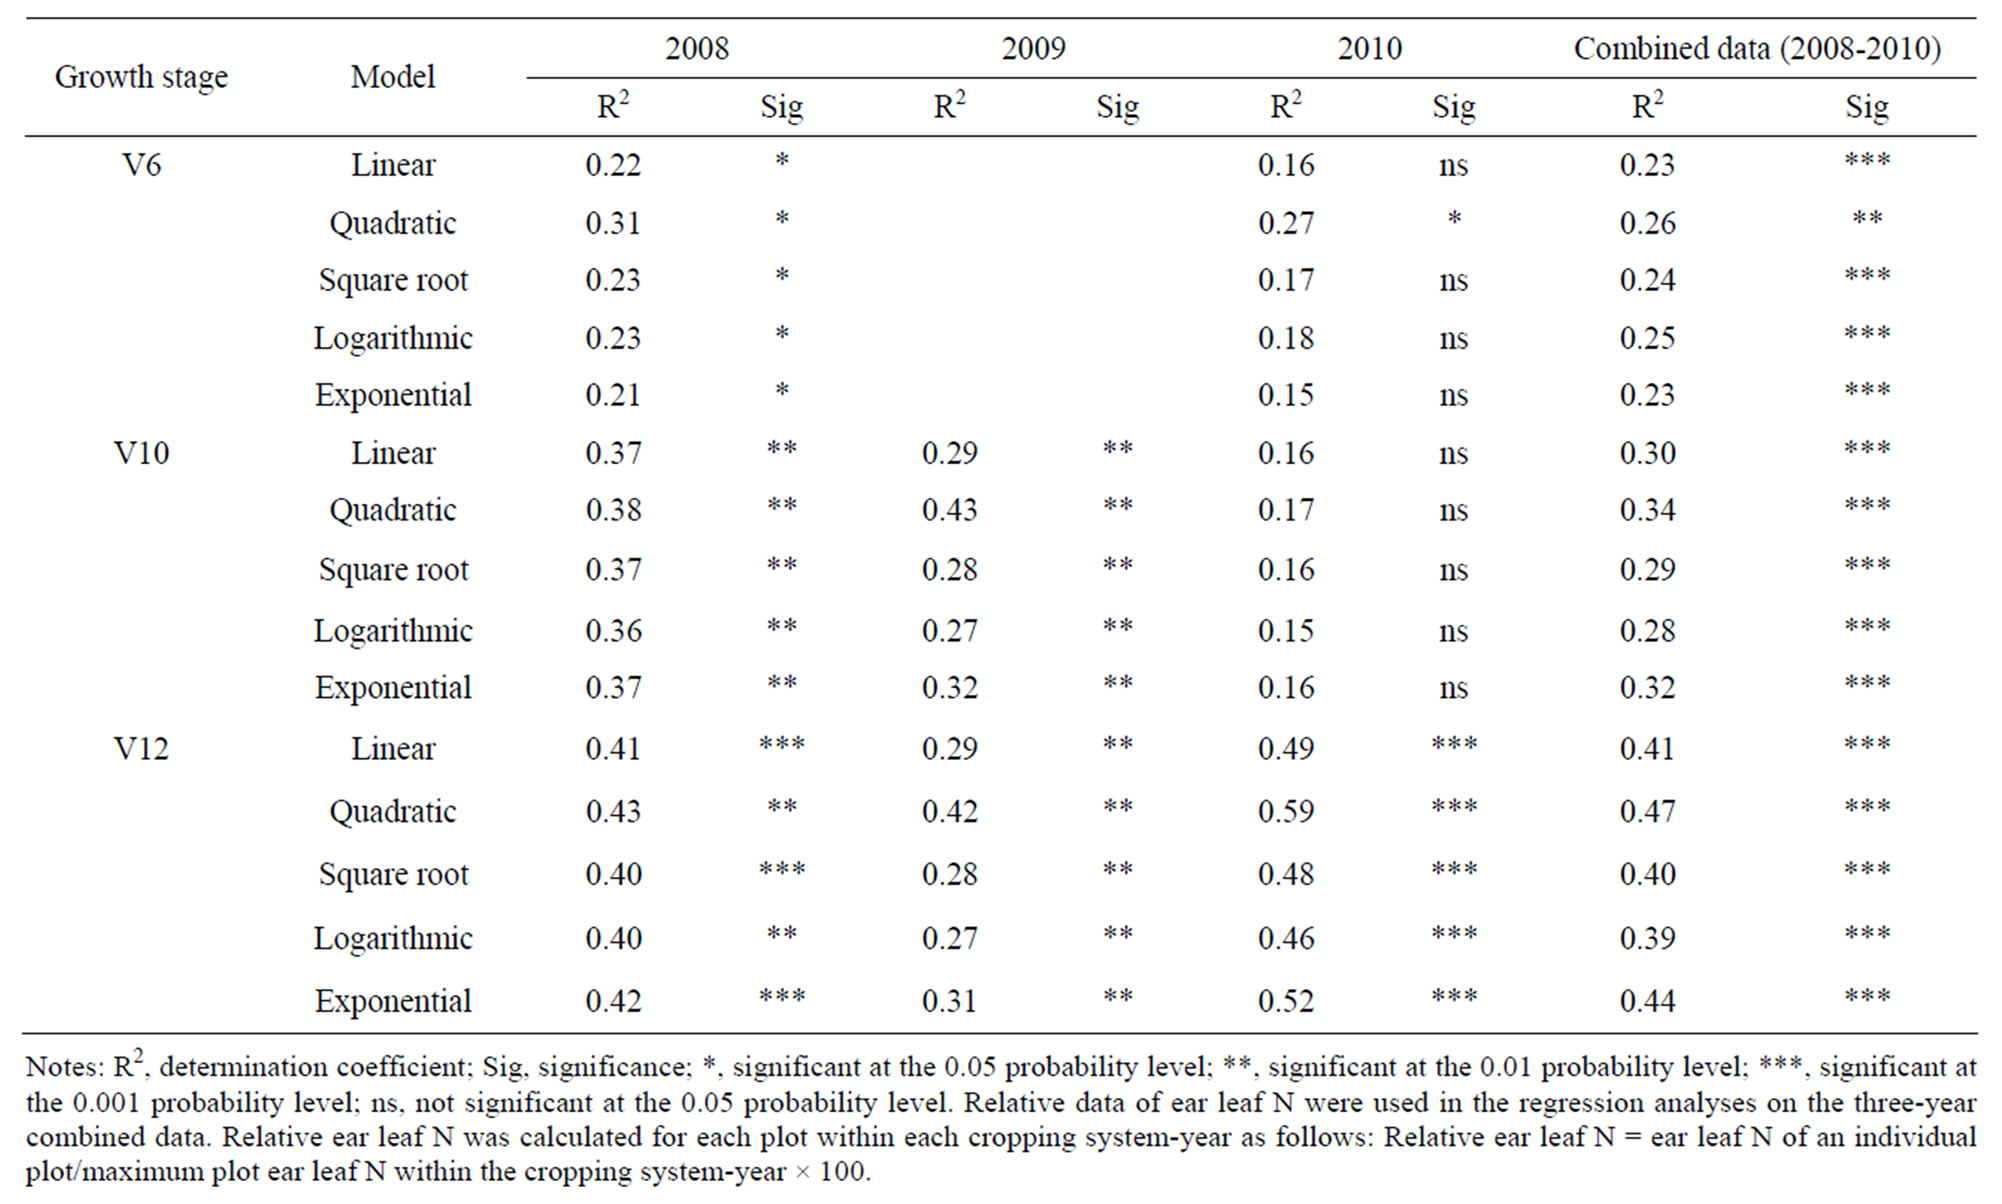
Table 1. Relationship of ear leaf N concentration at R2 with plant height at V6, V10, and V12 of continuous corn from 2008 to 2010.
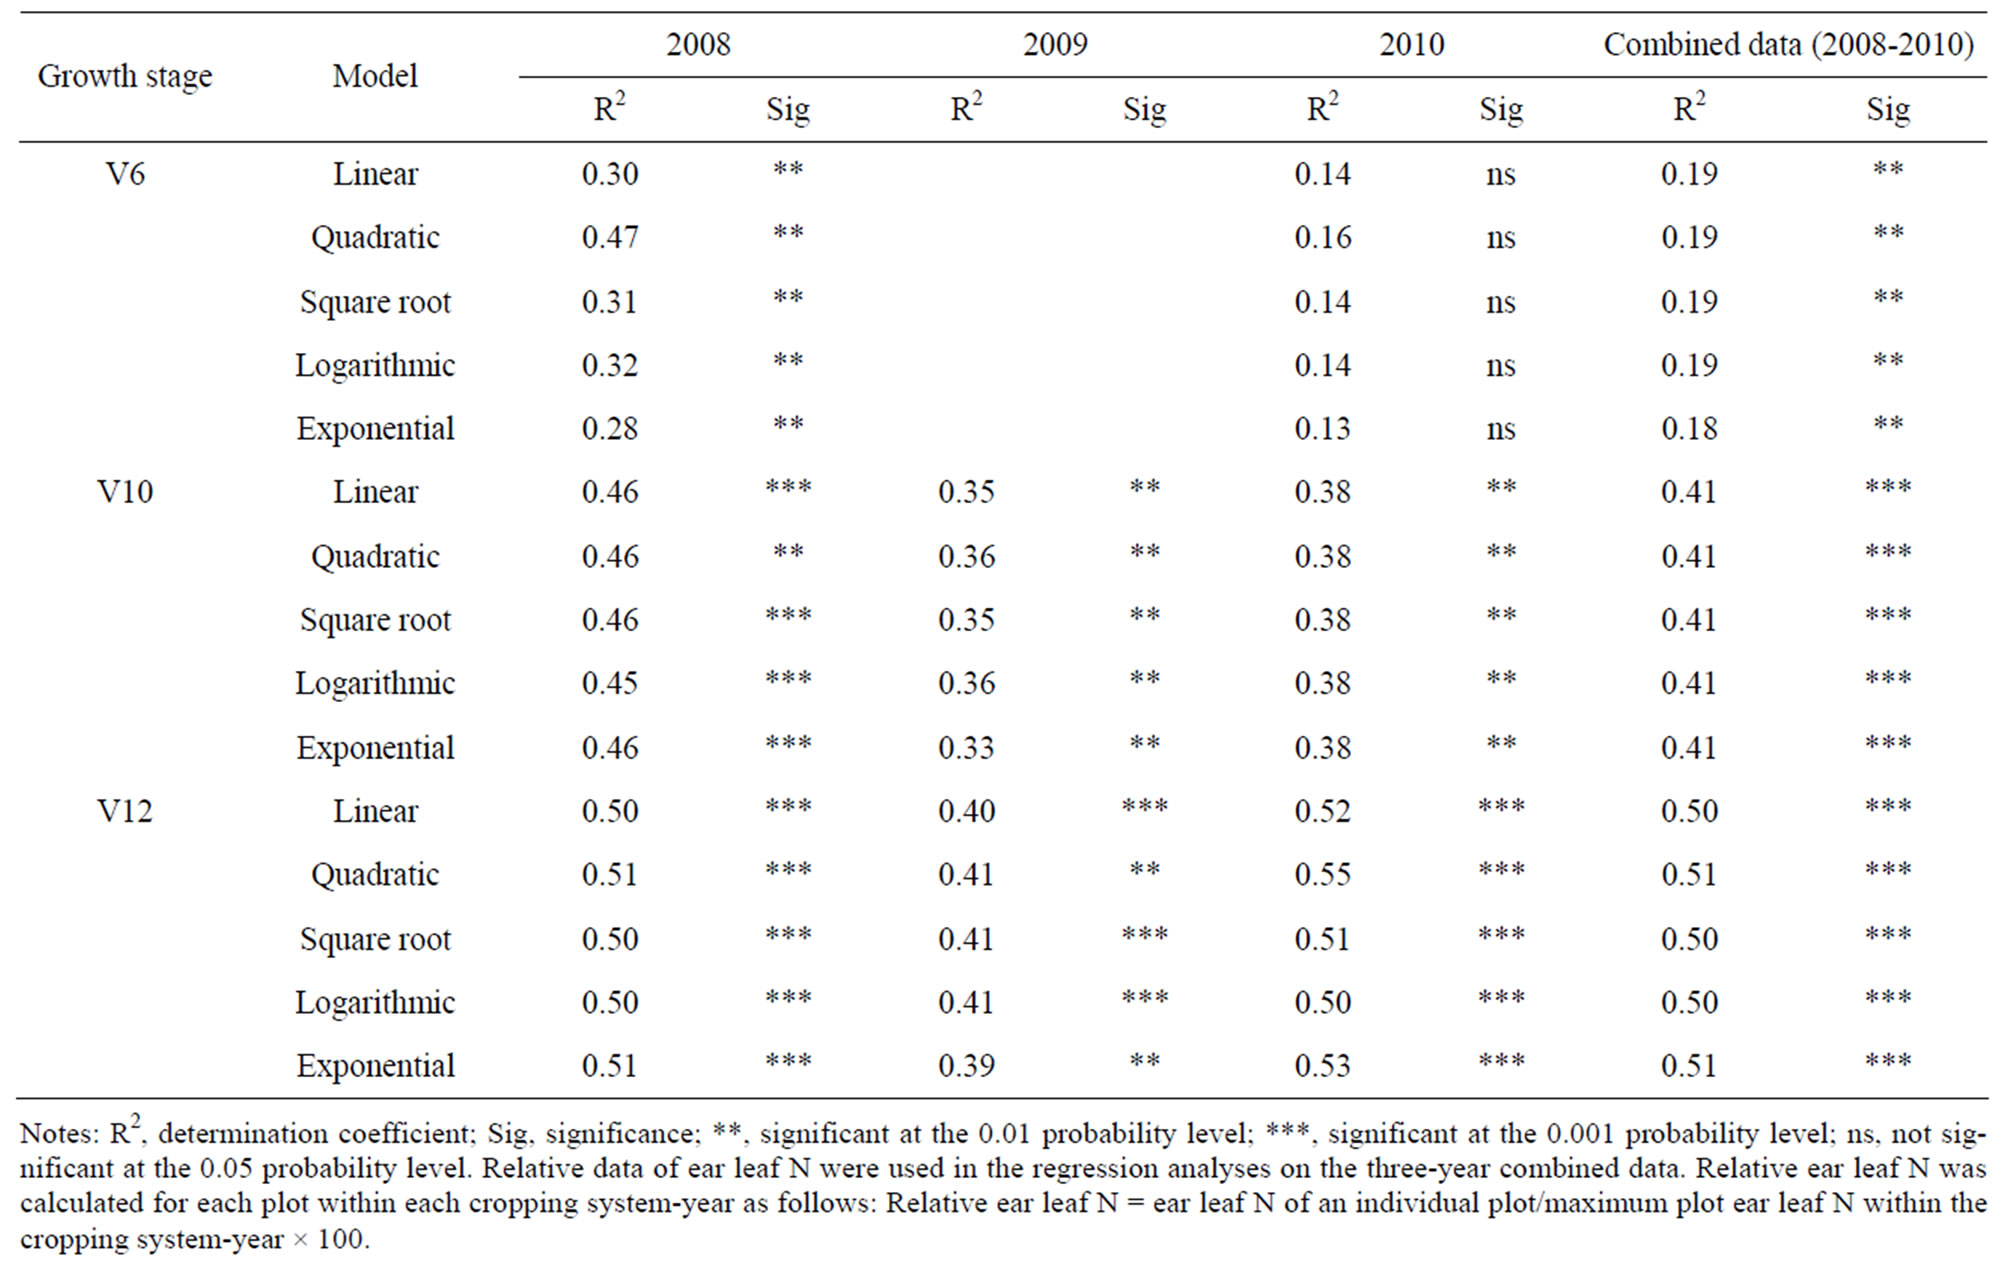
Table 2. Relationship of early leaf N concentration at R2 with plant height at V6, V10, and V12 of corn after soybean from 2008 to 2010.
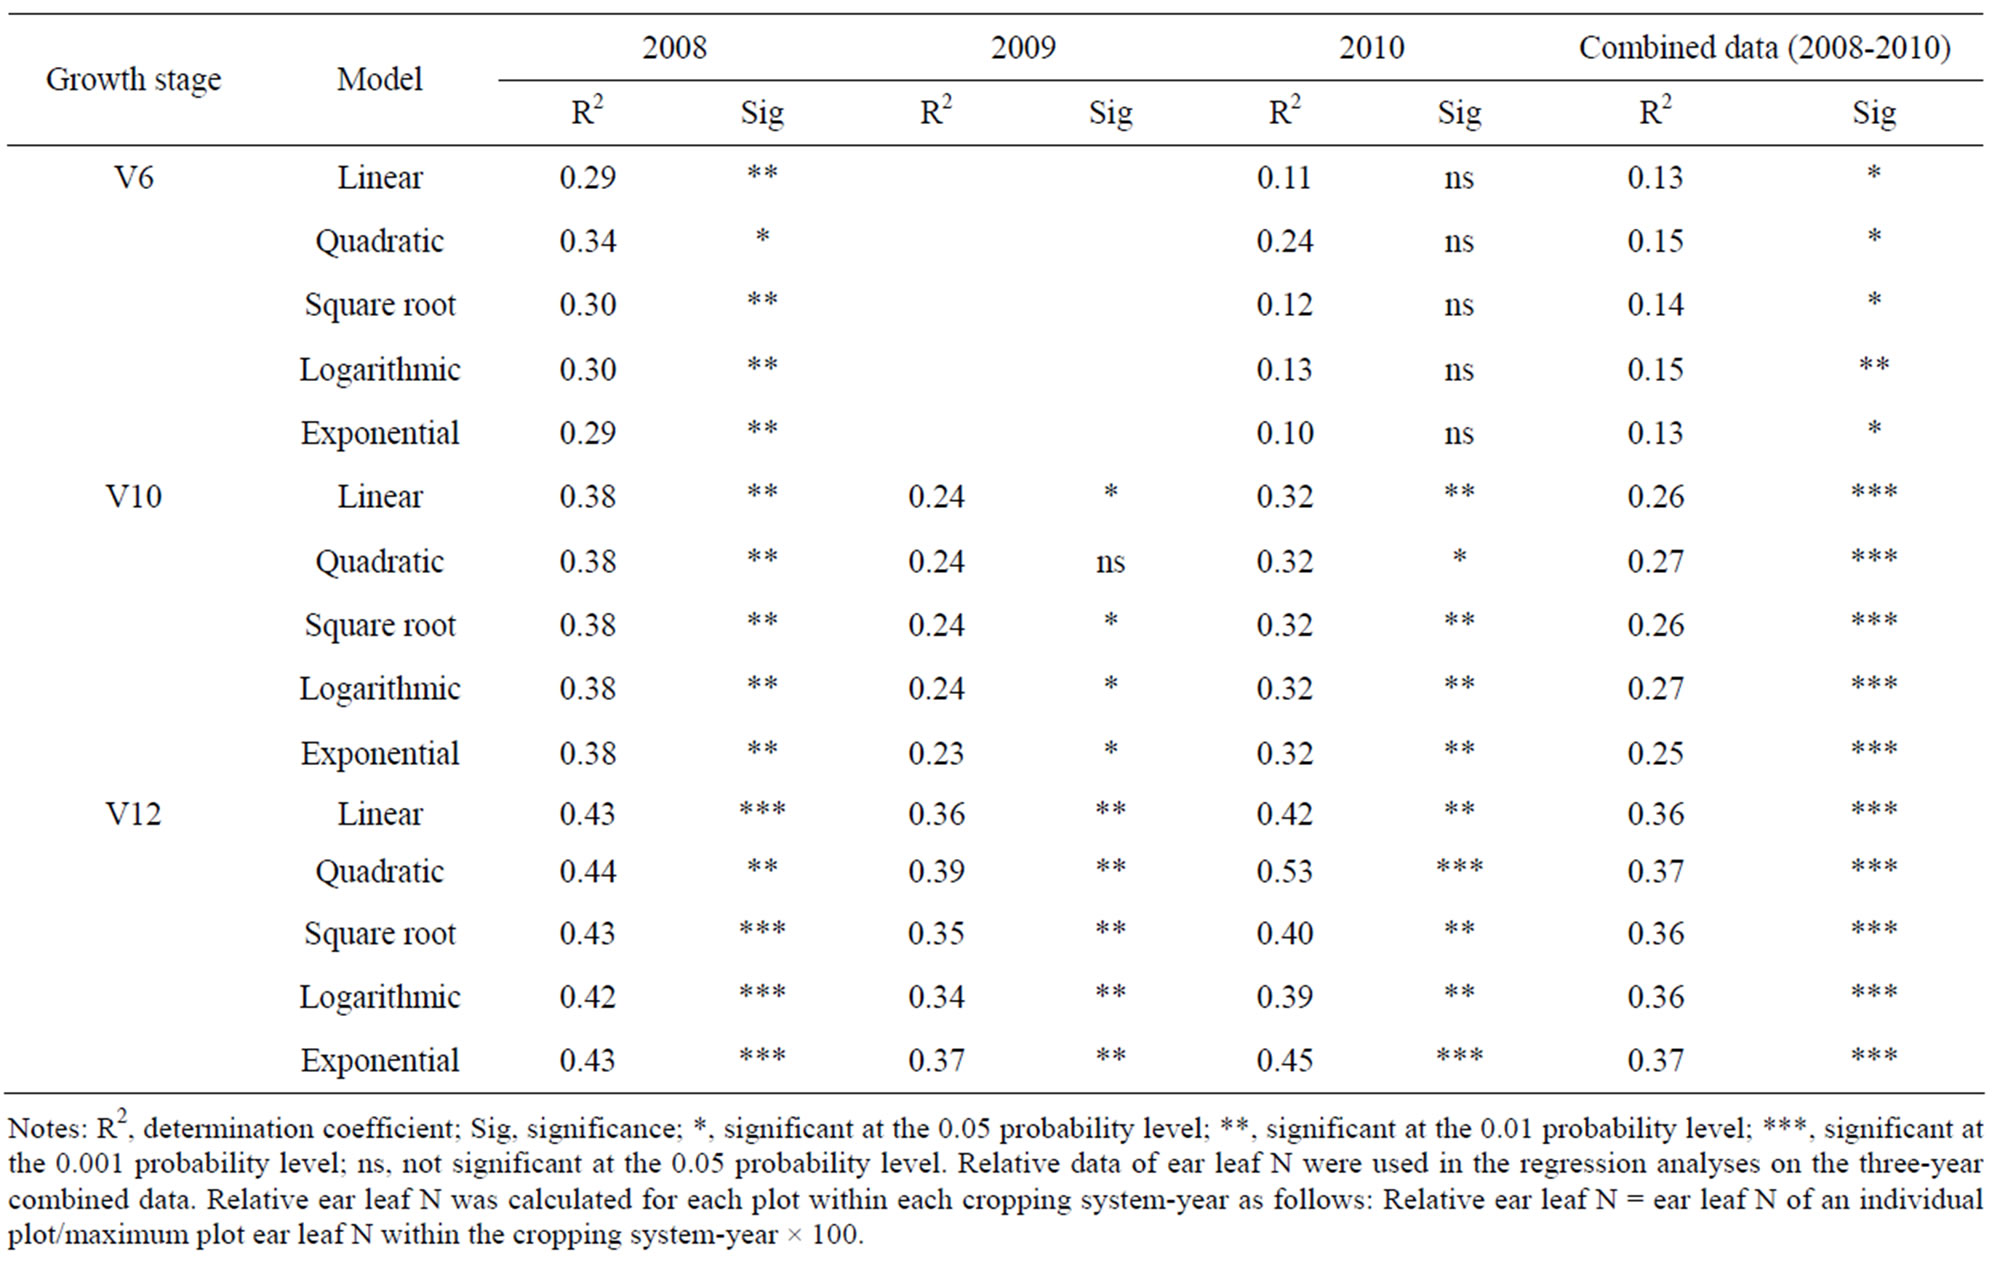
Table 3. Relationship of ear leaf N concentration at R2 with plant height at V6, V10, and V12 of corn after cotton from 2008 to 2010.
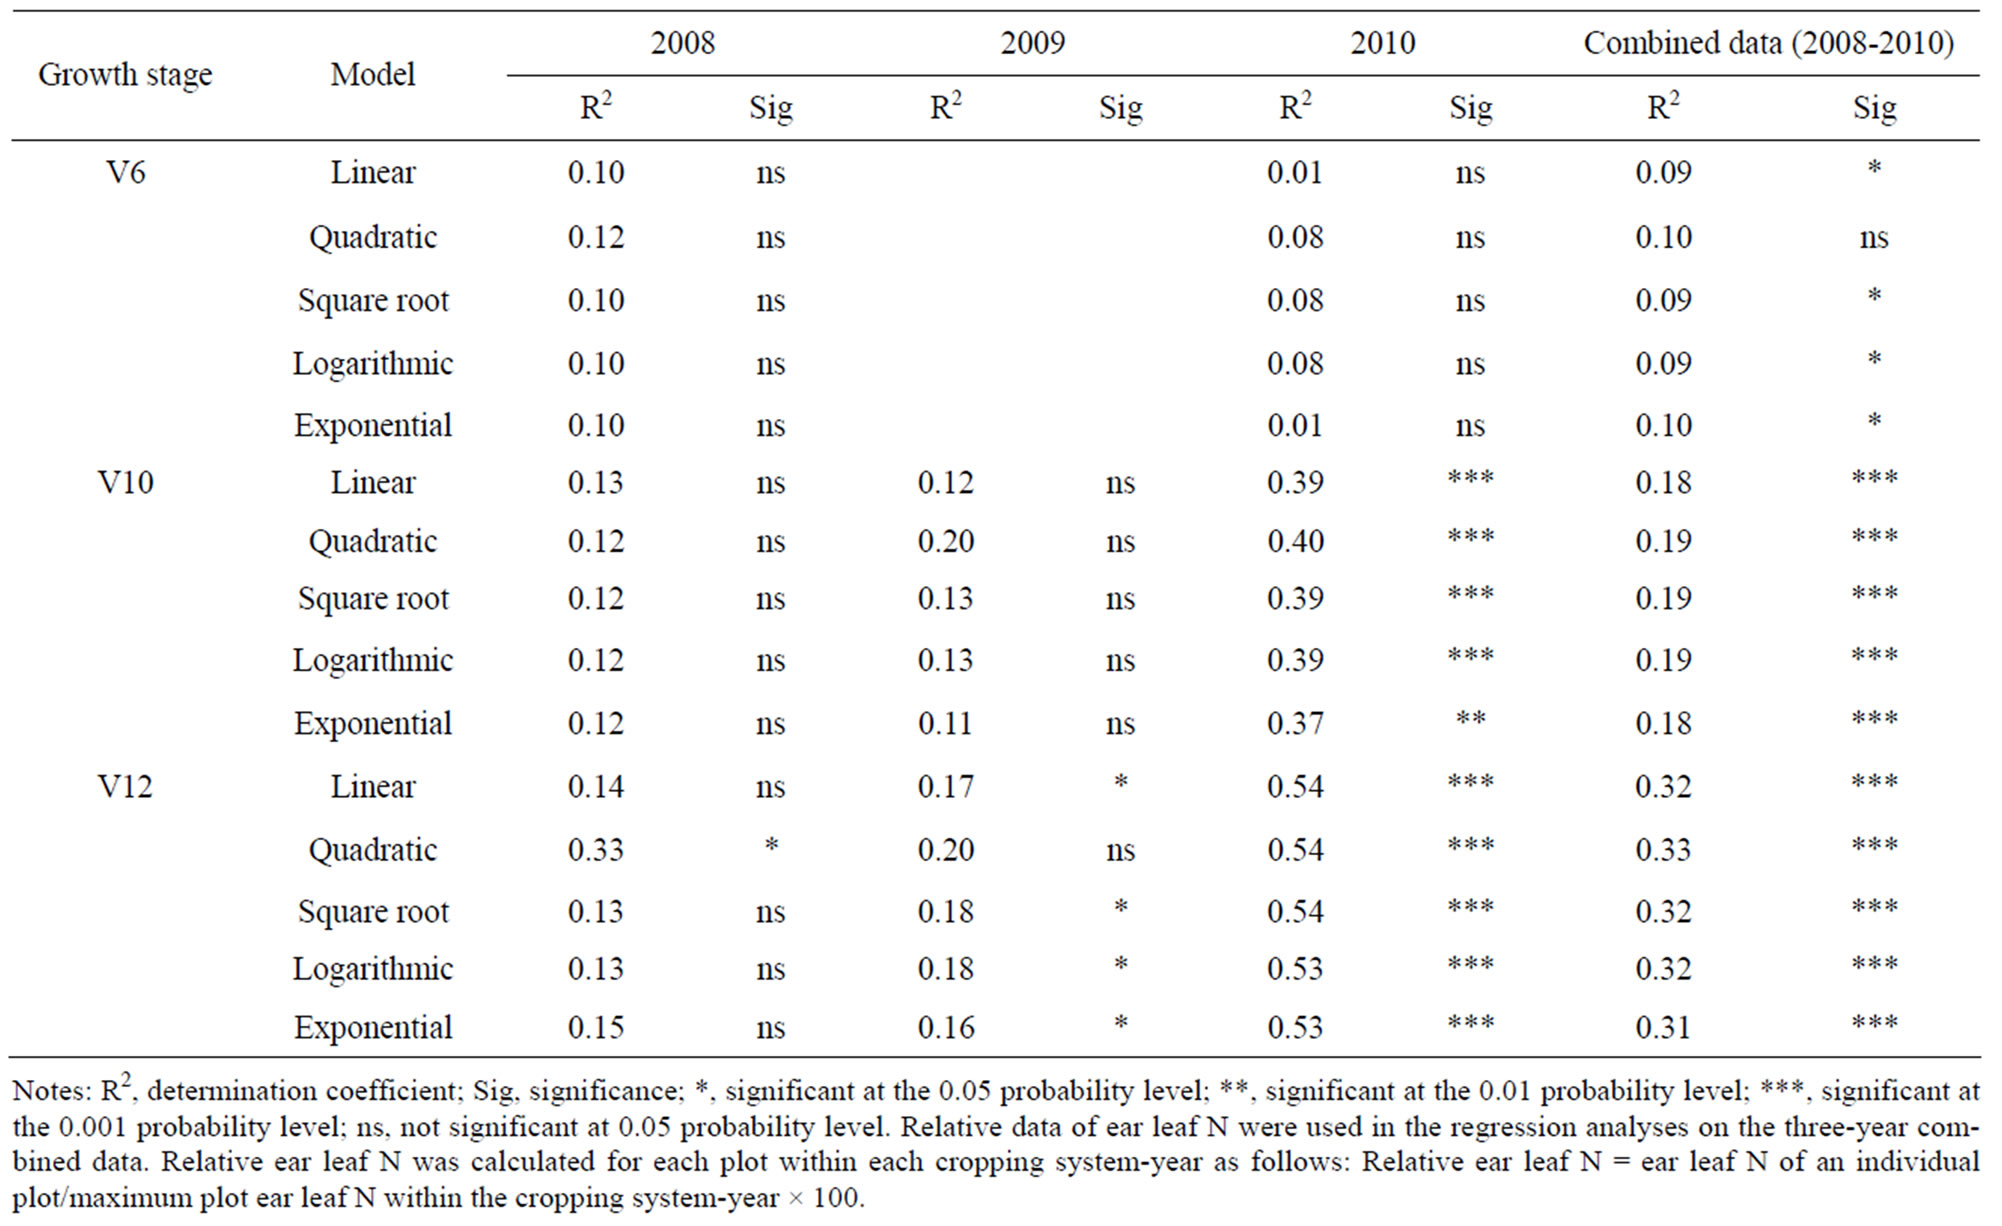
Table 4. Relationship of ear leaf N concentration at R2 with plant height at V6, V10, and V12 of irrigated corn after soybean from 2008 to 2010.
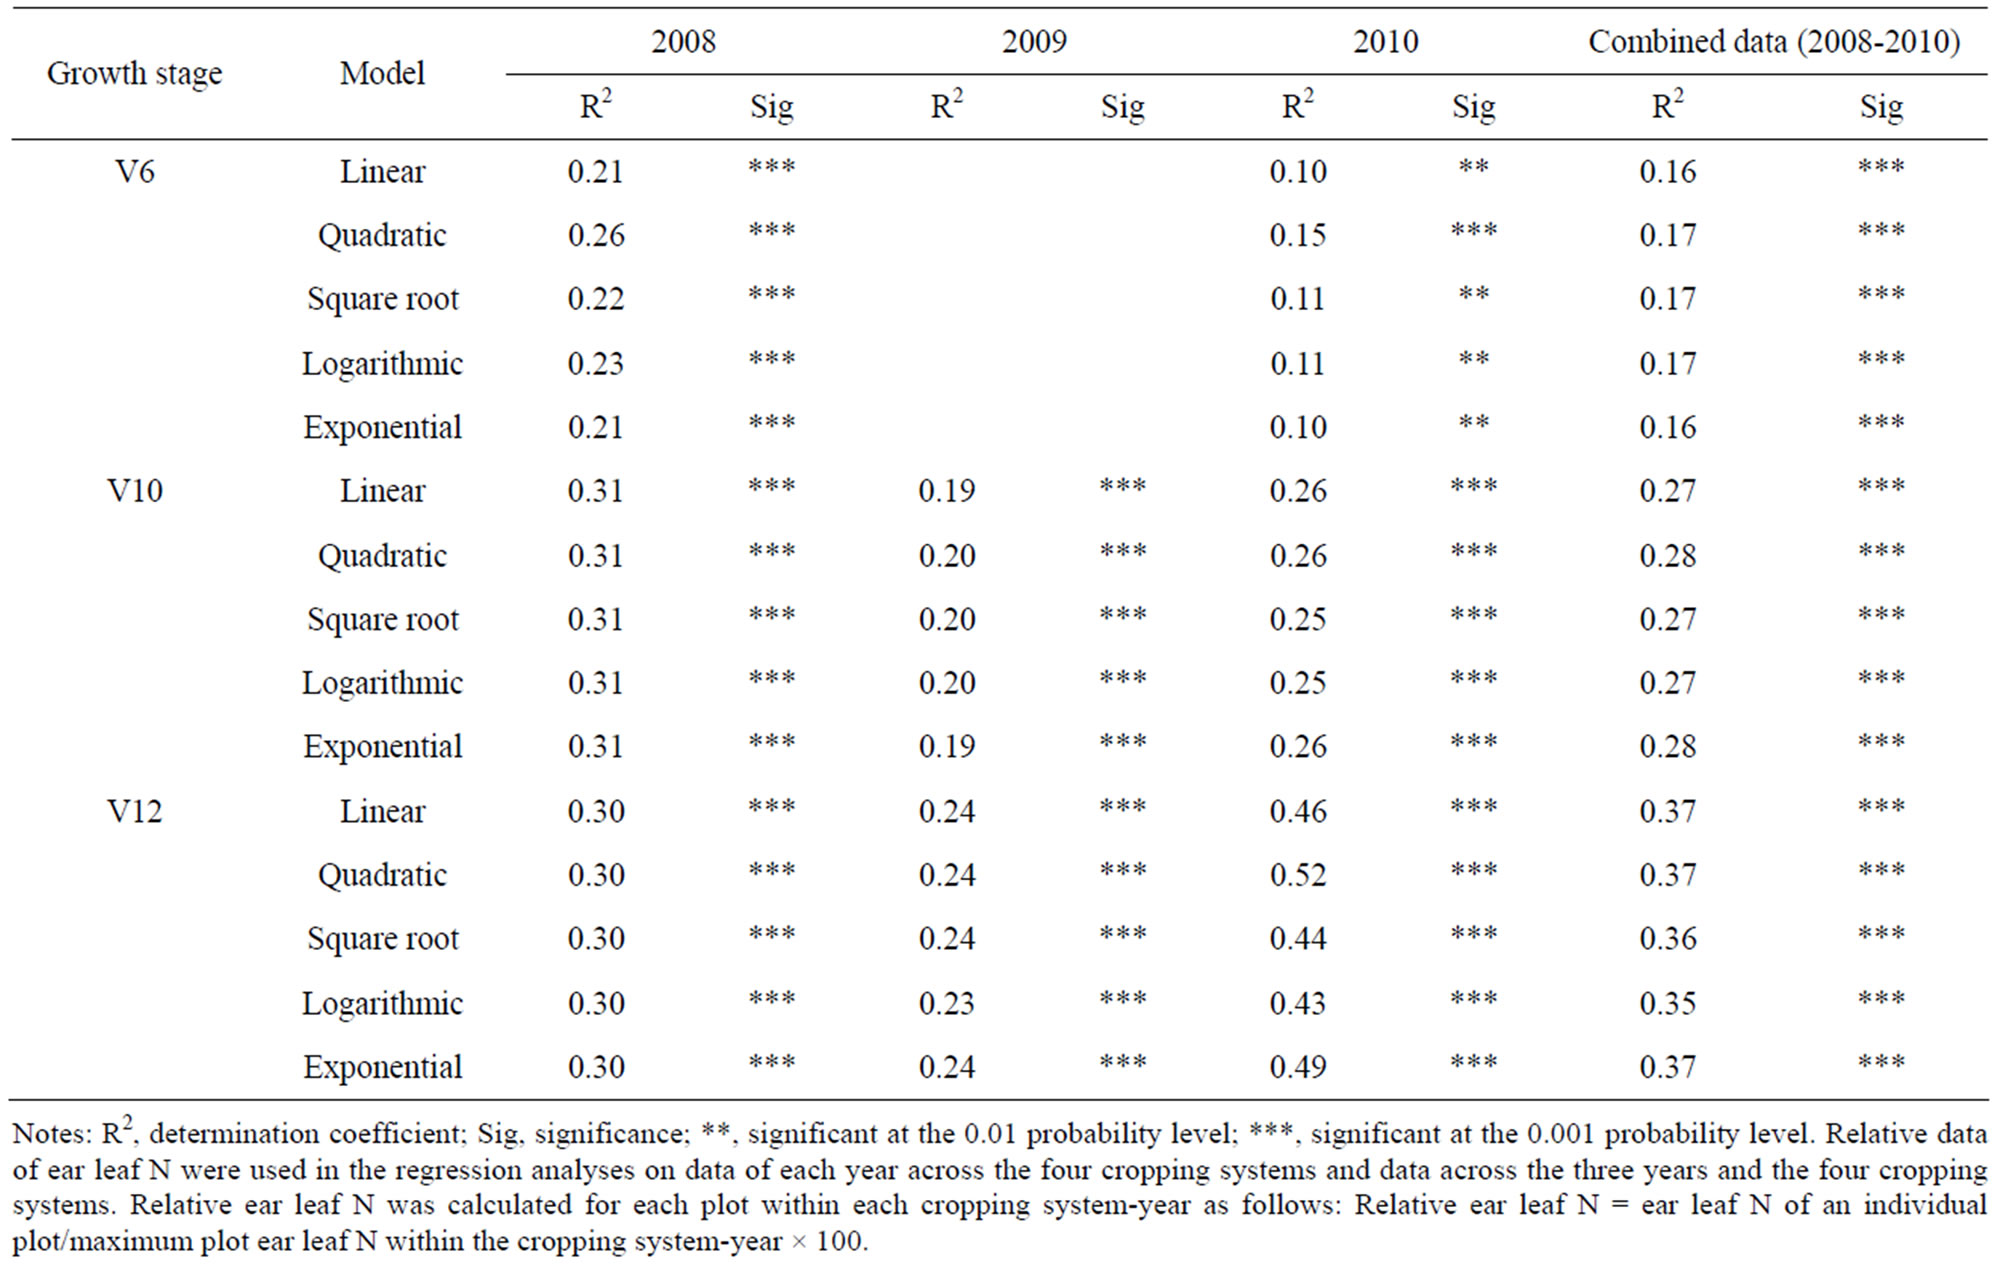
Table 5. Relationship of ear leaf N concentration at R2 with plant height at V6, V10, and V12 across the four cropping systems from 2008 to 2010.
weather conditions. Although these five models can all be used to evaluate the relationship of ear leaf N nutrition in late season with plant height during early-to midseason, the linear model may be the preferred model because of its simplicity.
3.2. Regression of Ear Leaf N Concentration with Plant Height
In continuous corn, the regressions of ear leaf N at R2 with plant height at V6, V10, and V12 were all significant under the five models in 2008 and 2009 (Table 1). With all five models ear leaf N concentration at R2 increased as plant height at V6, V10, and V12 increased although they described the relationship differently (Table 1, Figure 3). In 2010, however, the regression of ear leaf N at R2 with plant height was significant only when plant height was measured at V12. When the three-year data were combined, there was a significant regression of ear leaf N at R2 with plant height at V6, V10, and V12 in continuous corn (Table 1).
Similar tendencies were observed in the regression of ear leaf N at R2 with plant height at V6, V10, and V12 in corn after soybean and corn after cotton (Tables 2 and 3). In irrigated corn, the regression of ear leaf N at R2 with plant height was generally significant at V12 in 2009 and at V10 and V12 in 2010 (Table 4). Our results indicate that irrigation often weakens the significance and strength of regression of ear leaf N with plant height, which might be related to the increase of soil indigenous N supply and/or enhanced plant N uptake from soil indigenous N, and thus reducing corn responses to N fertilization under irrigation.
Notable improvement was sometimes observed in the regression of ear leaf N at R2 with plant height when the growing season progressed from V6 to V10 and to V12 in terms of R2 in 2008 and 2010 in continuous corn (Table 1). Similar improvements were consistently observed when the growing season progressed from V6 to V10 and to V12 in all three years in corn after soybean and corn after cotton (Tables 2 and 3).
Some remarkable variations in R2 for the regression of ear leaf N at R2 with plant height at V6, V10, and V12 were observed among the three years in continuous corn (Table 1). These variations may be attributable to the variances in the weather conditions among the three years. The growing season was generally normal in 2008, but it was somewhat cooler in July and August in 2009, and it was unusually hotter in June, July, and August of 2010 with extremely high rainfall in May (Figures 1 and 2). Our results suggest that abnormal weather conditions
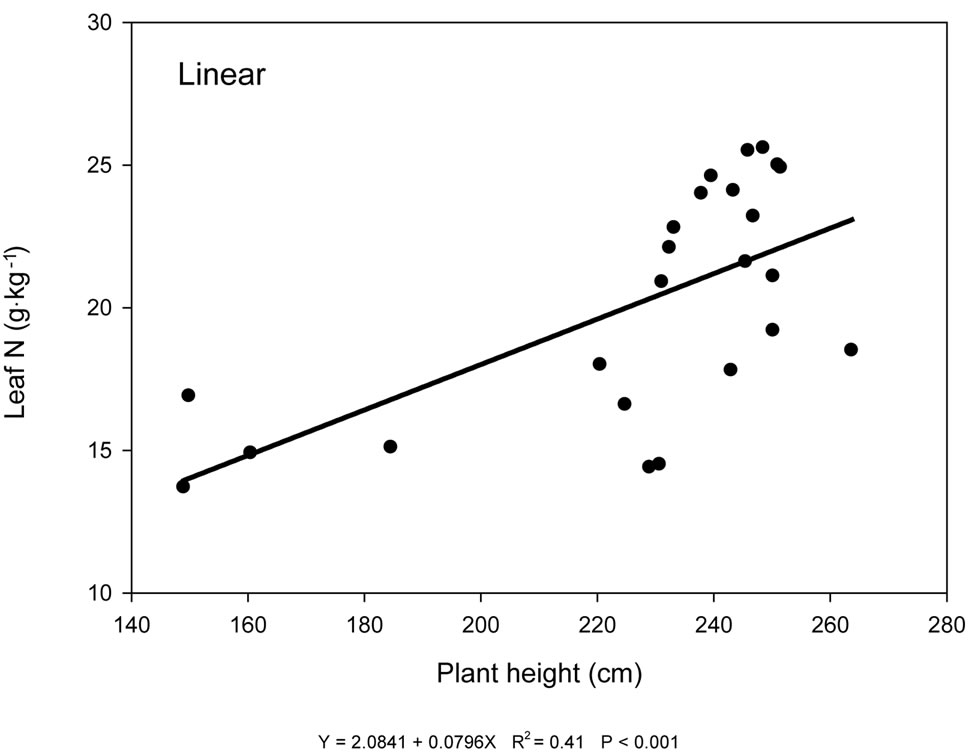
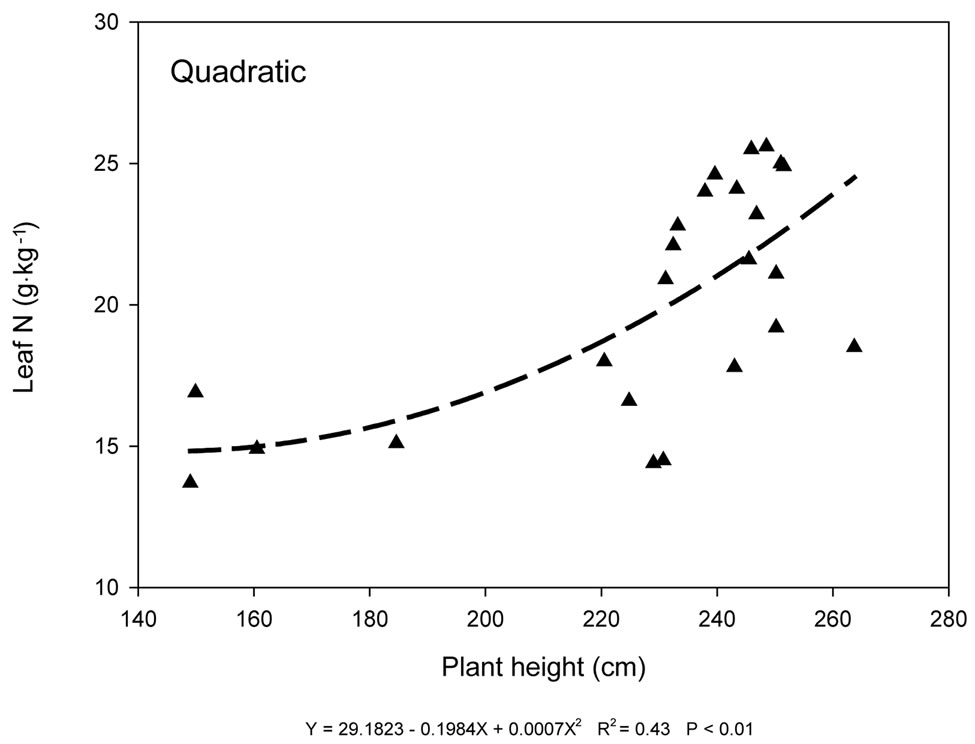
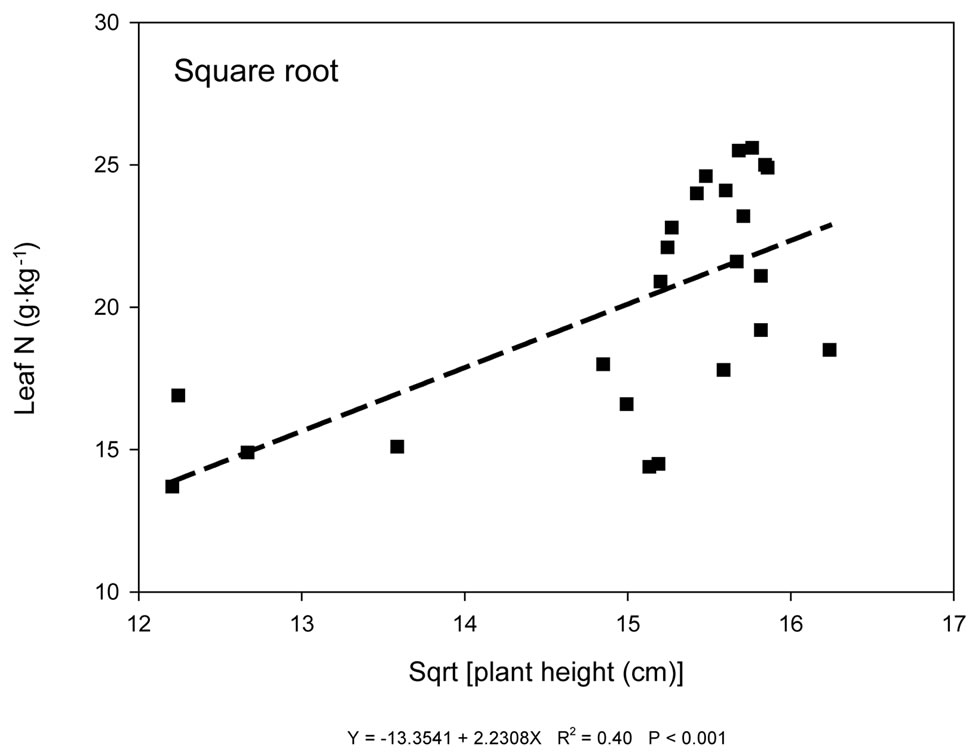
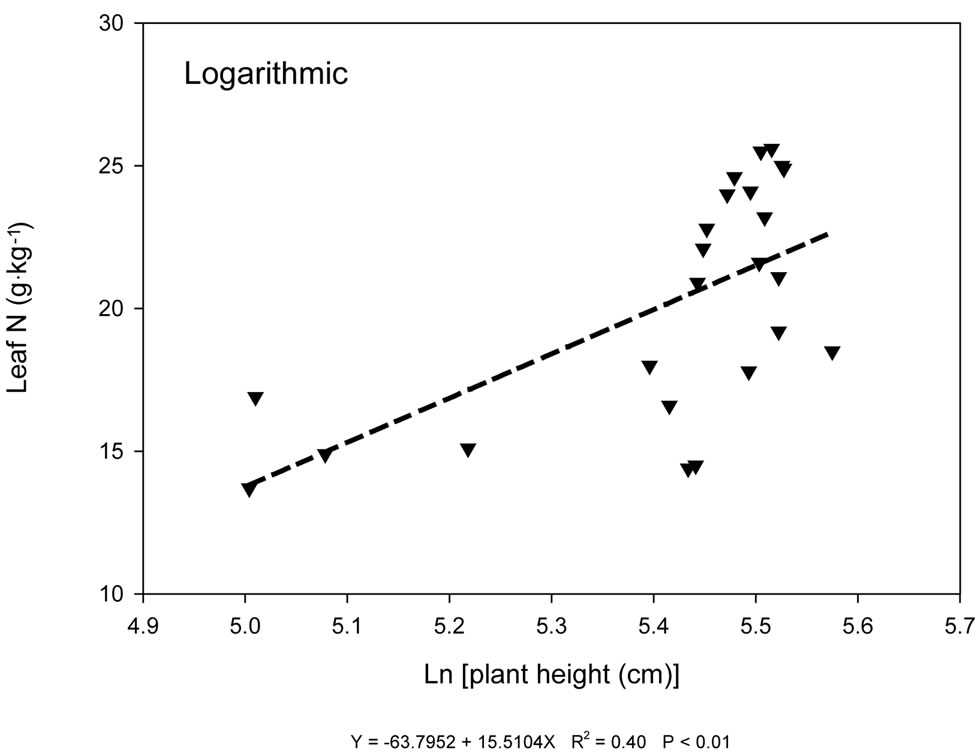
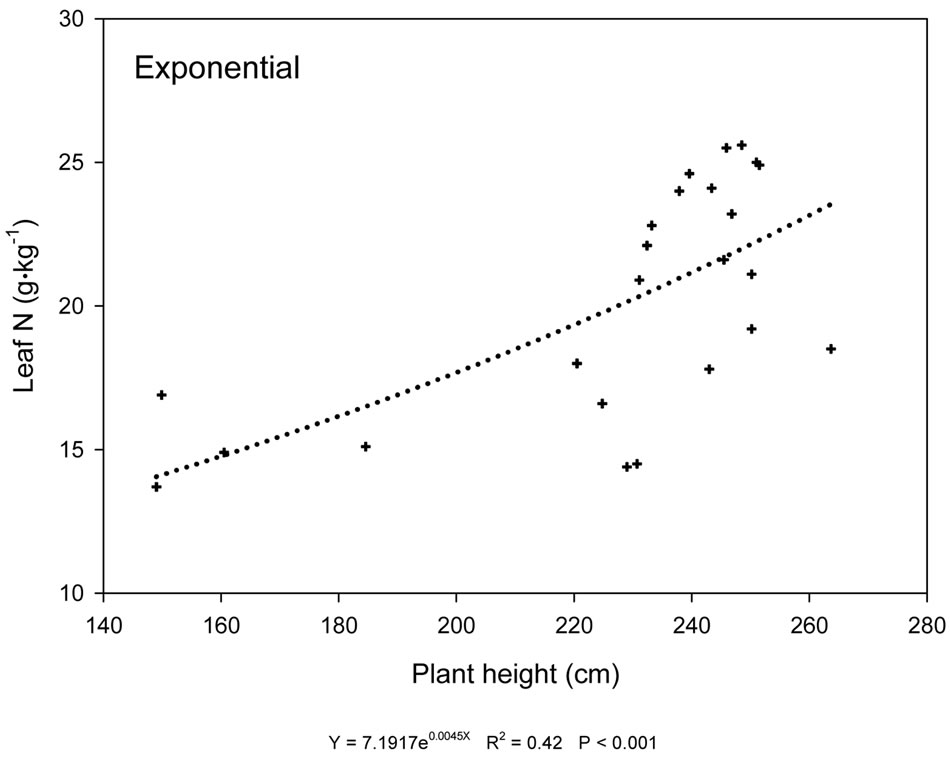
Figure 3. Relationship of ear leaf N concentration at R2 with plant height at V12 of continuous corn in 2008.
may have adverse effects on the regression of ear leaf N with plant height.
Among the four cropping systems, continuous corn usually had the lowest yields, corn after soybean and corn after cotton produced intermediate yields, and irrigated corn after soybean yielded the highest [12]. These four cropping systems are the most common corn production systems in the United States. Our results indicate that the regression of late-season ear leaf N with plant height measured during earlyto mid-season is generally stronger under non-irrigated corn than irrigated corn. Corn after soybean seemed to have the strongest regression of late-season ear leaf N with earlyto mid-season plant height out of the four cropping systems.
Overall, the R2 values for the regression of ear leaf N at R2 with plant height were below 0.50 when the plant height measurements were collected at V 6 and V10, but were sometimes above 0.50 when plant height was measured at V12 under the four cropping systems in the three years. If the R2 value of 0.50 is assumed to be the critical value to determine whether a regression is strong or not in field trials, the regression of ear leaf N at R2 with plant height was weak to moderate when plant height was measured at V6 and V10 but was sometimes strong when plant height was determined at V12.
3.3. Responses of Ear Leaf N Concentration at R2 to N Application Rates
Responses of ear leaf N at R2 to N application rates were highly significant under the four cropping systems in all three years except irrigated corn in 2008 (Table 6). Ear leaf N concentrations at R2 were mostly greater at N application rates of 185, 247, and 308 kg·ha−1 than with N rates of 0, 62, and 123 kg·ha−1 in this study.
4. DISCUSSION
In this study, ear leaf N concentration was determined at R2 in late growing season, while the plant height measurements were taken earlier in the season at V6, V10, and V12. There was a 2- to 7-week interval between these two measurements. Any factor that can influence leaf N responses to N rate treatments during this internal will affect the relationship of ear leaf N at R2 with plant height at V6, V8, and V12. This phenomenon may partially explain why the relationship of ear leaf N at R2 with plant height at V6, V10, and V12 was mostly weak to moderate. In addition, the effects of the N rate treatments which were implemented within a week after corn planting on ear leaf N at the growth stage R2 have been substantially diluted due to plant growth and development, which might have also reduced the strength in the relationship of ear leaf N at R2 with plant height at V6, V8, and V12.
Any factor that influences the responses of early leaf N and/or plant height to the N treatments may have contributed to the variations in R2 values across growth stages and years. Those factors include productivity of the tested field and weather conditions such as temperature and rainfall. In this study, each cropping system was evaluated in a different field each year, which may have affected the responses of ear leaf N and plant height to the N treatments because different fields may have different soil N fertility levels, etc. Responses of ear leaf N and plant height to the N treatments may also be influenced by the thermal accumulation and rainfall from corn planting to the dates when the ear leaf N and plant height measurements were taken.
Because each cropping system-year had only one set of ear leaf N data but two to three sets of plant height data; if ear leaf N was the major factor affecting the regression of ear leaf N with plant height, then the R2 and P values at the two to three growth stages should show a similar trend within that cropping system-year. That seemed to be the case for irrigated corn in 2008, where the regression of ear leaf N with plant height was consistently insignificant at all three growth stages except the quadratic model at V12. Response of ear leaf N to N application rates was not significant in irrigated corn in 2008 (Table 6), which may have been the dominant factor contributing to the insignificant regression of ear leaf N with plant height in irrigated corn in 2008.
Regression of late-season ear leaf N with earlyto mid-season plant height of corn was generally not as strong as the regression of leaf N with plant height when both leaf N and plant height measurements were taken simultaneously during earlyto mid-season. The R2 values for the regression of ear leaf N at R2 with plant height at V6, V10, and V12 were mostly below 0.50 regardless of cropping system and weather condition in this study. In contrast, the R2 values were mostly above 0.50 for the regression of leaf N with plant height when both leaf N and plant height were measured simultaneously at V6, V8, V10, and V12, respectively, under normal weather conditions [13].
However, the results of this study are similar to those about the relationship of leaf N with canopy NDVI in some crops. Canopy NDVI is another plant growth measurement that has been investigated in precision N management [19-21]. Eitel et al. [19] observed that flag leaf N concentration was poorly related with NDVI during late heading to early flowering in winter wheat through grid sampling based on wheat color. Kruse et al. [20] found that N concentration in plant biomass related to NDVI (R2 = 0.23 to 0.63) of creeping bentgrass grown under three N rates of 0, 12.2 and 24.4 kg·ha−1 when both biomass N and NDVI were measured simultaneously once every 30 days during the growing season. Lee et al. [21] reported that leaf N concentration was significantly related with NDVI (R2 = 0.36 to 0.47) when both were measured at the panicle formation stage for rice grown under three to five rates of N fertilizer ranging from 0 to 200 kg·ha−1.
5. CONCLUSIONS
Both R2 and P values of the linear, quadratic, square
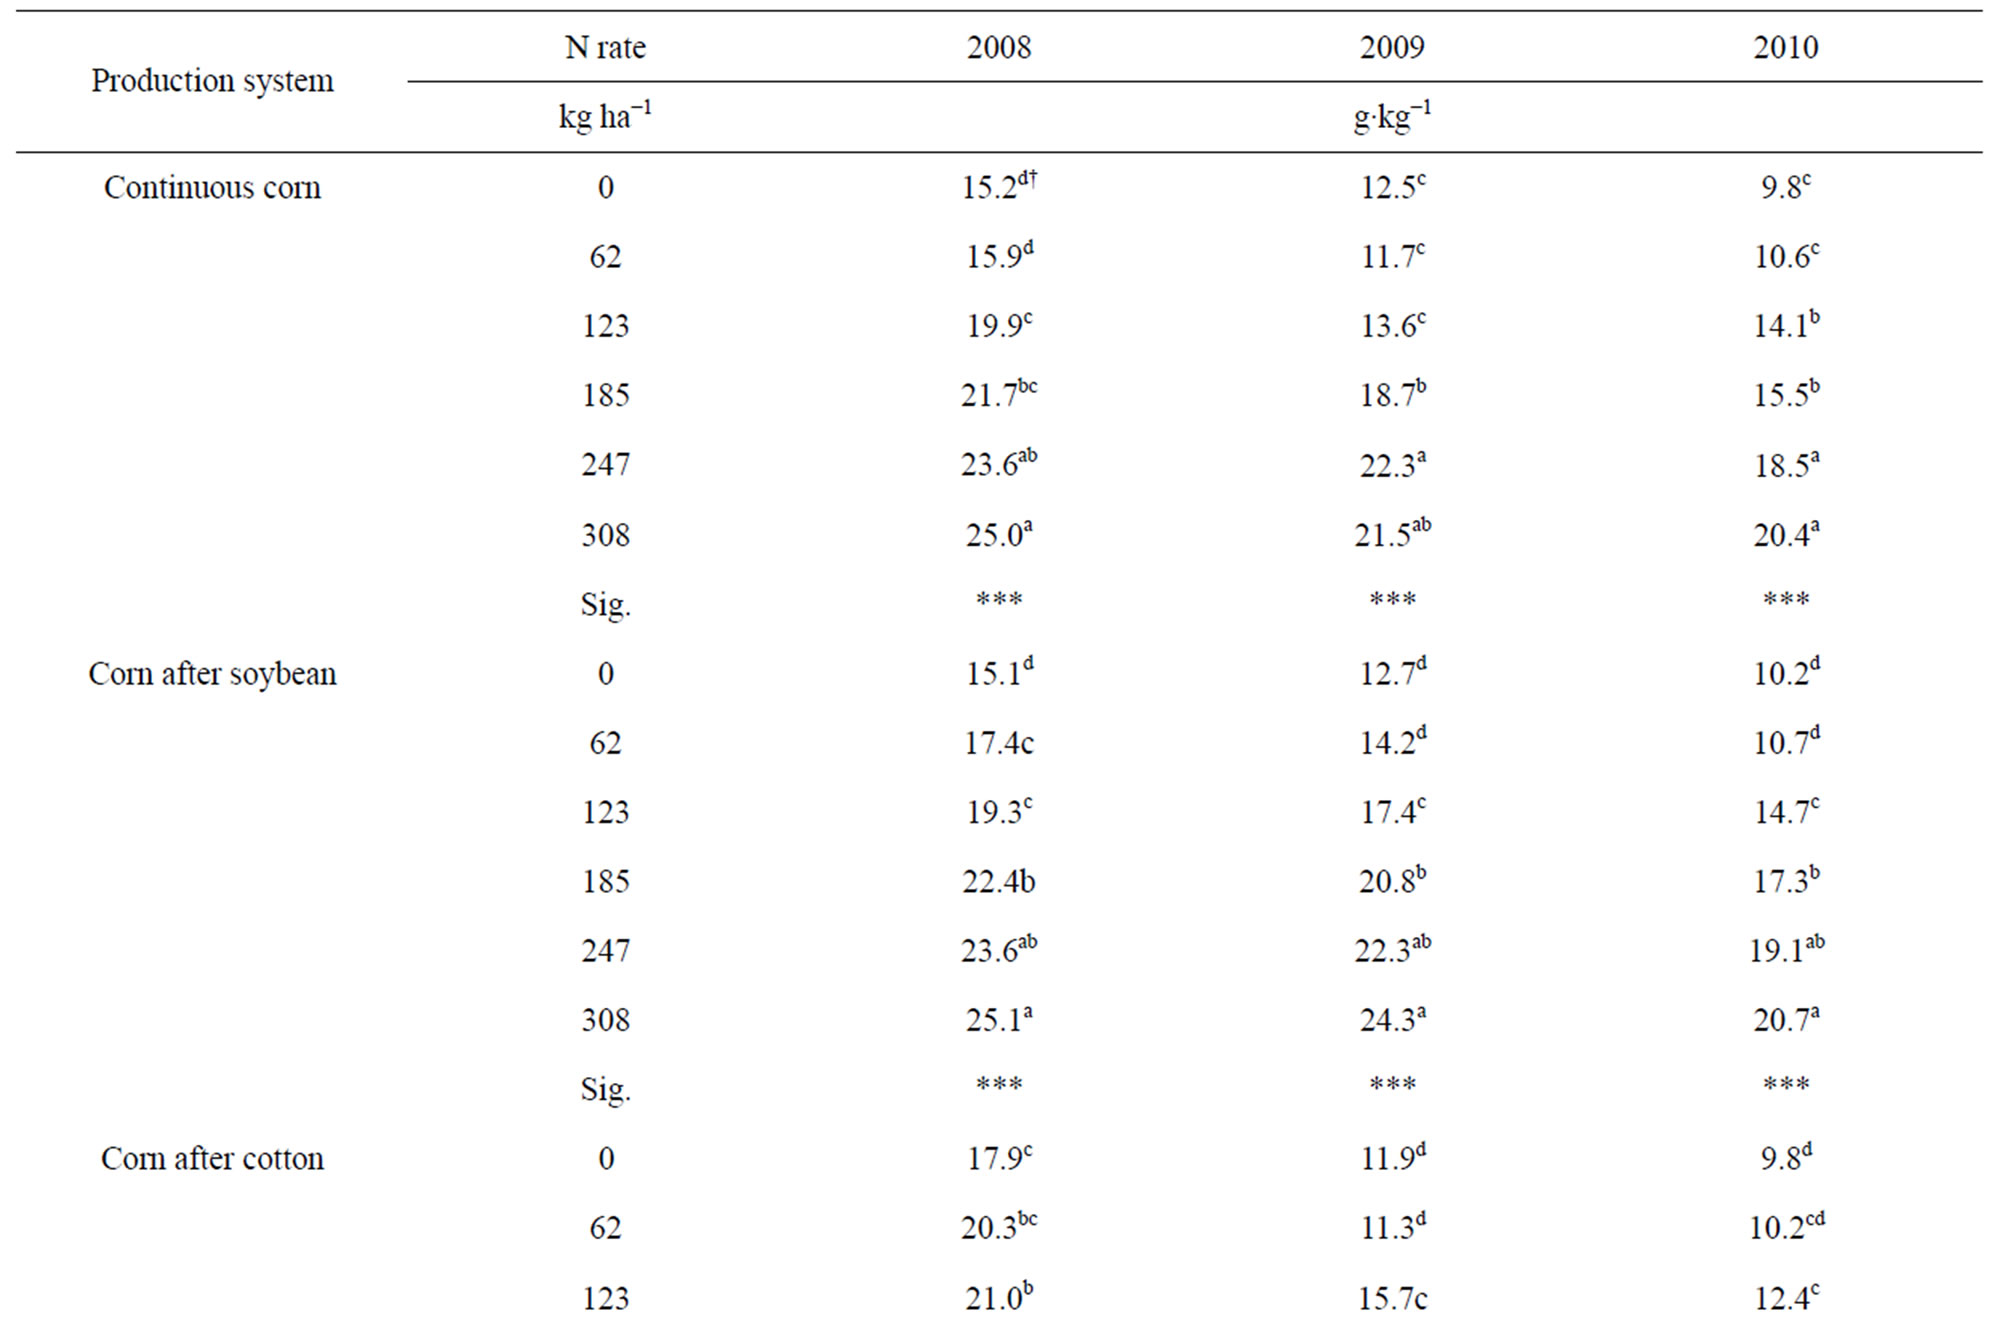
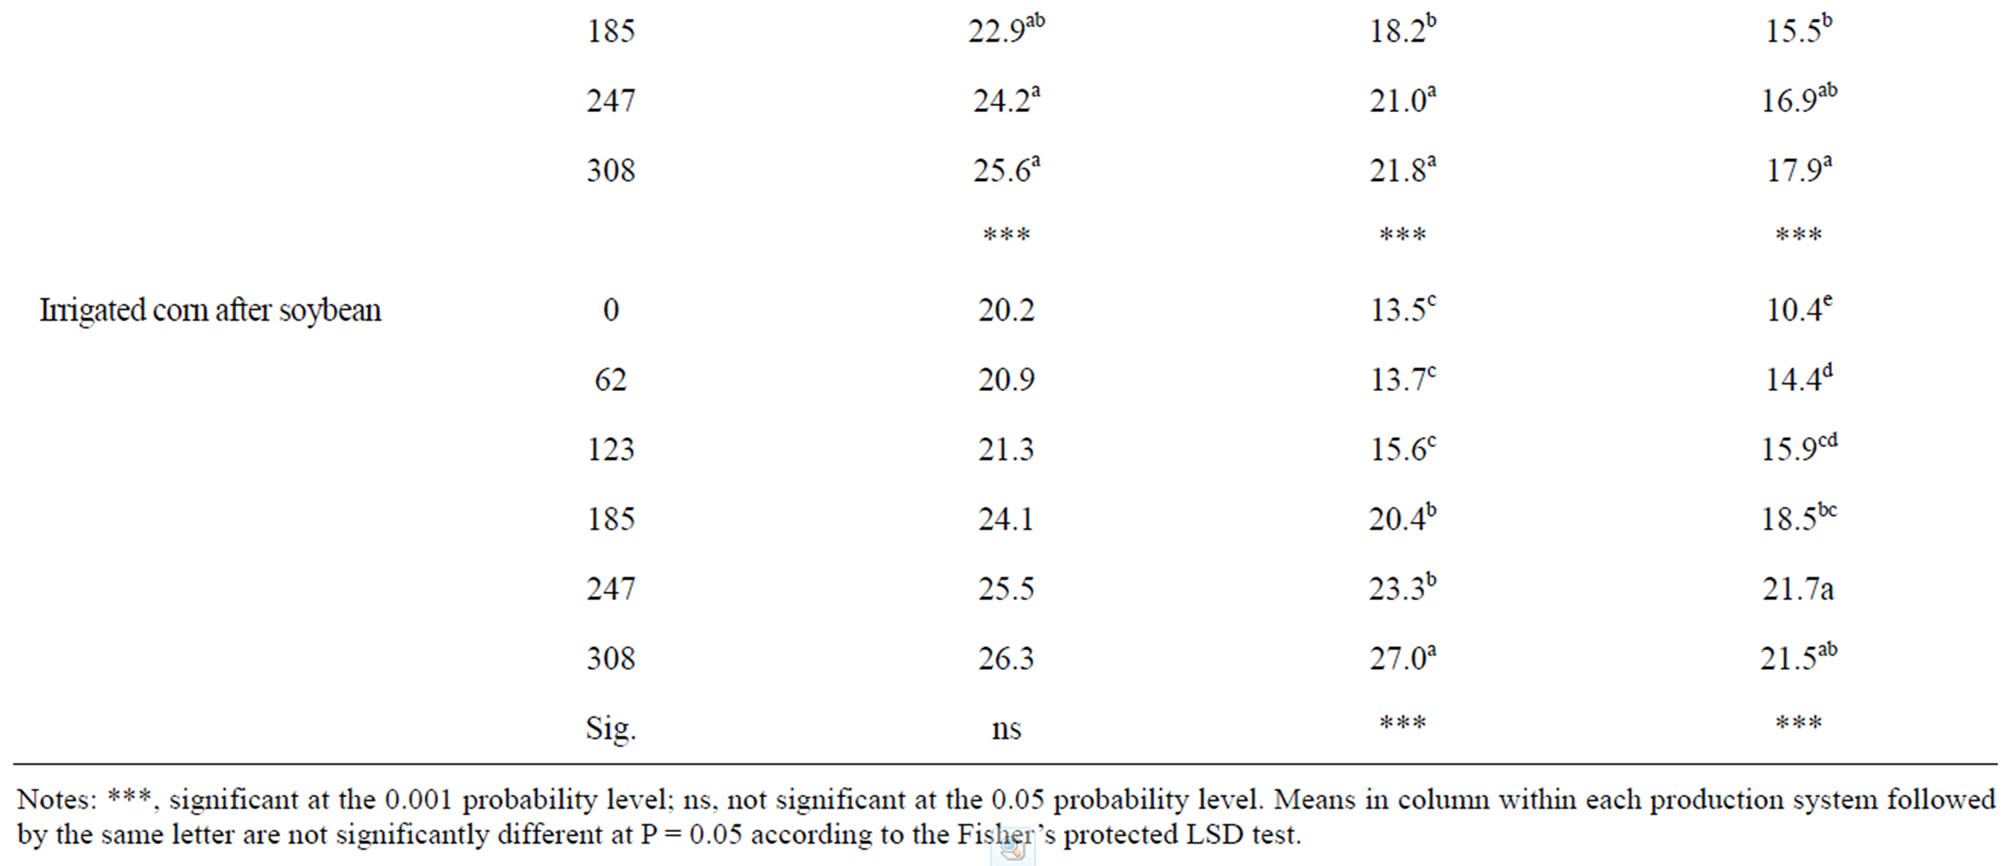
Table 6. Responses of ear leaf N concentration at R2 to N application rates in continuous corn, corn after soybean, cotton after cotton, and irrigated corn after soybean from 2008 to 2010.
root, logarithmic, and exponential models were generally similar for the regression of ear leaf N concentration at R2 with plant height measured at V6, V10 and V12 in continuous corn, corn after soybean, corn after cotton, and irrigated corn in the three years or on the averages of the three-year combined data no matter if the association of ear leaf N with plant height was weak or strong. Our results suggest that all of these models can be used to evaluate the relationship of ear leaf N determined in late season with plant height measured during earlyand midseason, but the linear model may be the preferred model because of its simplicity.
Ear leaf N concentration at R2 was significantly and positively related with plant height at V6, V10, and V12 in continuous corn, corn after soybean, and corn after cotton under normal weather conditions. However, the strength of this relationship was mostly weak to moderate with the R2 values ranging from 0.21 to 0.51. This relationship was generally improved as the growing season progressed from V6 to V10 and to V12. Irrigation and abnormal weather conditions seemed to have adverse effects on this relationship. Generally, the relationship of late-season ear leaf N with earlyto mid-season plant height was not as strong as the association of corn yield at harvest with plant height during earlyto mid-season or the relationships of plant biomass and leaf N with plant height when they were measured simultaneously during earlyto mid-season [12,13]. Our results suggest that unlike the relationship of corn yield at harvest with plant height measured during earlyto mid-season or the relationship of leaf N with plant height when both are measured simultaneously during earlyto mid-season, the relationship of late-season ear leaf N with earlyto mid-season plant height may not be strong enough to be used to develop algorithms for variable-rate N applications on corn within a field no matter which regression model is used to describe this relationship.
REFERENCES
- Biermacher, J.T., Epplin, F.M., Brorsen, B.W., Solie, J.B. and Raun, W.R. (2006) Maximum benefit of a precise nitrogen application system for wheat. Precision Agriculture, 7, 1-12. doi:10.1007/s11119-006-9017-6
- Ortiz-Monasterio, J.I. and Raun, W.R. (2007) Reduced nitrogen and improved farm income for irrigated spring wheat in the Yaqui Valley, Mexico, using sensor based nitrogen management. Journal of Agricultural Science, 145, 1-8. doi:10.1017/S0021859607006995
- Raun, W.R. and Johnson, G.V. (1999) Improving nitrogen use efficiency for cereal production. Agronomy Journal, 91, 357-363. doi:10.2134/agronj1999.00021962009100030001x
- Raun, W.R., Solie, J.B., Johnson, G.V., Stone, M.L., Mullen, R.W., Freeman, K.W., Thomason, W.E. and Lukina, E.V. (2002) Improving nitrogen use efficiency in cereal grain production with optical sensing and variable rate application. Agronomy Journal, 94, 815-820. doi:10.2134/agronj2002.0815
- Teal, R.K., Tubana, B., Girma, K., Freeman, K.W., Arnall, D.B., Walsh, O. and Raun, W.R. (2006) In-season prediction of corn grain yield potential using normalized difference vegetation index. Agronomy Journal, 98, 1488- 1494. doi:10.2134/agronj2006.0103
- Tubana, B.S., Arnall, D.B., Walsh, O., Chung, B., Solie, J.B., Girma, K. and Raun, W.R. (2008) Adjusting midseason nitrogen rate using a sensor-based optimization algorithm to increase use efficiency in corn. Journal of Plant Nutrition, 31, 1393-1419. doi:10.1080/01904160802208261
- Shrestha, D.S., Steward, B.L., Birrell, S.J. and Kaspar, T.C. (2002) Plant height estimation using two sensing systems. ASAE Annual International Meeting, St. Joseph. doi:10.2134/agronj2001.931131x
- Raun, W.R., Johnson, G.V., Stone, M.L., Solie, J.B., Lukina, E.V. and Thomason, W.E. (2001) In-season prediction of potential grain yield in winter wheat using canopy reflectance. Agronomy Journal, 93, 131-178.
- Katsvairo T.W., Cox, W.J. and Van Es. H.M. (2003) Spatial growth and nitrogen uptake variability of corn at two nitrogen levels. Agronomy Journal, 95, 1000-1011. doi:10.2134/agronj2003.1000
- Machado, S., Bynum, E.D., Jr., Archer, T.L., Lascano, R.J., Wilson, L.T., Bordovsky, J., Segarra, E., Bronson, K., Nesmith, D.M. and Xu, W. (2002) Spatial and temporal variability of corn growth and grain yield: Implications for site-specific farming. Crop Science, 42, 1564- 1576. doi:10.2135/cropsci2002.1564
- Sadler, E.J., Bauer, P.J. and Busscher, W.J. (2000) Sitespecific analysis of a droughted corn crop: I. Growth and grain yield. Agronomy Journal, 92, 395-402. doi:10.2134/agronj2000.923395x
- Yin, X., McClure, M.A., Jaja, N., Tyler, D.D. and Hayes, R.M. (2011) In-season prediction of corn yield using plant height under major corn production systems. Agronomy Journal, 103, 923-929. doi:10.2134/agronj2010.0450
- Yin, X., Hayes, R.M., McClure, M.A. and Savoy, H.J. (2012) Assessment of plant bio-mass and nitrogen nutrition with plant height in earlyto mid-season corn. Journal of the Science of Food and Agriculture, (in press).
- Savoy, H.J. and Joines, D. (2010) Lime and fertilizer recommendations for the various crops of Tennessee. Chapter II. Agronomic crops, Accessed 14 October, 2010. http://soilplantandpest.utk.edu/pdffiles/soiltestandfertrecom/chap2-agronomic_mar2009.pdf
- Leib, B.G. (2011) Management of irrigation systems in Tennessee (MOIST) spreadsheet, Accessed 20 March, 2011. http://bioengr.ag.utk.edu/weather/
- Watson, M.E. and Brown, J.R. (1998) pH and lime requirement, In: Brown, J.R., Ed, Recommended Chemical Soil Test Procedures for the North Central Region, NCR Research Publication No. 221. University of Missouri, Columbia.
- Sims, J.T. (1989) Comparison of Mehlich 1 and Mehlich 3 extractants for P, K, Ca, Mg, Mn, Cu and Zn in Atlantic coastal plain soils. Communications in Soil Science and Plant Analysis, 20, 1707-1726. doi:10.1080/00103628909368178
- Gavlak R.G., Horneck, D.A. and Miller, R.O. (1994) Plant, soil and water reference methods for the western region, University of Alaska, Fairbanks.
- Eitel, J.U.H., Long, D.S., Gessler, P.E. and Hunt, E.R. (2008) Combined spectral index to improve ground-based estimates of Nitrogen status in dryland wheat. Agronomy Journal, 100, 1694-1702. doi:10.2134/agronj2007.0362
- Kruse, J.K., Christians, N.E. and Chaplin, M.H. (2006) Remote sensing of nitrogen stress in creeping bentgrass. Agronomy Journal, 98, 1640-1645. doi:10.2134/agronj2006.0022
- Lee, Y.J., Yang, C.M., Chang, K.W. and Shen, Y. (2008) A simple spectral index using reflectance of 735 nm to assess nitrogen status of rice canopy. Agronomy Journal, 100, 205-212. doi:10.2134/agrojnl2007.0018
ABBREVIATIONS
NDVI, normalized difference vegetation index;
R2, blister growth stage;
V6, 6-leaf growth stage;
V10, 10-leaf growth stage;
V12, 12-leaf growth stage.