Food and Nutrition Sciences
Vol. 3 No. 1 (2012) , Article ID: 17090 , 6 pages DOI:10.4236/fns.2012.31019
Determination of Essential (Ca, Fe, I, K, Mo) and Toxic Elements (Hg, Pb) in Brazilian Rice Grains and Estimation of Reference Daily Intake
![]()
Department of Clinical, Toxicological and Bromatological Analyses, Faculty of Pharmaceutical Sciences of Ribeirão Preto, University of São Paulo, Ribeirão Preto, Brazil.
Email: *fbarbosa@fcfrp.usp.br
Received September 22nd, 2011; revised November 3rd, 2011; accepted November 12th, 2011
Keywords: Rice; Trace Metals; ICP-MS; Daily Intake
ABSTRACT
The levels of Hg and Pb (toxic elements) and Ca, Fe, I, K, Mo (essential elements) were measured in 44 Brazilian rice samples divided among white polished (W), parboiled white (PW) and parboiled brown (PB). Rice grains were analyzed by inductively coupled plasma mass spectrometry (ICP-MS). Concentrations of toxic elements varied from 0.3 to 13.4 and 0.4 to 14.5 ng·g–1 for Hg and Pb, respectively. The values for essential elements were in the same range of those for rice produced in other countries. In general parboiled samples presented higher levels of all elements in study compared to white samples. The Estimated Daily Intake through rice consumption was 0.44 µg for Pb, 0.22 µg for Hg, 0.65 µg for I, 39.5 µg for Mo, 0.43 mg for Fe, 4.1 mg for Ca and 88.9 mg for K. Our findings demonstrated that rice can contribute significantly to the RDIs of molybdenum and potassium, but it can not be considered an important source of I, Fe and Ca. Moreover, the estimated daily intake of lead and mercury through rice consumption is much lower than the Provisional Tolerable Daily Intake.
1. Introduction
Rice (Oryza sativa L.) is an important component of the world population’s basic diet and it is considered one of the most important sources of nutrients for millions of people around the world. Unfortunately, populations of many of the main rice consuming countries suffer from nutrient-deficiency-related diseases, with an insufficient intake of important essential elements in their diet. Moreover, in some cases, diet is also an important source of toxic elements [1,2].
Brazil is the most important non-Asian producer of rice and the consumption per person is around 86 g/day (31.3 Kg/year) [3]. Then, measuring the concentration of toxic and essential elements in rice is thus of enormous importance. Moreover, nutritional tables widely used to calculate food nutrient intakes do not reflect the Brazilian reality, since mineral contents largely depend on the availability of soil nutrients, agricultural practices and processing conditions.
Therefore, the present study aims: 1) to investigate the mineral composition of three different types of Brazilian rice samples (White, Parboiled White and Parboiled Brown) by using inductively coupled plasma mass spectrometry (ICP-MS); and 2) to estimate population’s daily intake through rice consumption of toxic and essential elements.
2. Materials and Methods
2.1. Rice Sampling and Treatment
Forty-four raw rice grains samples, 9 parboiled brown (PB), 23 white (W) and 12 parboiled white (PW) were purchased at supermarkets in different regions of the country during the year of 2010. These 44 samples represent the most important brands sold in the whole country. For each brand, one sample was randomly selected.
Before digestion of grains, 15 g were separated by quartering as described by CAC [4] and divided into three plastic tubes. The contents of each tube were ground for 3 minutes in a ball mill (TECNAL TE 350, Brazil) and sifted in a 106 µm sieve (BERTEL, Brazil). Then, samples were digested in closed vessels using a microwave oven decomposition system (MILESTONE ETHOS D, Italy) according to the method proposed by Nardi et al. [5]. Briefly, rice samples (250 mg) were accurately weighed in a PFA digestion vessel and then 5 mL of nitric acid 20% v/v + 2 mL of 30% (v/v) H2O2 were added. The vessel was placed inside the microwave oven and decomposition was carried out according to the following program: (a). 160˚C (power of 1000 W) for 4.5 minutes; (b). 160˚C (power of 0 W) for 0.5 minutes; (c). 230˚C (power of 1000 W) for 20 minutes and (d). 0˚C (power of 0 W) for 20 minutes. After that, the solutions were left to cool and the volume was made up to 50 mL with Milli-Q water. Rhodium was then added as an internal standard to a final concentration of 10 μg·L–1.
2.2. Apparatus
All measurements were conducted using an ICP-MS (Elan DRC II PerkinElmer, Norwalk, CT) with high-purity argon (99.999%, White Martins, Brazil), which used a Meinhard concentric nebulizer (Spectron/Glass Expansion, Ventura, CA) connected to a cyclonic spray chamber. A radiofrequency (rf) of 1200 W power was selected in pulse mode with autolens one. Sample data were acquired by using 20 sweeps/reading, 1 reading/replicate, and a dwell time of 50 ms. Argon nebulizer gas flow rate was optimized daily from 0.5 to 0.9 L/min. Data were acquired in counts per second (cps). The following isotopes were selected: 44Ca, 57Fe, 202Hg, 129I, 39K, 98Mo and 208Pb.
2.3. Reagents
High purity de-ionized water (resistivity 18.2 MΩ cm) used in sample and solution preparation was obtained using a Milli-Q water purification system (Millipore RiOs-DITM, Bedford, MA, USA). All reagents used were of analytical-reagent grade, except for nitric acid (HNO3), which had been previously purified in a quartz sub-boiling still (Kürner Analysentechnik) before use. A clean laboratory and laminar-flow hood capable of producing class 100 were used for preparing solutions. Rhodium (1000 mg·L–1) and multi-element (10 mg·L–1) solution were obtained from PerkinElmer (Shelton, CT, USA). Plastic bottles, vessels and conic tubes (Sarstedt, Germany) were cleaned by soaking in 15% (v/v) HNO3 for 24 h, rinsed five times with Milli-Q water and dried in a class-100 laminar flow hood before use. All operations were performed in a class-1000 clean room.
2.4. Quality Control of Data
In order to verify the accuracy and precision of the proposed method, two Standard Reference Materials from the National Institute of Standards and Technology (NIST). RM 8415 Whole Egg Powder and SRM 1568a Rice Flour, were digested and analyzed. Results are shown in Table 1. Values found are in good agreement with target values.
The method detection limits (LODs) obtained for Ca, Fe, K, Hg, I, Mo and Pb were 373, 13, 50, 0.1, 1.2, 1.1 and 0.1 ng·g–1, respectively. The LODs were determined as 3 SD of the 20 consecutive measurements of the reagent blanks multiplied by the dilution factor used for sample preparation (250 mg of sample/50 mL).
2.5. Daily Intake Estimation
Daily metal intake depends on both metal concentration in food and daily food consumption. Estimated daily intake was calculated as:

where EDI is the estimated daily intake of chemical elements (µg·day–1·person–1 or mg·day–1·person–1), Cce is the
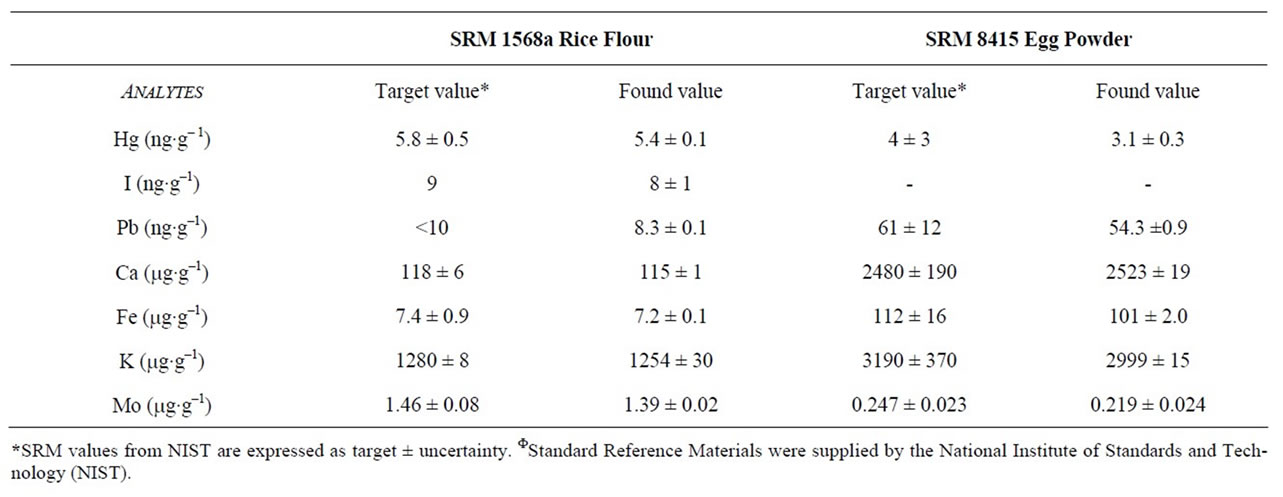
Table 1. Results for NISTF Standard Reference Material SRM 1568a rice flour and SRM 8415 whole egg powder for determination of trace elements (values found are expressed as mean ± SD, n = 5).
chemical element concentration in rice (white rice) and Mrdc is the mass of rice consumed daily in Brazil, based on IBGE rice consumption statistics which show polished rice consumption in the different Brazilian regions [3].
Estimated daily intake was compared to the Provisional Tolerable Daily Intake (PTDI) for toxic elements (JECFA/WHO guidelines) [6]. PTDI was considered PTWI (Provisional Tolerable Weekly Intake) divided by 7 and the Dietary Reference Intakes (DRIs) for essential elements established by the Food and Nutrition Board of the Institute of Medicine, 1997-2001 [7].
2.6. Statistical Analysis
All the experiments were conducted in triplicate. To evaluate statistical differences in the elemental concentrations between rice types, the one-way ANOVA test was used. The SPSS statistical package version 15.0 was used for calculations (SPSS, version 15.0, Inc., Chicago, IL). Statistical significance was set at 5%.
3. Results and Discussion
The levels of Hg and Pb (toxic elements) and Ca, Fe, I, K, Mo (essential elements) were measured in 44 rice samples divided among white polished (W), parboiled white (PW) and parboiled brown (PB). Values are shown in Table 2.
3.1. Toxic Elements in Rice Samples
Several experimental and epidemiological studies have demonstrated that exposure to mercury is associated with neurotoxic effects and motor function impairment [8], the cardiovascular system [9] and genetic damage [10]. Moreover, Hg, is classified in Group 2B (possibly carcinogenic to humans) by the International Agency for Research on Cancer (IARC). Human exposure to mercury from diet occurs primarily through the consumption of fish rich in methylmercury. However, some recent studies are identifying rice as a potential source of Hg exposure in some regions [11].
Mercury levels in Brazilian rice samples varied from 0.3 to 13.4 ng·g–1. PB rice presented the highest mean levels (3.9 ng·g–1) against 3.5 ng·g–1 in PW rice. The mean values for W rice were considerably lower (2.3 ng g–1), as shown in Table 2. Zhang et al. [11] found an average of 78 ng·g–1 in rice samples collected in Wanshan, China and Fu et al. [12] reported a mean of 28.8 ng·g–1 in rice samples collected in other areas of China.
Lead is a very toxic element and the chronic exposure, even at low levels, is associated to several health effects [13].
In this study, the levels of lead in rice samples varied from 0.4 to 14.5 ng·g–1. PB rice presented the highest mean levels of lead (7.8 ng·g–1) followed by W rice (5.3 ng·g–1) and PW rice (3.1 ng·g–1) as shown in Table 2. These values are much lower to the values observed for rice samples cultivated in other areas of the world [14] as shown in Table 3.
3.2. Evaluation of Essential Elements in Rice Samples
Essential elements are those that are required by an organism to maintain its normal physiological function.
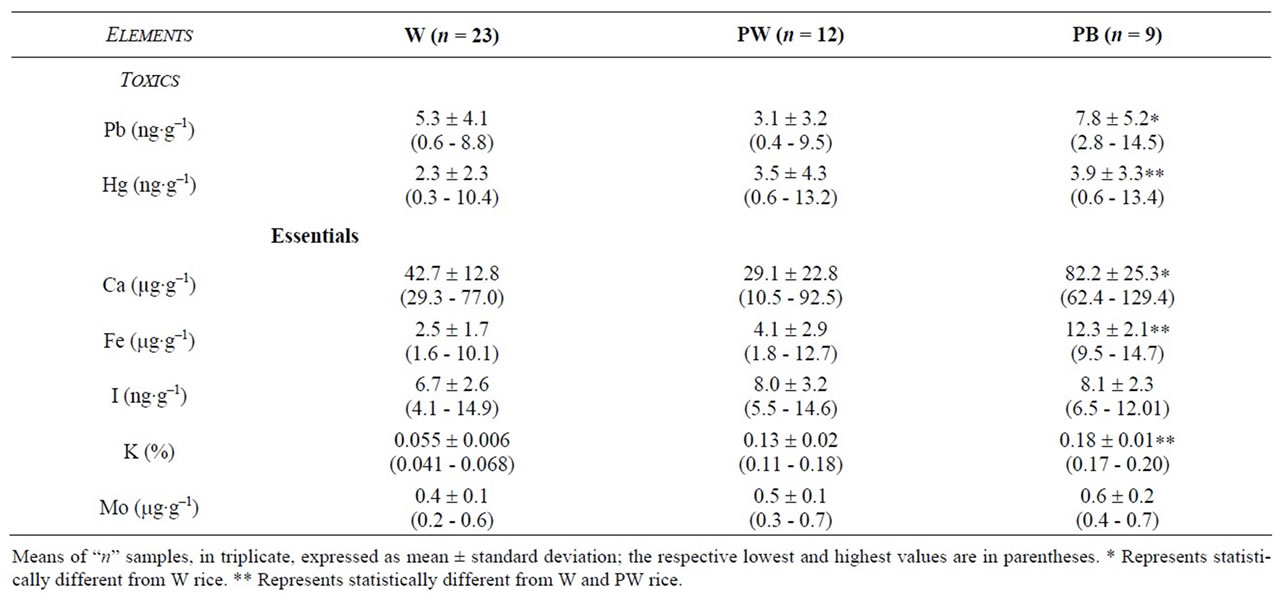
Table 2. Determination of essential, toxic and other elements in different types of Brazilian raw rice samples.

Table 3. Comparison of toxic elements composition in raw rice samples cultivated in different regions.
This definition of essential elements is based mainly on the observation that inadequate intake causes impairment of human health which can be reversed by administering the element. Many of these elements are parts of protein complexes (e.g. metalloproteins), which are required for enzymatic activities and can play structural roles in connective tissue or cell membranes. In the present study we have evaluated the essential elements Ca, Fe, I, K, Mo.
Calcium levels in the Brazilian rice samples varied from 10.5 to 129.4 µg·g–1. Despite the non-statistical significance (Table 2), PB rice presented the highest mean levels (82.2 µg·g–1), followed by PW rice (mean of 29.1 µg·g–1). The mean value for white rice was a little higher than that found for PW rice (42.7 µg·g–1) as shown in Table 2. The values found in the present study are quite close to those observed for rice samples cultivated in other areas of the world (Table 3).
Iron levels in rice samples analyzed in the present study varied from 1.6 to 14.7 µg·g–1. PB rice presented the highest mean levels (12.3 µg·g–1), followed by PW rice (mean of 4.1 µg·g–1). The mean value for white rice was almost the half found for PW rice (2.5 µg·g–1) as shown in Table 2. The values found in the present study are quite close to those observed for rice samples cultivated in other areas of the world (Table 3) and also in agreement with Heinemann et al. [18] study with commercial brown, parboiled and milled rice from Brazil.
As can be observed rice is not an important source for iron compared to beans and meats for instance. Moreover, the amount absorbed for the total ingested is lower than 1% [19].
The healthy human adult body contains 15 to 20 mg of iodine, of which about 70% to 80% is in the thyroid gland [20]. The amount of iodine in the gland is closely related to the iodine intake. The intake requirement is 100 - 150 µg per day. However, there is a lack of studies of iodine levels in rice samples around the world.
Iodine levels in rice samples analyzed in the present study varied from 4.1 to 14.9 ng·g–1. There was no big difference between the types of rice samples analyzed. PB and PW rice presented the highest mean levels, 8.1 and 8.0 ng·g–1, respectively, followed by W rice (mean of 6.7 ng·g–1).
Potassium is essential for maintaining proper fluid balance, nerve impulse function, muscle function, cardiac (heart muscle) function. This element was found in moderate to high levels in rice. PB samples presented higher levels of K compared to other types of rice analyzed, mean of 0.18% for Pb and 0.055% for W rice as shown in Table 2.
Molybdenum functions as an enzyme cofactor [21]. Molybdenum-enzymes catalyze the hydroxylation of various substrates. Molybdate might also be involved in stabilizing the steroid-binding ability of unoccupied steroid receptors [21].
We found that molybdenum levels in the Brazilian rice samples varied from 0.2 to 0.7 μg·g–1. However, there is no significant differences between the types of rice samples as can be observed by Table 2. The values found in the present study are quite close to the values observed for rice samples cultivated in other areas, as shown in Table 4.
3.3. Estimation of the Daily Intake of Toxic and Essential Elements from Rice Consumption
White rice is the predominant type of rice consumed in Brazil. Thus, for the estimation of daily intake of chemical elements through rice consumption, we have used the mean levels of the chemical elements obtained for the white rice samples analyzed in this study. Since Brazilian rice consumption is approximately 86 g/day/inhabitant [3] the estimated daily intake through rice consumption was 0.44 µg for Pb, 0.22 µg for Hg, 0.65 µg for I, 39.5 µg for Mo, 0.43 mg for Fe, 4.1 mg for Ca, 88.9 mg for K (Table 5). These values represent a considerable percentage of the DRI for many essential elements, as can be seen by Table 5.
4. Conclusions
Rice is an important food commodity and a dominant staple food in Brazil. In general, PB rice samples presented higher levels of elements compared to W or PW rice samples. The higher retention of micronutrients in parboiled rice has been attributed to their solubilization and migration to the centre of the grain and their setting during the starch gelatinization process.
We have also observed that rice can contribute signifycantly to the RDIs of molybdenum and potassium, but it can not be considered an important source of I, Fe and
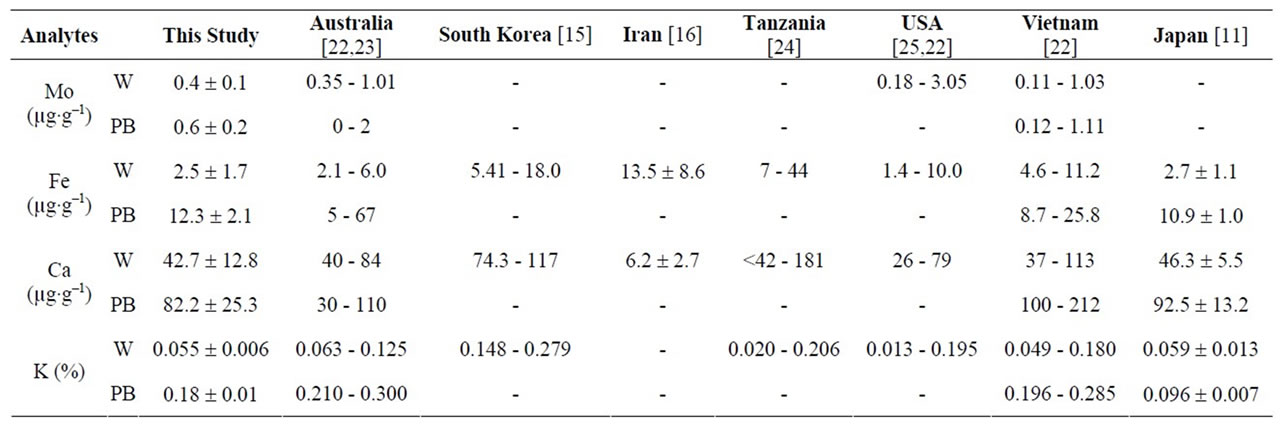
Table 4. Comparison of essential elements composition in raw rice grains samples cultivated in different regions.

Table 5. Estimated daily intake of chemical elements and potential health risk due to rice (B, PB, W) consumption for Brazilians of different regions, based on the POF/IBGE-Brazil government.
Ca. Moreover, the estimated daily intake of lead and mercury through rice consumption is much lower than the Provisional Tolerable Daily Intake.
5. Acknowledgements
Authors are grateful to Fundação de Amparo à Pesquisa do Estado de São Paulo (FAPESP) and Conselho Nacional de Desenvolvimento Científico e Tecnológico (CNPq) for financial support and fellowships.
REFERENCES
- F. Barbosa, M. Fillion, M. Lemire, C. J. S. Passos, J. L Rodrigues, A. Philibet, J.-R. Guimarães and D. Mergler, “Elevated Blood Lead Levels in a Riverside Population in the Brazil Amazon,” Environmental Research, Vol. 109, No. 5, 2009, pp. 594-599. doi:10.1016/j.envres.2009.03.005
- D. Grotto, J. Valentini, C. J. S. Passos, M. Fillion, S. C. Garcia, D. Mergler and F. Barbosa, “Mercury Exposure and Oxidative Stress in Communities of the Brazilian Amazon,” Science of the Total Environment, Vol. 408, No. 4, 2010, pp. 806-811. doi:10.1016/j.scitotenv.2009.10.053
- IBGE, Instituto Brasileiro de Geografia e Estatística, “Aquisição Alimentar Domiciliar per Capita Anual, por Grandes Regiões, Segundo os Produtos, Período 2002-2003,” Brasilia, 2003.
- CAC, Codex Alimentarius Commission, “General Guidelines on Sampling CAC-GL-50,” 2004, pp. 1-69.
- E. P. Nardi, F. S. B. Evangelista, L. Tormen, T. D. Saint’ Pierre, A. J. Curtius, S. S. Souza and F. Barbosa, “The Use of Inductively Coupled Plasma Mass Spectrometry (ICP-MS) for the Determination of Toxic and Essential Elements in Different Types of Food Samples,” Food Chemistry, Vol. 112, No. 3, 2009, pp. 727-732. doi:10.1016/j.foodchem.2008.06.010
- FAO/WHO, “Summary and Conclusions of the SixtySeventh Meeting of the Joint FAO/WHO Expert Committee on Food Additives (JECFA),” JECFA, Rome, 20-29 June 2006, 67/SC.
- Institute of Medicine, “Dietary Reference Intakes for Vitamin A, Vitamin K, Arsenic, Boron, Chromium, Coper, Iodine, Manganese, Molybdenum, Nickel, Silicon, Vanadium and Zinc,” National Academy Press, Washington DC, 2002, p. 773.
- R. de P. Martins, H. de C. Braga, A. P. da Silva, J. B. Dalmarco, A. F. de Bem, A. R. dos Santos, A. L. Dafre, M. G. Pizzolatti, A. Latini, M. Aschner and M. Farina, “Synergistic Neurotoxicity Induced by Methylmercury and Quercetin in Mice,” Food and Chemical Toxicology, Vol. 47, No. 3, 2009, pp. 645-649. doi:10.1016/j.fct.2008.12.020
- K. J. Virtanen, T. H. Rissanen, S. Voutilainen and T. P. Tuomainen, “Mercury as a Risk Factor for Cardiovascular Diseases,” Journal of Nutritional Biochemistry, Vol. 18, No. 2, 2007, pp. 75-85. doi:10.1016/j.jnutbio.2006.05.001
- D. Grotto, G. R. Barcelos, J. Valentini, L. M. Antunes, J. P. Angeli, S. C. Garcia and F. Barbosa, “Low Levels of Methylmercury Induce DNA Damage in Rats: Protective Effects of Selenium,” Archives of Toxicology, Vol. 83, No. 3, 2009, pp. 249-254. doi:10.1007/s00204-008-0353-3
- Z.-W. Zhang, C.-S. Moon, T. Watanabe, S. Shimbo and M. Ikeda, “Contents of Pollutant and Nutrient Elements in Rice and Wheat Grown on the Neighboring Fields,” Biological Trace Element Research, Vol. 57, No. 1, 1997, pp. 39-50. doi:10.1007/BF02803868
- J. Fu, Q. Zhou, J. Liu, W. Liu, T. Wang, Q. Zhang and G. Jiang, “High Levels of Heavy Metals in Rice (Oryza sativa L.) from a Typical E-Waste Recycling Area in Southeast China and Its Potential Risk to Human Health,” Chemosphere, Vol. 71, No. 7, 2008, pp. 1269-1275. doi:10.1016/j.chemosphere.2007.11.065
- M. T. Mansouri and O. Cauli, “Motor Alterations Induced by Chronic Lead Exposure,” Environmental Toxicology and Pharmacology, Vol. 27, No. 3, 2009, pp. 307-313. doi:10.1016/j.etap.2009.01.003
- L. Jorhem, C. Astrand, B. Sundström, M. Baxter, P. Stokes, J. Lewis and K. P. Grawé, “Elements in Rice from the Swedish Market: 1. Cadmium, Lead and Arsenic (Total and Inorganic),” Food Additives and Contaminants, Vol. 25, No. 3, 2008, pp. 284-292. doi:10.1080/02652030701474219
- M. C. Jung, S.-T. Yun, J.-S. Lee and J.-U. Lee, “Baseline Study on Essential and Trace Elements in Polished Rice from South Korea,” Environmental Geochemistry and Health, Vol. 27, No. 5-6, 2005, pp. 455-464. doi:10.1007/s10653-005-4221-2
- E. Falahi, R. Hedaiati and A. R. Guiasvand, “Survey of Iron, Zinc, Calcium, Copper, Lead, and Cadmium in Rice Samples Grown in Iran,” Food Additives and Contaminants Part B-Surveillance, Vol. 3, No. 2, 2010, pp. 80-83. doi:10.1080/19440041003671288
- N. Rogan, T. Serafimovski, M. Dolenec, G. Tasev and T. Dolenec, “Heavy Metal Contamination of Paddy Soils and Rice (Oryza sativa L.) from Koani Field (Macedonia),” Environmental Geochemistry and Health, Vol. 31, No. 4, 2009, pp. 439-451. doi:10.1007/s10653-008-9197-2
- R. J. B. Heinemann, P. L. Fagundes, E. A. Pinto, M. V. C. Penteado and U. M. Lanfer-Marquez, “Comparative Study of Nutrient Composition of Commercial Brown, Parboiled and Milled Rice from Brazil,” Journal of Food Composition and Analysis, Vol. 18, No. 4, 2005, pp. 287- 296. doi:10.1016/j.jfca.2004.07.005
- V. F. Fairbanks, “Modern Nutrition in Health and Disease,” M. E. Shills, J. A. Olson, M. Shike and A. C. Ross, Eds., 9th Edition, Lippincott Williams and Wilkins, Hagerstown, 1999.
- J. T. Dunn, E. A. Pretell and C. H. Daza, “Towards the Eradication of Endemic Goiter, Cretinism, and Iodine Deficiency,” Pan American Health Organization, Washington DC, 1986.
- K. V. Rajagopalan, “Molybdenum—An Essential TraceElement in Human-Nutrition,” Annual Review of Nutrition, Vol. 8, 1988, pp. 401-427. doi:10.1146/annurev.nu.08.070188.002153
- T. D. Phuong, P. V. Chuong, D. T. Khiem and S. Kokot, “Elemental Content of Vietnamese Rice Part 1, Sampling, Analysis and Comparison with Previous Studies,” Analyst, Vol. 124, No. 4, 1999, pp. 553-560. doi:10.1039/a808796b
- K. M. Marr, G. D. Batten and A. B. Blakeney, “Relationship between Minerals in Australian Brown Rice,” Journal of Science Food Agricultural, Vol. 68, No. 3, 1995, 285-291. doi:10.1002/jsfa.2740680305
- N. K. Mohamed and N. M. Spyrou, “Trace Elemental Analysis of Rice Grown in Two Regions of Tanzania,” Journal of Radioanalytical Nuclear Chemistry, Vol. 281, No. 1, 2009, pp. 79-82. doi:10.1007/s10967-009-0078-7
- K. A. Wolnik, F. L. Fricke, S. G. Capar, M. W. Meyer, R. D. Satzger, E. Bonnin and C. M. Gaston, “Elements in Major Raw Agricultural Crops in the United-States.3. Cadmium, Lead, and 11 Other Elements in Carrots, Field Corn, Onions, Rice, Spinach, and Tomatoes,” Journal of Agricultural and Food Chemistry, Vol. 33, No. 5, 1985, pp. 807-811. doi:10.1021/jf00065a010
NOTES
*Corresponding author.