Paper Menu >>
Journal Menu >>
 Vol.2, No.5, 469-475 (2010) Natural Science http://dx.doi.org/10.4236/ns.2010.25058 Copyright © 2010 SciRes. OPEN ACCESS Extraction, identification and adsorption-kinetic studies of a natural color component from G. sepium Konaghatta Narayanachar Vinod1, Puttaswamy1*, Kurikempanadoddi Ninge Gowda2, Rajagopal Sudhakar2 1Department of Post-Graduate studies in Chemistry, Central College Campus, Bangalore University, Bangalore, India; *Corresponding Author: pswamy_chem@yahoo.com 2Department of Apparel Technology and Management, Central College Campus, Bangalore University, Bangalore, India; Received 24 December 2009; revised 25 January 2010; accepted 23 February 2010. ABSTRACT The use of synthetic dyes causes environmental pollution as majority of these dyes are toxic and non-biodegradable. Natural dyes on the other hand have proved to be eco-friendly, biodegra- dable and highly compatible with the environ- ment. Consequently, dyes derived from natural sources have emerged as important alternatives to synthetic dyes. In the present work, the major color component isolated from the pods of G. sepium plant is morin, which is a flavonoid moiety. The dyeing behaviour of this component on silk yarn was investigated. Mordanting stu- dies have indicated that the post-mordanting method was found to be a better method com- pared to pre-mordanting. Variation of pH on dye extract pointed out that the maximum absorb- ance was at pH 4 and hence all the dyeing studies have been carried out at that pH. Ther- modynamic parameters were determined by studying the dyeing process at different tem- peratures. Heat of dyeing was positive which indicated the dyeing process was endothermic. The adsorption process of morin on silk was tested with Langmuir, Freundlich and Tempkin- Pyzhev isotherm models. The adsorption proc- ess followed both the Langmuir and Freund- lich isotherms. The value of regression coeffi- cient, however, indicated that the Langmuir isotherm was a better fit than the Freundlich isotherm. These results signified that the adsor- ption of morin on silk yarn was homogeneous in nature with the formation of a monolayer. Hence, the dye obtained from the pods of G. sepium plant may be an alternative source to synthetic dye for the dyeing of silk as well as other textile fabrics. Keywords: G. Sepium; Morin; Adsorption-Kinetics; Silk 1. INTRODUCTION The use of synthetic dyes causes environmental pollu- tion as majority of these dyes are toxic and non-biode- gradable. For this reason, there is a revival of interest in the non-toxic and eco-friendly natural dyes. Nature pro- vides a wealth of plants which yield color for the pur- pose of dyeing, many have been used since antiquity [1-4]. Natural dyes exhibit better biodegradability com- pared to their synthetic counterparts and generally have a higher compatibility with the environment. There are several reports in the literature pertaining to the applica- tion of natural colorants and evaluation of their dyeing properties on various fibers [5-8], but a very few reports are available on their kinetic and adsorption aspects [9-11]. G. sepium, is an important member of the family Fabaceae, which is widely naturalized in the tropical Americas, Caribbean, Africa, Asia, and the Pacific Is- lands. Since this tree possesses high nitrogen-fixing properties and also the leaves can be used for mulch and green manure, which makes it highly suitable in agro- forestry systems. G. sepium is a small, thornless, semi- deciduous tree, which yields flattened pods, 10-15 cm long, containing three to eight seeds. The abundantly available pods, unless otherwise used go as natural waste. Keeping this in view and also due to our continued interest in the identification of colorant from natural plants, a major color component from the pods of G. sepium plant was identified. The present research was performed with the following objectives: 1) To extract and isolate the main color component from the pods of G. sepium plant, 2) To explore the dyeing properties of the color component on silk, 3) To study adsorption iso- therms of the color component on silk and 4) To evaluate the thermodynamic parameters of the dyeing process through kinetic studies.  K. N. Vinod et al. / Natural Science 2 (2010) 469-475 Copyright © 2010 SciRes. OPEN ACCESS 470 2. MATERIALS AND METHODS 2.1. Materials The pods of G. Sepium were collected from the south- eastern region, Shimoga, India. The pods were washed well with tap water and dried under laboratory condi- tions. The dried pods were then finely ground to powder. Raw silk yarn of 40 denier was scoured with 2 g dm-3 non-ionic detergent and 1 g dm-3 sodium carbonate at 90℃ for 1 h, and rinsed with water and dried under la- boratory conditions. 2.2. Isolation The air dried powder of G. Sepium pod (550 g) was ex- tracted with 90% methanol (3 × 250 ml) at room tem- perature using a soxhlet apparatus and the procedure was repeated till the color from the extract was negligible. The extracts were combined, concentrated under reduced pressure and the residue was successively extracted with pet. ether, chloroform and ethyl acetate. The ethyl ace- tate soluble fraction was concentrated under reduced pressure and was chromatographically separated over silica gel (60-120 mesh) using methanol as eluent. The fractions obtained were combined according to TLC (silica gel, CHCl3-MeOH-H2O, 80:18:2) in increasing order of polarity to yield two fractions. Solvent was evaporated from the first fraction (major) to get yellow colored amorphous compound and it was used for fur- ther studies. 2.3. Mordanting Pre-and post-mordantings were carried out on silk using 2, 4 and 6% tannic acid and alum (Al(NH4) (SO4)2. 12H2O) as mordants, separately. Mordanting was carried out for 30 min at 70℃ and the silk was then rinsed with tap water and dried. 2.4. Dyeing Open bath beaker dyeing machine equipped with pro- grammable control of temperature and time was used to carry out all dyeing studies. The silk yarn was dyed with 4% dye solution at pH 4 with M: L ratio of 1 : 20. The dyeing was started at 40℃ and the temperature was gradually raised to 90℃ in 20 min and the dyeing proc- ess was continued for 45 min. After dyeing, samples were removed from dyeing machine and soaped at 60℃ for 10 min. Further, the samples were rinsed with tap water and dried. In case of post-mordanting samples, soaping was done after mordanting. 2.5. Characterization IR spectrum of the major color component was recorded on a Perkin-Elmer 298 grating IR Spectrophotometer. The NMR spectrum of the compound was recorded on the Brucker 400 NMR spectrophotometer. The mass spectrum was recorded on an Esquire 3000 plus spectrometer. 2.6. Absorbance and Color Strength Measurements The dye solutions (1-5%) of the extract were prepared with M: L ratio of 1 : 20. The absorbance of the dye so- lutions was recorded prior and after the dyeing process using UV-Vis spectrophotometer. The dye exhaustion was calculated using the equation, % Exhaustion = [(Cg-Ct)/Cg] × 100, where Cg is the concentration of dye offered and Ct is the concentration of residual dye in the spent liquor. The surface reflectance and colorimetric data (CIE L* a* b* C h) for the dyed samples were obtained by Gretag Macbath Color Eye 7000A spectrophotometer. The spec- trophotometer was interfaced to a PC under illuminant D65 with a 100 standard observer. Surface color strength (K/S) was calculated from the surface reflectance values using the Kubelka-Munk equation [12]: K/S = (1-R)2/2R, where R is the reflectance, K is the absorption coeffi- cient and S is the light scattering coefficient. A higher K/S value signifies better dye receptivity of the sub- strates. The wash fastness of the dyeing was tested using ISO method 105-C10-A(1)-2006 and crocking fastness was assessed using AATCC Test Method 8-1996. Color fastness to light was evaluated as per AATCC Test Method 16-2004 option 5. 2.7. Kinetic Studies Kinetic studies were investigated with aqueous solution of the dye extract 0.5 g dm-3 (without any further purifi- cation) prepared in an acetate buffer of pH 4. The dyeing was carried out with M:L ratio of 1:20 at 50℃. Known volume (5 ml each) of the dye-bath solution was pipetted into a cuvette at regular intervals of time and absorbance measurements were made at its λmax 580 nm (Figure 1). The absorbance readings of Do and Dt at the beginning and at any time interval during the dyeing process, 0 0.2 0.4 0.6 0.8 1 1.2 1.4 1.6 1.8 2 400 450 500 550 600 650 700 750 800 850 Wavelength in nm Absorbanc e pH 4pH 7pH 9 Figure 1. Visible Spectra of G. sepium in aqueous solution at different pH. 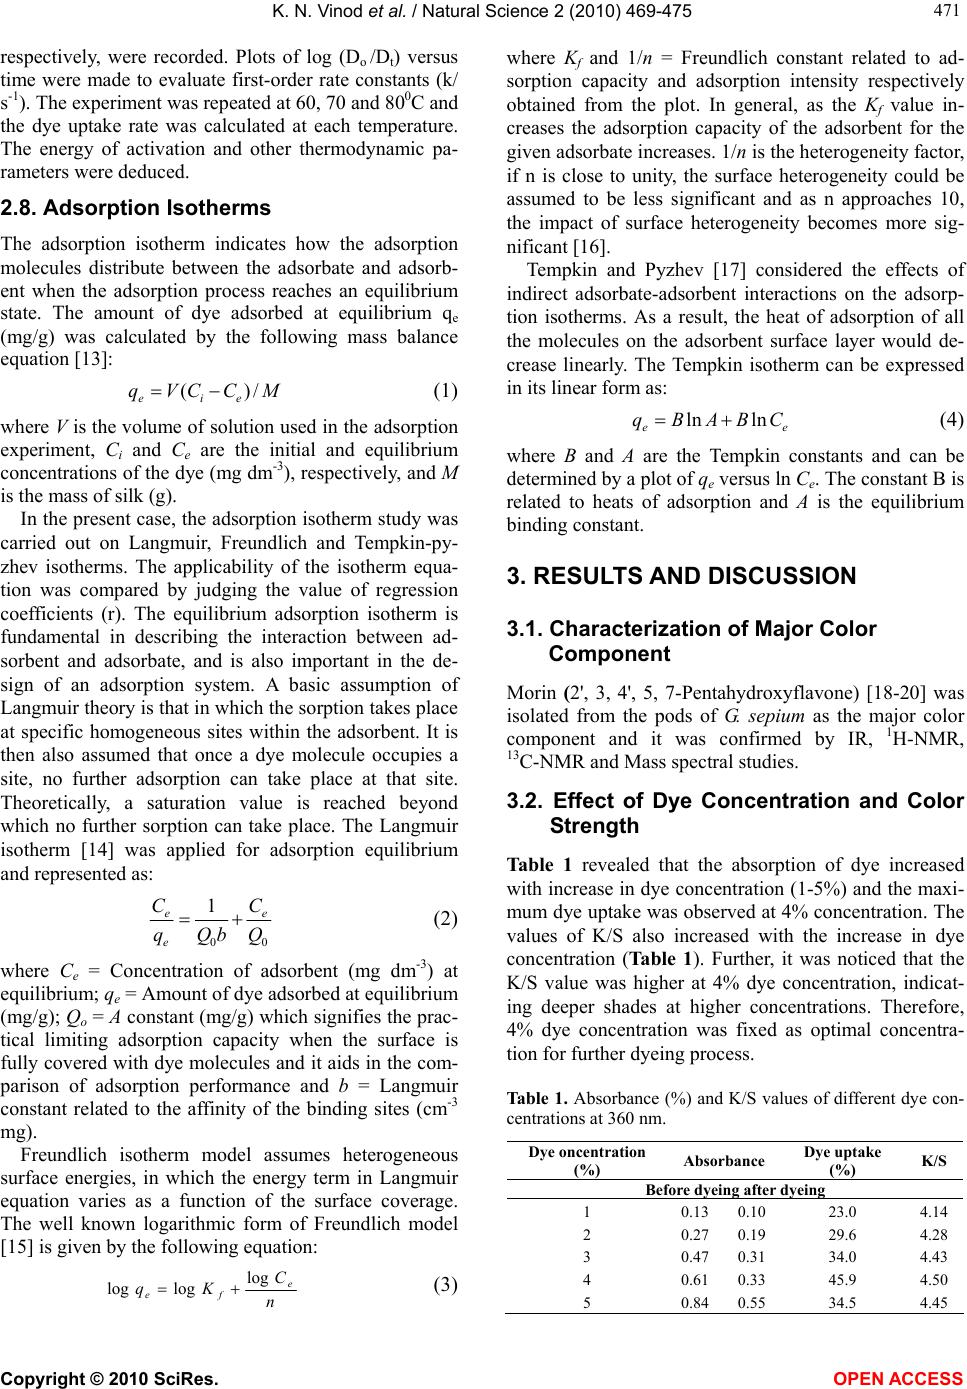 K. N. Vinod et al. / Natural Science 2 (2010) 469-475 Copyright © 2010 SciRes. OPEN ACCESS 471 471 respectively, were recorded. Plots of log (Do /Dt) versus time were made to evaluate first-order rate constants (k/ s-1). The experiment was repeated at 60, 70 and 800C and the dye uptake rate was calculated at each temperature. The energy of activation and other thermodynamic pa- rameters were deduced. 2.8. Adsorption Isotherms The adsorption isotherm indicates how the adsorption molecules distribute between the adsorbate and adsorb- ent when the adsorption process reaches an equilibrium state. The amount of dye adsorbed at equilibrium qe (mg/g) was calculated by the following mass balance equation [13]: MCCVq eie /)( (1) where V is the volume of solution used in the adsorption experiment, Ci and Ce are the initial and equilibrium concentrations of the dye (mg dm-3), respectively, and M is the mass of silk (g). In the present case, the adsorption isotherm study was carried out on Langmuir, Freundlich and Tempkin-py- zhev isotherms. The applicability of the isotherm equa- tion was compared by judging the value of regression coefficients (r). The equilibrium adsorption isotherm is fundamental in describing the interaction between ad- sorbent and adsorbate, and is also important in the de- sign of an adsorption system. A basic assumption of Langmuir theory is that in which the sorption takes place at specific homogeneous sites within the adsorbent. It is then also assumed that once a dye molecule occupies a site, no further adsorption can take place at that site. Theoretically, a saturation value is reached beyond which no further sorption can take place. The Langmuir isotherm [14] was applied for adsorption equilibrium and represented as: 00 1 Q C bQq Ce e e (2) where Ce = Concentration of adsorbent (mg dm-3) at equilibrium; qe = Amount of dye adsorbed at equilibrium (mg/g); Qo = A constant (mg/g) which signifies the prac- tical limiting adsorption capacity when the surface is fully covered with dye molecules and it aids in the com- parison of adsorption performance and b = Langmuir constant related to the affinity of the binding sites (cm-3 mg). Freundlich isotherm model assumes heterogeneous surface energies, in which the energy term in Langmuir equation varies as a function of the surface coverage. The well known logarithmic form of Freundlich model [15] is given by the following equation: n C Kq e fe log loglog (3) where Kf and 1/n = Freundlich constant related to ad- sorption capacity and adsorption intensity respectively obtained from the plot. In general, as the Kf value in- creases the adsorption capacity of the adsorbent for the given adsorbate increases. 1/n is the heterogeneity factor, if n is close to unity, the surface heterogeneity could be assumed to be less significant and as n approaches 10, the impact of surface heterogeneity becomes more sig- nificant [16]. Tempkin and Pyzhev [17] considered the effects of indirect adsorbate-adsorbent interactions on the adsorp- tion isotherms. As a result, the heat of adsorption of all the molecules on the adsorbent surface layer would de- crease linearly. The Tempkin isotherm can be expressed in its linear form as: ee CBABq lnln (4) where B and A are the Tempkin constants and can be determined by a plot of qe versus ln Ce. The constant B is related to heats of adsorption and A is the equilibrium binding constant. 3. RESULTS AND DISCUSSION 3.1. Characterization of Major Color Component Morin (2', 3, 4', 5, 7-Pentahydroxyflavone) [18-20] was isolated from the pods of G. sepium as the major color component and it was confirmed by IR, 1H-NMR, 13C-NMR and Mass spectral studies. 3.2. Effect of Dye Concentration and Color Strength Table 1 revealed that the absorption of dye increased with increase in dye concentration (1-5%) and the maxi- mum dye uptake was observed at 4% concentration. The values of K/S also increased with the increase in dye concentration (Table 1). Further, it was noticed that the K/S value was higher at 4% dye concentration, indicat- ing deeper shades at higher concentrations. Therefore, 4% dye concentration was fixed as optimal concentra- tion for further dyeing process. Table 1. Absorbance (%) and K/S values of different dye con- centrations at 360 nm. Dye oncentration (%) Absorbance Dye uptake (%) K/S Before dyeing after dyeing 1 0.130.10 23.0 4.14 2 0.270.19 29.6 4.28 3 0.470.31 34.0 4.43 4 0.610.33 45.9 4.50 5 0.840.55 34.5 4.45  K. N. Vinod et al. / Natural Science 2 (2010) 469-475 Copyright © 2010 SciRes. OPEN ACCESS 472 3.3. Effect of Mordanting The K/S values of the mordanted samples were better compared to that of the un-mordanted samples (Table 2). The K/S values and the fastness properties (Table 3) of the post-mordanted samples were better compared to pre-mordant samples. Tannic acid was found to be a bet- ter mordant with deeper shades and fastness ratings as compared to alum in pre-mordanting. But in case of post-mordanting, both the mordants showed comparable K/S values. All the color co-ordinates were positive and hence the dyed samples were located in the yellow-red quadrant of the color-space diagram. 3.4. Effect of pH on Dye Extract The visible spectrum of the dye extract at different pH (4, 7 and 9) is illustrated in Figure 1. The λmax of the dye extract remained the same with varying pH. The ab- sorbance of the dye extract increased with an increase in pH, which may be due to the high solubility of phenolic groups in the alkaline pH. 3.5. Kinetic Studies From the linear plot log k/ versus 1/T (r = 0.9979), the energy of activation (Ea) was found to be 61.2 kJ mol-1. Further, thermodynamic parameters such as ΔH≠, ΔG≠, Table 2. Color co-ordinates and K/S values of the dyed silk samples. Method Mordants K/S L* a* b* C h Nil 4.50 63.1 15.1 17.3 23.0 48.9 Alum (2%) 4.61 69.7 11.5 14.1 18.2 50.5 Alum (4%) 4.63 69.7 11.7 13.8 18.1 49.5 Alum (6%) 4.73 69.9 11.8 13.9 18.2 49.6 Tannic acid (2%) 5.22 75.2 9.85 12.0 15.5 50.7 Tannic acid (4%) 5.27 74.3 10.1 12.8 16.3 51.6 Pre Tannic acid (6%) 5.37 74.9 9.41 12.7 15.8 53.5 Alum (2%) 5.76 62.5 12.9 23.5 26.9 61.1 Alum (4%) 5.55 63.1 13.2 22.8 26.3 59.9 Alum (6%) 5.44 62.8 13.2 22.9 26.5 60.1 Tannic acid (2%) 5.66 68.1 12.7 17.4 21.6 53.7 Tannic acid (4%) 5.57 68.7 12.4 17.5 21.5 54.5 Post Tannic acid (6%) 5.30 66.2 13.2 19.9 23.9 56.3 L*- Lightness, a* - (+ ve- red, - ve- blue), b* - (+ ve- yellow, - ve- green), C-Chroma and h-Hue. Table 3. Results derived from fastness properties of dyed silk samples. Mordants light fastness crocking fastness wash fastness wet dry Nil 2 4 4-5 3-4 Alum (2%) 2 4-5 4-5 4 Alum (4%) 2-3 4-5 5 4-5 Alum (6%) 2-3 4-5 5 5 Tannic acid (2%) 2-3 4-5 5 4-5 Tannic acid (4%) 2-3 5 5 5 Pre Tannic acid (6%) 3 5 5 5 Alum (2%) 2 4-5 4-5 4 Alum (4%) 2 4-5 4-5 4 Alum (6%) 2-3 4-5 5 4-5 Tannic acid (2%) 2 4-5 4-5 4 Tannic acid (4%) 2-3 5 5 4-5 Post Tannic acid (6%) 2-3 5 5 5 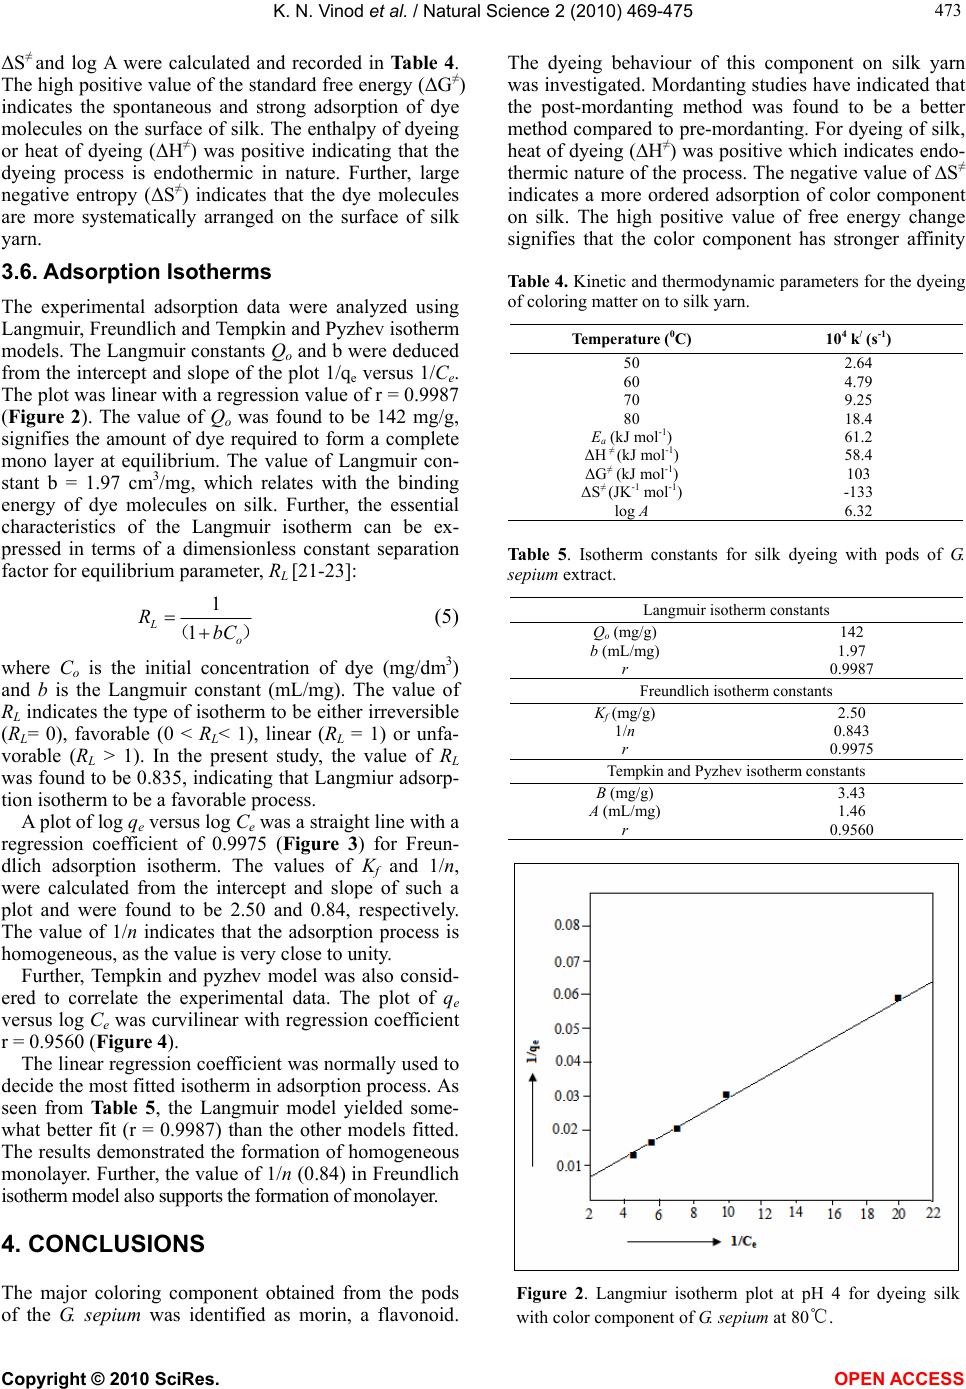 K. N. Vinod et al. / Natural Science 2 (2010) 469-475 Copyright © 2010 SciRes. OPEN ACCESS 473 473 ΔS≠ and log A were calculated and recorded in Table 4. The high positive value of the standard free energy (ΔG≠) indicates the spontaneous and strong adsorption of dye molecules on the surface of silk. The enthalpy of dyeing or heat of dyeing (ΔH≠) was positive indicating that the dyeing process is endothermic in nature. Further, large negative entropy (ΔS≠) indicates that the dye molecules are more systematically arranged on the surface of silk yarn. 3.6. Adsorption Isotherms The experimental adsorption data were analyzed using Langmuir, Freundlich and Tempkin and Pyzhev isotherm models. The Langmuir constants Qo and b were deduced from the intercept and slope of the plot 1/qe versus 1/Ce. The plot was linear with a regression value of r = 0.9987 (Figure 2). The value of Qo was found to be 142 mg/g, signifies the amount of dye required to form a complete mono layer at equilibrium. The value of Langmuir con- stant b = 1.97 cm3/mg, which relates with the binding energy of dye molecules on silk. Further, the essential characteristics of the Langmuir isotherm can be ex- pressed in terms of a dimensionless constant separation factor for equilibrium parameter, RL [21-23]: )(o LbC R 1 1 (5) where Co is the initial concentration of dye (mg/dm3) and b is the Langmuir constant (mL/mg). The value of RL indicates the type of isotherm to be either irreversible (RL= 0), favorable (0 < RL< 1), linear (RL = 1) or unfa- vorable (RL > 1). In the present study, the value of RL was found to be 0.835, indicating that Langmiur adsorp- tion isotherm to be a favorable process. A plot of log qe versus log Ce was a straight line with a regression coefficient of 0.9975 (Figure 3) for Freun- dlich adsorption isotherm. The values of Kf and 1/n, were calculated from the intercept and slope of such a plot and were found to be 2.50 and 0.84, respectively. The value of 1/n indicates that the adsorption process is homogeneous, as the value is very close to unity. Further, Tempkin and pyzhev model was also consid- ered to correlate the experimental data. The plot of qe versus log Ce was curvilinear with regression coefficient r = 0.9560 (Figure 4). The linear regression coefficient was normally used to decide the most fitted isotherm in adsorption process. As seen from Table 5, the Langmuir model yielded some- what better fit (r = 0.9987) than the other models fitted. The results demonstrated the formation of homogeneous monolayer. Further, the value of 1/n (0.84) in Freundlich isotherm model also supports the formation of monolayer. 4. CONCLUSIONS The major coloring component obtained from the pods of the G. sepium was identified as morin, a flavonoid. The dyeing behaviour of this component on silk yarn was investigated. Mordanting studies have indicated that the post-mordanting method was found to be a better method compared to pre-mordanting. For dyeing of silk, heat of dyeing (∆H≠) was positive which indicates endo- thermic nature of the process. The negative value of ∆S≠ indicates a more ordered adsorption of color component on silk. The high positive value of free energy change signifies that the color component has stronger affinity Table 4. Kinetic and thermodynamic parameters for the dyeing of coloring matter on to silk yarn. Temperature (0C) 104 k/ (s-1) 50 2.64 60 4.79 70 9.25 80 18.4 Ea (kJ mol-1) 61.2 ΔH ≠ (kJ mol-1) 58.4 ΔG≠ (kJ mol-1) 103 ΔS≠ (JK-1 mol-1) -133 log A 6.32 Table 5. Isotherm constants for silk dyeing with pods of G. sepium extract. Langmuir isotherm constants Qo (mg/g) 142 b (mL/mg) 1.97 r 0.9987 Freundlich isotherm constants Kf (mg/g) 2.50 1/n 0.843 r 0.9975 Tempkin and Pyzhev isotherm constants B (mg/g) 3.43 A (mL/mg) 1.46 r 0.9560 Figure 2. Langmiur isotherm plot at pH 4 for dyeing silk with color component of G. sepium at 80℃.  K. N. Vinod et al. / Natural Science 2 (2010) 469-475 Copyright © 2010 SciRes. OPEN ACCESS 474 Figure 3. Freundlich isotherm plot at pH 4 for dyeing silk with color component of G. sepium at 80℃. 10 30 50 70 90 0.6 0.70.8 0.911.11.2 1.31.4 2 + log Ce qe Figure 4. Tempkin and Pyzhev isotherm plot at pH 4 for dyeing silk with color component of G. sepium at 80℃. towards silk. The adsorption isotherm of morin on silk was carried out using different models: Langmuir, Freundlich and Tempkin-Pyzhev models. The adsorption of morin on silk fitted well to the Langmuir and Freun- dlich isotherm. However, Langmuir model was found to be better fit, and suggesting the formation of homoge- neous monolayer on silk. 5. ACKNOWLEDGEMENTS One of the authors (K.N.V.) is grateful to Bangalore University, Ban- galore for awarding the Research Fellowship under the Interdiscipli- nary Collaborative Research Project. REFERENCES [1] Cerrato, A., Santis, D.D. and Moresi, M. (2002) Produc- tion of luteolin extracts from Reseda luteola and assess- ment of their dyeing properties. Journal of the Science of Food and Agriculture, 82(10), 1189-1192. [2] Angelini, L.G., Pistelli, L., Belloni, P., Bertoli, A. and Panconesi, S. (1997) Rubia tinctorum a source of natural dyes: Agronomic evaluation, quantitative analysis of alizarin and industrial assays. Industrial Crops and Products, 6(3-4), 303-307. [3] Angelini, L.G., Bertoli, A., Rolandelli S. and Pistelli, L. (2003) Agronomic potential of Reseda luteola L. as new crop for natural dyes in textiles production. Industrial Crops and Products, 17(3), 199-203. [4] Santis, D.D. and Moresi, M. (2007) Production of aliza- rin extracts from Rubia tinctorum and assessment of their dyeing properties. Industrial Crops and Products, 26(2), 151-154. [5] Septhum, C., Rattanaphani, S., Bremner, J.B. and Rat- tanaphani, V. (2009) An adsorption study of alum-morin dyeing onto silk yarn. Fibers and Polymers, 10(4), 481-485. [6] Kim, S.H. (2006) Dyeing characteristics and UV protec- tion property of green tea dyed cotton fabrics. Fibers and Polymers, 7(3), 255-259. [7] Shanker, R. and Vankar, P.S. (2007) Dyeing cotton, wool and silk with Hibiscus mutabilis. Dyes and Pigments, 74(2), 464-468. [8] Shaukat, A., Tanveer, H. and Rakhshanda, N. (2009) Optimization of alkaline extraction of natural dye from Henna leaves and its dyeing on cotton by exhaust method. Journal of Cleaner Production, 17(1) , 61-65. [9] Gulrajani, M.L., Bhaumik, S., Oppermann, W. and Har- dtmann, G. (2002) Kinetic and thermodynamic studies on red sandalwood. Indian Journal of Fibre & Textile Re- search, 27(1), 91-95. [10] Rattanapani, S., Chairat, M., Bremner, J.B. and Rattana- pani, V. (2007) An adsorption and thermodynamic study of lac dyeing on cotton pretreated with chitosan. Dyes and Pigments, 72(1), 88-92. [11] Janhom, S., Griffiths, P., Watanesk R. and Watanesk, S. (2004) Enhancement of lac dye adsorption on cotton fi- bers by poly(ethyleneimine). Dyes and Pigments, 63(3), 231-235. [12] Kubelka, P. (1954) New contributions to the optics of intensely light-scattering materials. Part II: Nonhomo- geneous layers. Journal of the Optical Society of America, 44(4), 330-334. [13] Alkan, M., Dogan, M., Turhan, Y., Demirbas, O. and Turan, P. (2008) Adsorption kinetics and mechanism of maxilon blue 5G dye on sepiolite from aqueous solutions. Chemistry Engineering Journal, 139(2), 213-216. [14] Langmuir, I. (1916) The constitution and fundamental properties of solids and liquids. Journal of American Chemistry Society, 38(11), 2221-2221. [15] Freundlich, H.M.F. (1906) Over the adsorption in solu- tion. Journal of Physics and Chemistry, 57, 385. [16] Davila, M.M., Elizalde, M.P. and Pelaez, A.A. (2005) Adsorption interaction between natural adsorbents and textile dyes in aqueous solution. Colloids and Surfaces A, 254(1-3), 107-109.  K. N. Vinod et al. / Natural Science 2 (2010) 469-475 Copyright © 2010 SciRes. OPEN ACCESS 475 475 [17] Tempkin, M.J. and Pyzhev, V. (1940) Recent modifica- tions to Langmuir isotherms. Acta Physiochim Under- graduate Research Scholarship Scheme, 12, 217-225. [18] Ting, Y.C., Wen, H.P., Long, H.T., Hsuan, L.Y., Rong, C.F. and Chang, W.U.Y. (2009) Flavonol glycosides from Muehlenbeckia platyclada and their anti-inflammatory activity. Chemical and Pharmaceutical Bulletin, 57(3), 280-284. [19] Ehala, S., Vaher, M. and Kaljurand, M. (2005) Charac- terization of phenolic profiles of Northern European ber- ries by capillary electrophoresis and determination of their antioxidant activity. Journal of Agricultural and Food Chemistry, 53(6), 6484-6487. [20] Yinon, J., Issachar, D. and Boettger, H.G. (1978) Studies in chemical ionization mass spectrometry of some fla- vonoids. Organized Mass Spectrometry, 13(7), 167-169. [21] Kannan, N. and Sundaram, M. (2002) Kinetics and mecha- nism of removal of methylene blue by adsorption on vari- ous carbons-A comparative study. Dyes and Pigments, 51(1), 25-29. [22] Jain, A.K., Gupta, V.K. and Suhas, A.B. (2003) Utiliza- tion of industrial waste products as adsorbents for the removal of dyes. Journal of Hazardous Materials, 101(1), 31-35. [23] Sivaraj, R., Namasivayam, C. and Kadirvelu, K. (2001) Orange peel as an adsorbent in the removal of Acid violet 17 (acid dye) from aqueous solutions. Waste Manage- ment, 21(1), 105-108. |