S. RASSOULI-CURRIER
Table 1.
Summary statistics for the variables (n = 17).
Variable Mean SD Minimum Maximum Sum
RA/AB 42.00 40.16 2.00 134.00 714.00
OPA 32.41 28.83 1.00 96.00 551.00
TEACH 8.82 3.81 4.00 17.00 150.00
PHD 0.80 0.14 0.53 1.00 13.53
TT 0.78 0.21 0.25 1.00 13.21
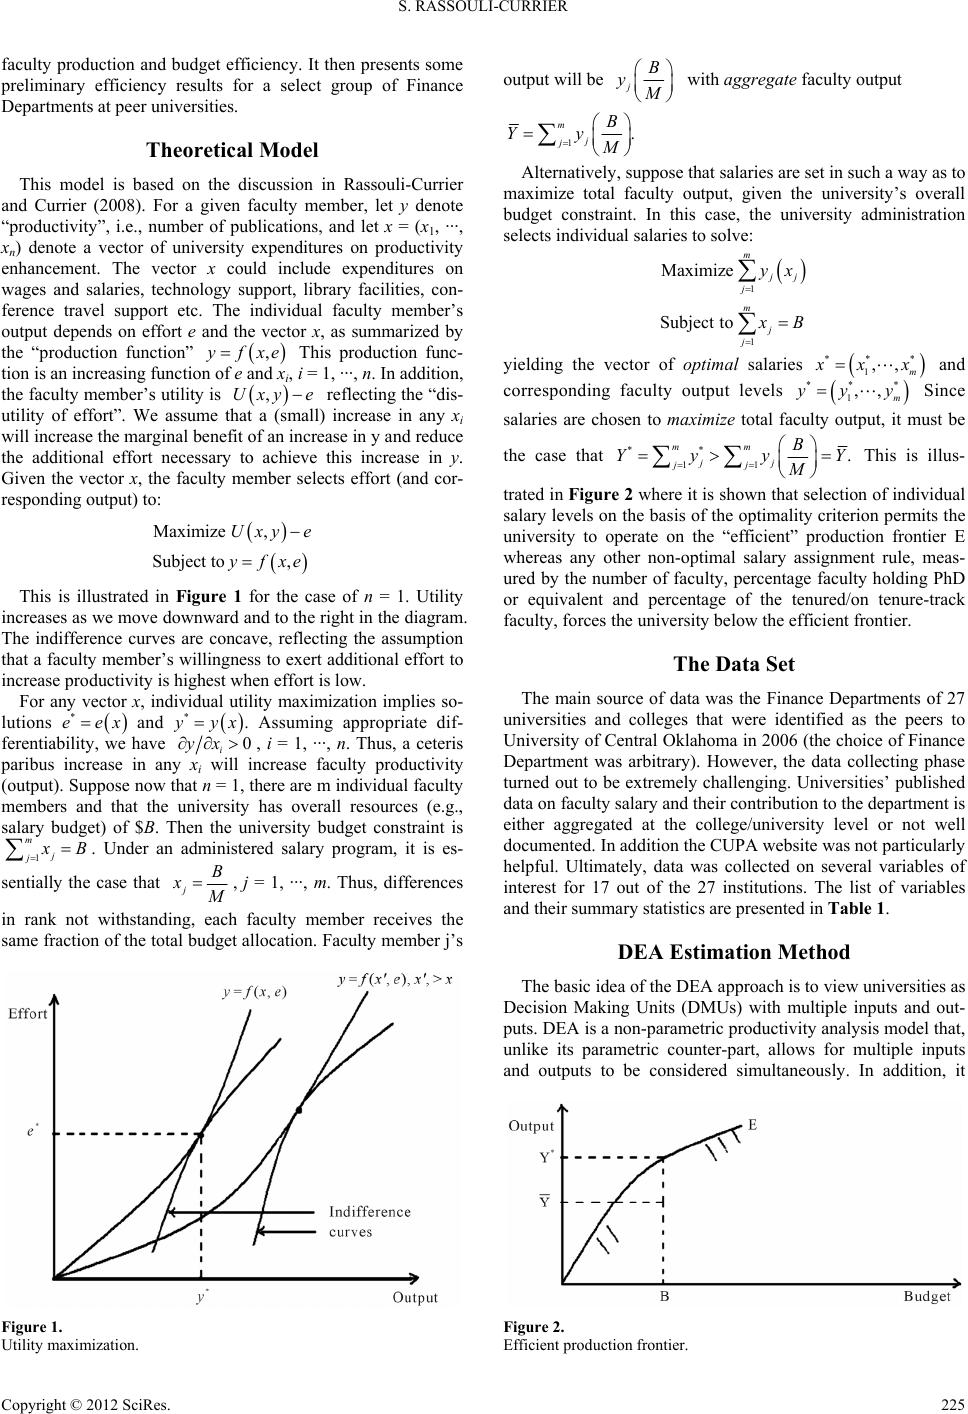
Where: Y1 = RA/AB is the number of refereed articles/authored books; Y2 = OPA
is other professional activities such as published articles of merit, working papers,
professional presentations etc; X1 = TEACH is the number of teaching staff; X2 =
PHD is the percentage of the faculty holding Ph. Ds or equivalent; X3 = TT is the
percentage of the faculty that is tenured or is on tenure track.
does not require any restrictive assumptions regarding the func-
tional form of the model.
On the down side, DEA assumes that all DMUs have the
same deterministic (as opposed to stochastic) production fron-
tier and that any deviation from the frontier is due to ineffi-
ciency, which may not be realistic. However, it is a reasonably
powerful diagnostic tool that can be used to measure the effi-
ciency of a set of homogenous DMUs individually (e.g., peer
universities) relative to the most efficient unit. Studying the
reasons for any possible inefficiencies and finding remedies to
eliminate them is the responsibility of the unit’s decision maker
(Talluri, 2000).
Following Coelli et al., (1998) in the DEA method, the tech-
nical efficiency is identified as a proportional increase in the
output vector with a given input vector. Therefore, the out-
put-oriented measure of technical efficiency (in case of a pro-
duction function) is the solution to the following constant re-
turns to scale (CRS) DEA linear programming problem:
Maximize ,
,
Subject to0
0
0
i
i
yY
xX
where is a scalar, and yi and xi are column vectors of out-
puts and inputs respectively for the ith university. λ is an N × 1
vector of constants. The variable Y is an M × N output matrix
and X is a K × N input matrix, and the proportional increase in
outputs that could be achieved by the ith university, holding
inputs constant, is , (1) with
1 1 the univer-
sity’s efficiency score, which is between 0 and 1 (For a com-
plete explanation of DEA and its advantages and disadvantages
see Coelli et al., 1998)
Empirics
The empirical model for the DEA estimation is defined as
Output Inputf where Y1, Y2 are considered the outputs
and X1, X2 and X3 are inputs. Due to difficulties obtaining dis-
aggregated salary data, X1, X2 and X3 are proxies for the budget.
The justification here is that the higher the faculty salary
(budget), the better the universities ability to hire more faculty
in general and have a larger body of teaching staff, a higher
percentage of faculty holding PhDs and being tenured or on
tenure track. The DEA efficiency estimation for each institution,
under the assumption of variable return to scale (VRS), was
computed using DEAP 2.1 software developed by T. J. Coelli.
VRS was chosen due to the rather restrictive nature of CRS.
The list of the universities and their efficiency scores are not
included in the paper to preserve both the privacy of the institu-
tion and because the scores in and of themselves are not the
focus of this research.
The summary statistic of the efficiency scores suggests a
mean score of 0.74 with a standard error equal to 0.08. The
95% confidence interval for the mean has a 0.18 margin of
error. There is a wide range of efficiency from 0.023 to 1. The
scores are negatively skewed (skewness = –0.99), as expected
from the efficiency scores, suggesting the existence of ineffi-
ciency in at least some of the universities under study. Based on
the theoretical model here, these inefficiencies stem from the
existence of inefficient allocations of the total budgets.
Qualifications and Concluding Remarks
Historically, universities with larger proportions of budget
allocated to teaching staff (which generally translates to a larger
number of faculty) are assumed to be more productive i.e., to
have higher efficiency. These universities generally have a
higher percentage of faculty holding a Doctorate, tenured or on
tenure track. Some examples among the sample considered here
are University of Colorado-Denver and the University of Texas-
San Antonio. These universities have larger number of faculty
with well above average number of refereed publications. This
observation does not necessarily hold for all universities.
This study attempts to get a preliminary idea of the charac-
teristics of a “peer group” identified by UCO in 2006. The pre-
liminary nature of this research suggests several shortcomings
such as those stemming from the deterministic nature of DEA
and the inability to perform statistical testing etc. However, the
most important shortcoming of results stems from the enor-
mous difficulty of the obtaining disaggregated salary data from
universities. Despite all of this, the study can be considered a
first step and a baseline for future studies. As one potential
example, one can argue that perhaps the criteria that identify
universities as peers should be reexamined since our prelimi-
nary results seem to suggest that the existence of a strong ho-
mogeneity among these universities is highly questionable. It is
noteworthy that since 2007, UCO has adopted a new set of
peers. This change, at least implicitly, could be a validation for
the results of this paper.
REFERENCES
Aigner, D. J., Lovell, C. A. K., & Schmidt, P. (1977). Formulation and
estimation of stochastic frontier production function models. Journal
of Econometrics, 6, 21-38. doi:10.1016/0304-4076(77)90052-5
Alexander, F. K. (2001). The silent crisis: The relative fiscal capacity of
public universities to compete for faculty. The Review of Higher
Education, 24, 113-129.
Coelli, T. J., Rao, D. S. P., & Battese, G. E. (1998). An introduction to
efficiency and productivity analysis. Norwell: Kluwer Academic
Publishers. doi:10.1007/978-1-4615-5493-6
Cohn, E. (1973). Factors affecting variations in faculty salaries and
compensation in institutions of higher education. The Journal of
Higher Education, 44, 124-136. doi:10.2307/1980571
Faculty Compensation Systems Used in Higher Education (2001).
ASHE-ERIC Higher Ed uca ti on Report 28, 15-24.
Copyright © 2012 SciRes.
226