Open Journal of Statistics, 2012, 2, 204-207
http://dx.doi.org/10.4236/ojs.2012.22024 Published Online April 2012 (http://www.SciRP.org/journal/ojs)
Approximate Confidence Interval for the Mean of
Poisson Distribution
Manad Khamkong
Department of Statistics, Faculty of Science, Chiang Mai University, Chiang Mai, Thailand
Email: manad.k@cmu.ac.th
Received February 19, 2012; revised March 20, 2012; accepted April 5, 2012
ABSTRACT
A Poisson distribution is well used as a standard model for analyzing count data. Most of the usual constructing confi-
dence intervals are based on an asymptotic approximation to the distribution of the sample mean by using the Wald in-
terval. That is, the Wald interval has poor performance in terms of coverage probabilities and average widths interval
for small means and small to moderate sample sizes. In this paper, an approximate confidence interval for a Poisson
mean is proposed and is based on an empirically determined the tail probabilities. Simulation results show that the pro-
posed interval outperforms the others when small means and small to moderate sample sizes.
Keywords: Confidence Interval; Coverage Probability; Poisson Distribution; Expected Width; Wald Interval
1. Introduction
In many applications, the variable of interest is given in
the form of an event count or a non-negative integer
value which refers to the number of a occurrences of
particular phenomenon over a fixed set of time, distance,
area or space. Some examples of such data are number of
road accident victims per week, number of cases with a
specific disease in epidemiology, etc. Poisson distribu-
tion is a standard and good model for analyzing count
data and it seems to be the most common and frequently
used as well.
It is very interesting to construct a confidence interval
for a Poisson mean. Suppose 12 n
is a random
sample of size n from a Poisson (
X,X ,,X
0
) distribution. A
problem in finding an exact 1
two-sided confidence
interval for mean (
 
,UXLX

) of Poissonity is
given by




L
U
2
,
2
LXPX x
UXPX x






(1)
where L
and U
are, respectively, the lower and up-
per endpoints of the confidence interval.
Let
n
1
i
i1
Xn X

ˆ
is the maximum likelihood es-
timator of
. As n large by central limit theorem, the
Wald interval for the mean is given by
2
X
Xz n
, (2)
where 2
z
is the (12
)100th percentile of the stan-
dard normal distribution. The Wald interval with conti-
nuity correction interval (WCC) uses a normal distribu-
tion to approximate a Poisson distribution is defined as
2
X0.5
Xz n
, (3)
Several methods have been proposed to construct a
confidence interval for a Poisson mean such as Cai [1],
Byrne and Kabaila [2], Guan [3], Krishnamoorthy and
Peng [4], Stamey and Hamillton [5], Swifi [6] and others.
Guan [3] has suggested that the score interval (SC) is the
uppermost approximation on interval estimation of a
Poisson mean for moderate
is given by
2
2
2
2
2
z
X
z4n
Xz
2n n
 (4)
and he has also proposed the moved score confidence
interval (MSC) as follows,
2
2
2
2
2
z
X
0.46z 4n
Xz
nn
 (5)
Barker [7] has recommended the exact confidence in-
terval outperform but not explicit closed form and was
computed difficult. In particular, the Wald interval with
continuity correction interval (WCC) achieves coverage
probabilities quite faster than the Wald interval. However,
The WCC is known to perform poorly for small to mod-
C
opyright © 2012 SciRes. OJS
M. KHAMKONG 205
erate sample sizes.
This paper interested in estimating the tail probabilities
of the Wald interval that view be propose in the next sec-
tion. The third section, the empirical results of the simu-
lation studies are illustrated by the examples. Some con-
cluding remarks appear in the last section.
2. Proposed Confidence Interval
The basic idea improvement on the Wald interval is be-
ing that the confidence interval should add the tail prob-
bilities for small sample size adjusted by
2
2
z
c2n
X,X ,,X
. Let
12 n
be independent and identically distributed
random variables of size n selected from a Poisson dis-
tribution with mean
and
2
2
z
2n
c. Then
1) EXcc


 and 1
c nVX


 (6)
2)


D
nX c
N
0, 1n
 as (7)
According to Equation (7), it is appropriated to pro-
posed an approximate confidence interval for a Poisson
mean, called adding the tail probability of the Wald in-
terval (AWC) as follows,
2
2
2
X
z
2n n

z
X (8)
For any nominal (1
)100% confidence interval for
mean (
), the coverage probability at a fixed value of
is given by

 

i
Ui
e
i!
Li
i0
CP I

I

(9)
where {} is the indicator function of the bracketed
event. Similarly the expected width of any confidence
interval is
 
i
e
L ii!
i0
EW U i

0.95
(10)
3. Empirical Results
This section presents some selected empirical results for
comparing the performance of the aforementioned con-
fidence intervals for mean of Poisson distribution. The
proposed confidence interval, AWC, will be compared
with the other 3 intervals namely score interval (SC), the
moved score confidence interval (MSC) and the Wald
interval with continuity correction interval (WCC). The
estimated coverage probabilities and the average widths
of these intervals are evaluated by a Monte Carlo simula-
tion using 50,000 replications for small to moderate
sample sizes, n = 15, 25, 50, 100 and the confidence
interval level to be considered is 95% (1
 ),
provided by the statistical package R [8]. For each sam-
ple is drawn from a Poisson distribution with mean pa-
rameter
= 1, 1.5, 3, 5, 10.
3.1. Simulation Results
The simulation results are reported in Table 1. All con-
fidence intervals can control the coverage probabilities to
be close enough to the 0.95 level except WCC can
achieve coverage greater than nominal level for most
values of
. While an approximated confidence interval
having some of coverage probabilities less than the
nominal level when small means,
= 1, 1.5 and small
to moderate sample sizes, n = 15, 25, 50. The proposed
interval (AWC) outperforms the others in terms of the
maintain coverage probabilities and the average widths
shorter than those of the other confidence intervals.
3.2. Examples
An example 1: numbers of sparrow nests found in one
hectare area, n = 40 areas of Zar (quoted in Gürtler and
Henze [9]).
No. of nests: 0 1 2 3 4
Frequency: 9 22 6 2 1
The sample mean and variance are 1.1 and 0.8103, re-
spectively. Estimated tail probability is 0.0480. That is,
95% AWC confidence interval of the average sparrow
nests found in one hectare area is between 0.823 and
1.473 and the average width is 0.65.
An example 2: the annual number of serious earth-
quakes over a period of 75 years (1903-1977, quoted in
Blaesild and Granfeldt [10]). An earthquake is consid-
ered serious if its magnitude is at least 7.5 on the Richter
scale or if more than 100 people were killed.
No. of serious earthquakes: 0 1 2 3 4
Frequency: 31 28 14 1 1
The sample mean and variance are 0.84 and 0.7578,
respectively. Therefore, 95% AWC confidence interval
of the average number of serious earthquakes per year is
between 0.6582 and 1.0730 (c = 0.0256 and
ˆ
EW
ˆ
= 0.4148).
4. Concluding Remarks
In the past, the standard method intervals such as the
score interval (SC) and the Wald interval with continuity
correction interval (WCC) based on normal approxima-
tions, are both outperformed for moderate parameter
mean and the sample size should be large enough [2,3,5,
7]. In this paper, the proposed alternative interval based
n estimate tail probability, is called AWC interval. o
Copyright © 2012 SciRes. OJS
M. KHAMKONG
Copyright © 2012 SciRes. OJS
206
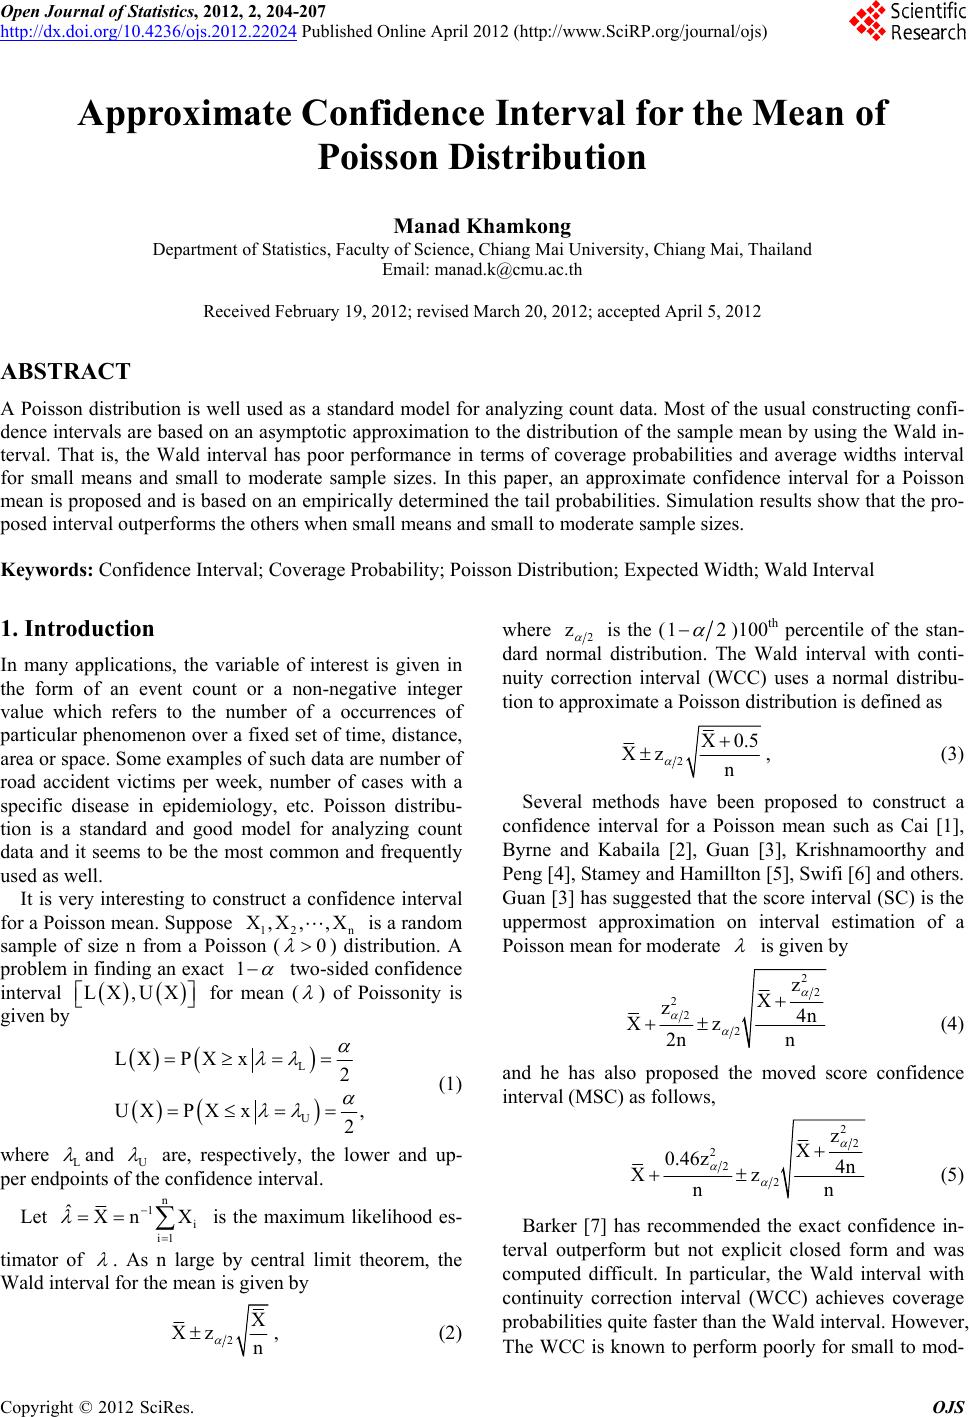
Table 1. Estimated 95% coverage probabilities and average widths for poisson means.
Estimated Coverage Probability Estimated Average Width
n Mean (λ) SC MSC WCC AWC SC MSC WCC AWC
15 1 0.9494 0.9494 0.9801 0.9494 0.9804 0.9804 1.2142 0.9494
1.5 0.9423 0.9423 0.9718 0.9423 1.1844 1.1844 1.3914 1.1594
3 0.9570 0.9570 0.9646 0.9570 1.6898 1.6898 1.8277 1.6719
5 0.9436 0.9512 0.9527 0.9436 2.1442 2.1634 2.2629 2.1305
10 0.9551 0.9510 0.9530 0.9461 3.0635 3.0513 3.1269 3.0247
25 1 0.9437 0.9437 0.9847 0.9437 0.7489 0.7489 0.9451 0.7347
1.5 0.9508 0.9508 0.9734 0.9508 0.9209 0.9209 1.0797 0.9091
3 0.9433 0.9502 0.9640 0.9433 1.2864 1.2968 1.4146 1.2782
5 0.9477 0.9530 0.9612 0.9477 1.6660 1.6761 1.7677 1.6596
10 0.9476 0.9511 0.9534 0.9476 2.3517 2.3611 2.4221 2.3472
50 1 0.9454 0.9535 0.9853 0.9454 0.5275 0.5326 0.6689 0.5224
1.5 0.9450 0.9514 0.9738 0.9450 0.6444 0.6492 0.7637 0.6403
3 0.9554 0.9508 0.9655 0.9459 0.9192 0.9151 1.0012 0.9071
5 0.9473 0.9509 0.9600 0.9473 1.1757 1.1804 1.2482 1.1734
10 0.9490 0.9490 0.9560 0.9490 1.6647 1.6647 1.7173 1.6631
100 1 0.9510 0.9510 0.9861 0.9510 0.3741 0.3741 0.4735 0.3723
1.5 0.9571 0.9522 0.9764 0.9475 0.4603 0.4582 0.5412 0.4543
3 0.9471 0.9506 0.9648 0.9471 0.6438 0.6463 0.7077 0.6428
5 0.9489 0.9489 0.9602 0.9489 0.8324 0.8324 0.8828 0.8316
10 0.9475 0.9491 0.9541 0.9475 1.1750 1.1770 1.2120 1.1744
From the simulation results (Table 1), the estimated 95%
coverage probabilities of AWC close to the nominal level
in all cases and are similar to the SC and MSC interval.
Morever, in many cases of small mean and small to mod-
erate sample sizes such as
= 1, 1.5 and n = 15, 25,
AWC seems to be preferable in the sence that their
average width is shorter than others. However, when the
mean and sample size are both increase, the average
widths AWC interval are similar to other confidence in-
tervals.
Therefore, it can be recommended that the AWC in-
terval is more likely to be outperformed for small mean
Poisson and small to moderate sample sizes. In addition,
the AWC formula is simple and easy to compute. It
should be considered that a sample observation is drawn
from a Poisson distribution.
REFERENCES
[1] T. T. Cai, “One-Sided Confidence Intervals in Discrete
Distributions,” Journal of Statistical Planning and In-
ference, Vol. 131, No. 1, 2005, pp. 63-88.
doi:10.1016/j.jspi.2004.01.005
[2] J. Byrneand and P. Kabaila, “Comparison of Poisson Con
fidence Intervals,” Communications in Statistics-Theory
and Methods, Vol. 34, No. 3, 2005, pp. 545-556.
doi:10.1081/STA-200052109
[3] Y. Guan, “Moved Score Confidence Intervals for Means
of Discrete Distributions,” American Open Journal Sta-
tistics, Vol. 1, 2001, pp. 81-86.
doi:10.4236/ojs.2011.12009
[4] K. Krishnamoorthy and J. Peng, “Improved Closed-Form
Prediction Intervals for Binomial and Poisson Distribu-
tion,” Journal of Statistical Planning and Inference, Vol.
141, No. 5, 2011, pp. 1709-1718.
doi:10.1016/j.jspi.2010.11.021
[5] J. Stamey and C. Hamillton, “A Note on Confidence In-
tervals for a Linear Function of Poisson Rates,” Commu-
nications in Statistics-Theory and Methods, Vol. 35, No.
4, 2005, pp. 849-856. doi:10.1080/03610920802255856
[6] M. B. Swifi, “Comparison of Confidence Intervals for a
Poisson Mean-Further Considerations,” Communications
in Statistics-Theory and Methods, Vol. 38, No. 5, 2009,
pp. 748-759.
[7] L. A. Barker, “Comparison of Nine Confidence Intervals
for a Poisson Parameter When the Expected Number of
Events Is 5,” The American Statistician, Vol. 56, No. 2,
2002, pp. 85-89. doi:10.1198/000313002317572736
[8] R Development Core Team, “R: A Language and En-
vironment for Statistical Computing,” R Foundation for
M. KHAMKONG 207
Statistical Computing, Vienna, 2011.
[9] N. Gurtler and N. Henze, “Recent and Classical Good-
ness-of-Fit Tests for the Poisson Distribution,” Journal of
Statistical Planning and Inference, Vol. 90, No. 2, 2000,
pp. 207-225. doi:10.1016/S0378-3758(00)00114-2
[10] P. Blaesild and J. Granfeldt, “Statistics with Applications
in Biology and Geology,” Chapman & Hall/CRC, New
York, 2003.
Copyright © 2012 SciRes. OJS