 Open Journal of Statistics, 2012, 2, 198-203 http://dx.doi.org/10.4236/ojs.2012.22023 Published Online April 2012 (http://www.SciRP.org/journal/ojs) Asymmetry Index on Marginal Homogeneity for Square Contingency Tables with Ordered Categories Kouji Tahata, Kanau Kawasaki, Sadao Tomizawa Department of Information Sciences, Faculty of Science and Technology, Tokyo University of Science, Chiba, Japan Email: {kouji_tahata, tomizawa}@is.noda.tus.ac.jp, k.kawasaki123@gmail.com Received December 27, 2011; revised January 25, 2012; accepted February 10, 2012 ABSTRACT For square contingency tables with ordered categories, the present paper considers two kinds of weak marginal homo- geneity and gives measures to represent the degree of departure from weak marginal homogeneity. The proposed meas- ures lie between –1 to 1. When the marginal cumulative logistic model or the extended marginal homogeneity model holds, the proposed measures represent the degree of departure from marginal homogeneity. Using these measures, three kinds of unaided distance vision data are analyzed. Keywords: Marginal Homogeneity; Marginal Cumulative Logistic Model; Measure; Square Contingency Table 1. Introduction Consider an square contingency table with or- dered categories. Let ij denote the probability that an observation will fall in the ith row and jth column of the table (;). Also let RRp 1, ,iR1, ,jR and denote the row and column variables, respectively. The marginal homogeneity (MH) model ([1]) is defined by Y XY ii F1, ,1 for iR 1 ik k where i X p 1 i Y ik k , p 1 kkt t 1 R ksk s pp 1 1 1 RXY ii i with R pp, . When the MH model does not hold, we are interested in applying the model that has weaker restriction than the MH model. As such a model, for example, there are the marginal cumulative logistic (ML) model ([2]) and the extended marginal homogeneity (EMH) model ([3-5]). We are also interested in considering the other structure of weak MH. The measures to represent the degree of departure from MH are given by, for example, [6,7]. When the structure of weak MH does not hold, we are interested in measuring what degree the departure from weak MH is. The present paper considers two kinds of structures of weak MH and proposes the measures to represent the degree of departure from weak MH. 2. Weak Marginal Homogeneity I and Measure 2.1. Submeasure I Let F , and * 1 1 X i i F , * 2 1 Y i i F, for . 1, ,1iR 1** 12 11 R ii iFF Note that . Assuming that 0 XY ii FF , consider the submeasure defined by 11 ** 112 1 4π π4 R i ii i FF , where 11 22 sin Y i iXY ii F FF . Noting that 1 0π2 11 11 i, we see that 1) 1 , 2) 0 Y i F0 X F 1, ,1R if and only if and i (i11), and 3) 0 X F if and only if i and (i 0 Y i F1,,1R 1 ). When the MH model holds, equals zero. C opyright © 2012 SciRes. OJS  K. TAHATA ET AL. 199 2.2. Submeasure II Let 1 ii SF XX1 YY SF 1, ,1 XY SS1, , 1 , for iR. ii The MH model may be expressed as ii for iR 1 1 RXY ii i SS . Let 2 1, ,1iR , and for , 21 sin i 22 X i XY ii S SS , * 1 2 i i S X S , * 2 2 Y i i S S 1** 12 1 R ii SS 2 . Note that . Assuming that 1i 0 XY ii SS , we shall define the submeasure as follows; 12 4π 4 R i ii ** 212 1 πi SS . Noting that 2 0π2 i 21 0 X S , we see that 1) 2; 2) if and only if i 11 and (); and 3) if and only if and (i). When the MH model holds, equals zero. 0 Y i S1,i 0 Y i Si S , 1R1 X1, 0 XY FF 0 XY ii SS 2 , 1R 0 2 2.3. Complete Measure Assume that ii and . Con- sider a measure defined by 12 2 11 1 X FX S0 Y F1 Y S 1 . We see that 1) , 2) if and only if i (then ) and (then i 10 i i ) for all , and 3) if and only if 1, ,1iR1 0 X i F (then ) and (then ) for all . Thus, indicates that 1R 1 X i S 1, , 1iR 1 Y i F 0 Y i S 11p and the other cell probabilities are zero (say, upper-right- marginal inhomogeneity), and indicates that 1R and the other cell probabilities are zero (say, lower-left-marginal inhomogeneity). When , we shall refer to this structure as the weak marginal homo- geneity I (WMH-I). We note that if the MH model holds then the structure of WMH-I holds, but the converse does not hold. 1 1 p 0 Therefore, using the measure , we can see whether the structure of WMH-I departs toward the upper-right- marginal inhomogeneity or toward the lower-left-margi- nal inhomogeneity. As the measure approaches –1, the departure from WMH-I becomes greater toward the upper-right-marginal inhomogeneity. While as the approaches 1, it becomes greater toward the lower-left- marginal inhomogeneity. 3. Weak Marginal Homogeneity II and Measure Let 1 Pr i Xc ik k TXiXYp , 1 Pr i Yc ik k TYiXYp 1, ,1iR , , where for 1 c kkkk ppp , 1 c kkkk ppp , t st p XY ii TT1, ,1iR 1 1 . The MH model may be expressed by for . We shall consider the submeasure which is de- replaced X i and fined by the submeasure Y i by X i T and Y i T 1 XX ii UT 1 YY ii UT 1, ,1iR XY ii UU1, ,1iR 2 2 , respectively. Let , for . The MH model may be expressed by for . We shall consider the submeasure which is de- replaced and X i S fined by the submeasure Y i S by X i U and Y i U, respectively. 0 XY TT ii 0 XY ii UU and Assume that . Consider a measure defined by 12 1 2 11 . We see that . Let c pp ij ij j (i ). In a similar way to , 1 1 c p indicates that 1R and the other ij are zero (i c pj ) (say, conditional upper- right-marginal inhomogeneity), and indicates that 1 R 1 1 c p and the other ij are zero () (say, condi- tional lower-left-marginal inhomogeneity). When c pij 0 , we shall refer to this structure as the weak marginal ho- mogeneity II (WMH-II). We note that if the MH model holds then the structure of WMH-II holds, but the con- verse does not hold. Copyright © 2012 SciRes. OJS  K. TAHATA ET AL. Copyright © 2012 SciRes. OJS 200 XY LL 1, ,1 4. Relationships between Measures and Models We shall consider the relationship between the measure (or ) and the ML model. The ML model is given by ii for iR, where log 1 X iX i F F X i L, log 1 Y Yi iY i F LF 0 . A special case of this model obtained by putting is the MH model. The ML model may also be expressed as exp 1exp i X i F i , exp 1exp i Y ii F 1R 0 XY ii , for . Therefore, when the ML model holds, 1, ,i 1) if and only if F0 , 2) if and only if XY ii F Y i , and 3) if and only if 0 X i F 0 0 0 0 0 0 0 0 0 12ii GG . We obtain the following theorem. Theorem 1. When the ML model holds, 1) if and only if (), 2) if and only if (), 3) (i.e., the MH model holds) if and only if (). Next, we shall consider the relationship between the measure (or ) and the EMH model, defined by 1, ,1iR 1 11 iR for , where t isti Gp 2 11 Ri , t isi t Gp 1 . A special case of this model obtained by putting is the MH model. Noting that 12 XY ii ii GG FF 1, ,1R (i 1 ), we obtain the following theorem. Theorem 2. When the EMH model holds, 0 if and only if 1) 0 1 (), if and only if 2) 0 0 1 (), (i.e., the MH model holds) if and only if 3) 00 ( ). Thus, when the ML (EMH) model holds, the measures and are adequate to represent the degree of departure from MH. 5. Approximate Confidence Interval for Measures Let ij denote the observed frequency in the ith row and jth column of the table (;). As- suming that a multinomial distribution applies to the n 1, ,iR1, ,jR RR table, we shall consider an approximate standard error and large-sample confidence interval for the meas- ure , using the delta method, as described by [8]. The sample version of , i.e., , is given by ˆ with ˆij p, where ij p replaced by ˆij ij nn p nn and ij . Using the delta method, we obtain the fol- lowing theorem. Theorem 3. ˆ n n 2ˆ has asymptotically (as ) a normal distribution with mean zero and vari- ance , where 2 2 11 1 ˆ 4 RR ij ijij ij abp , with 11 1 22 1 21 4XY RYX kk ijkk k XY kk Rij FF aIjkIikF IjkF FF 1 1 πk Iik , 12 22 1 2 2 21 4 π XY RYX kk ijkk k XY kkk ij SS bIik IjkIikSIjkS SS 2 , and 1I ˆ p is the indicator function, if true, 0 if not. Also, the sample version of , i.e., , is given by with ij replaced by ˆij p. We obtain the fol- lowing theorem. Theorem 4. ˆ n n 2ˆ has asymptotically (as ) a normal distribution with mean zero and vari- , where ance 2 2 11 1 ˆ 4 RR ij ijij ij ji cd p , with 13 22 1 3 1 1 3 4π π4 1 , XY RXY XYYX kk ijkkkkkk k XY kkk RXY kk k TT cIikTIjkT IikTTIjkTT TT IikTI jkT 1  K. TAHATA ET AL. 201 14 22 1 4 1 2 1 4 4π π4 1 , XY RXY XY kk ijkkkk k XY kkk RXY kk k UU dIik UIjk UIik UUIj UU IikUI jkU YX k k k UU i 1 1 XY ii UU , 1 1 RXY ii TT , 4 R i 3 31 sin Y i i T 22 XY ii TT , 41 sin i22 X i XY ii U UU . Let 2 ˆ denote ˆ 2ˆ with ij p replaced by ˆij p. Then ˆn is estimated approximate ˆ , and ˆ ror for standard er2 ˆˆ ˆ p zn is ap- e 100 1p percent confidence interval for proximat ere, wh2 zfrom ibution co o p. We a les m 7477 women aged 30 to 39 employed in Royal Ordnance factories in Britain from 1943 to 1946. ble 2 that for the data in Table 1(a), the e measure is –0.0130 and all is the percentage point the stan- dardmal distrrresponding to a two-tail proby equal tlso obtain the similar result for measure . nor abilit 6. Examp Example 1: Consider the unaided distance vision data in Table 1(a) taken fro [1]. There are data on unaided distance vision of We see from Ta estimated value of th values in confidence interval for are negative. There- fore, the structure of WMH-I for a woman’s right and left eyes departs toward the upper-right-marginal inhomoge- neity. Also we see from Table 3 that for the data in Ta- ble 1(a), the estimated value of the measure is –0.0436 and all values in confidene interval for c are negative. Therefore, the structure of WMH-II for a woman’s right and left eyes departs toward the condi- tional upper-right-marginal inhomogeneity. Table 4 gives the values of likelihood ratio chi-squared statistic for testing goodness-of-fit of each of MH,L, and EMH models. We see from Table 4 that each of ML and EMH models fits these data well. Thus the measures and would indicate the degree of departure from MH. We can see from these measures that the de M gree of de inhomogeneity which indicates that the grade of right eye for arbitrary woman is “Best” and the grade of her left eye is “Worst”. Example 2: Consider the unaided vision data in Table 1(b), taken from [9]. We see from Table 2 that for the Br m parture from MH for the vision data in Table 1(a) is estimated to be 1.30 (4.36) percent of the maximum departure toward the (conditional) upper-right-marginal Table 1. Unaided distance vision data of (a) 7477 women in itain fro [1]; (b) 3242 men in Britain from [9] and (c) 4746 students in Japan from [3]. (a) Women in Britain Right eye Left eye grade grade (1) (2) (3) (4)Total Best (1) 1520 266 124 66 1976 Second (2) 234 1512 432 78 2256 Third (3) 117 362 1772 2052456 Worst (4) 36 82 179 492789 Total 1907 2222 2507 8417477 (b) Men in Britain Right eye Left eye grade grade (1 1) ) (4) Total Best (821 35 1053 (2) (3) 112 85 Second (116 494 145 27 T72 151 583 87 W43 106 331 791 919 480 3242 2) 782 hird (3) 893 orst (4) Total 1052 34 514 (c) Studeapa Right eye nts in Jn Left eye grade grade (1) (2(4) Total Be 1291130 4 ) (3) st (1) 0 22 1483 Second (149 221 114 T64 124 660 W20 25 249 1429 1524500 1063 2)23 507 hird (3) 185 1033 orst (4)1723 Total 16594746 Table 2. Estimates of , estimated approximate standard errors for ˆ , and for approximate 95% confidence intervals , applied to Table ˆ 1. Table S. E. I. C. 1(a) –0.0130 0037 (–0.0 –0.00.203,056) 1(b) 0.0055 0.0064 (–0.0071, 0.01 0040 (0.00.020 81) 1(c) 0.0125 0.048, 3) Copyright © 2012 SciRes. OJS 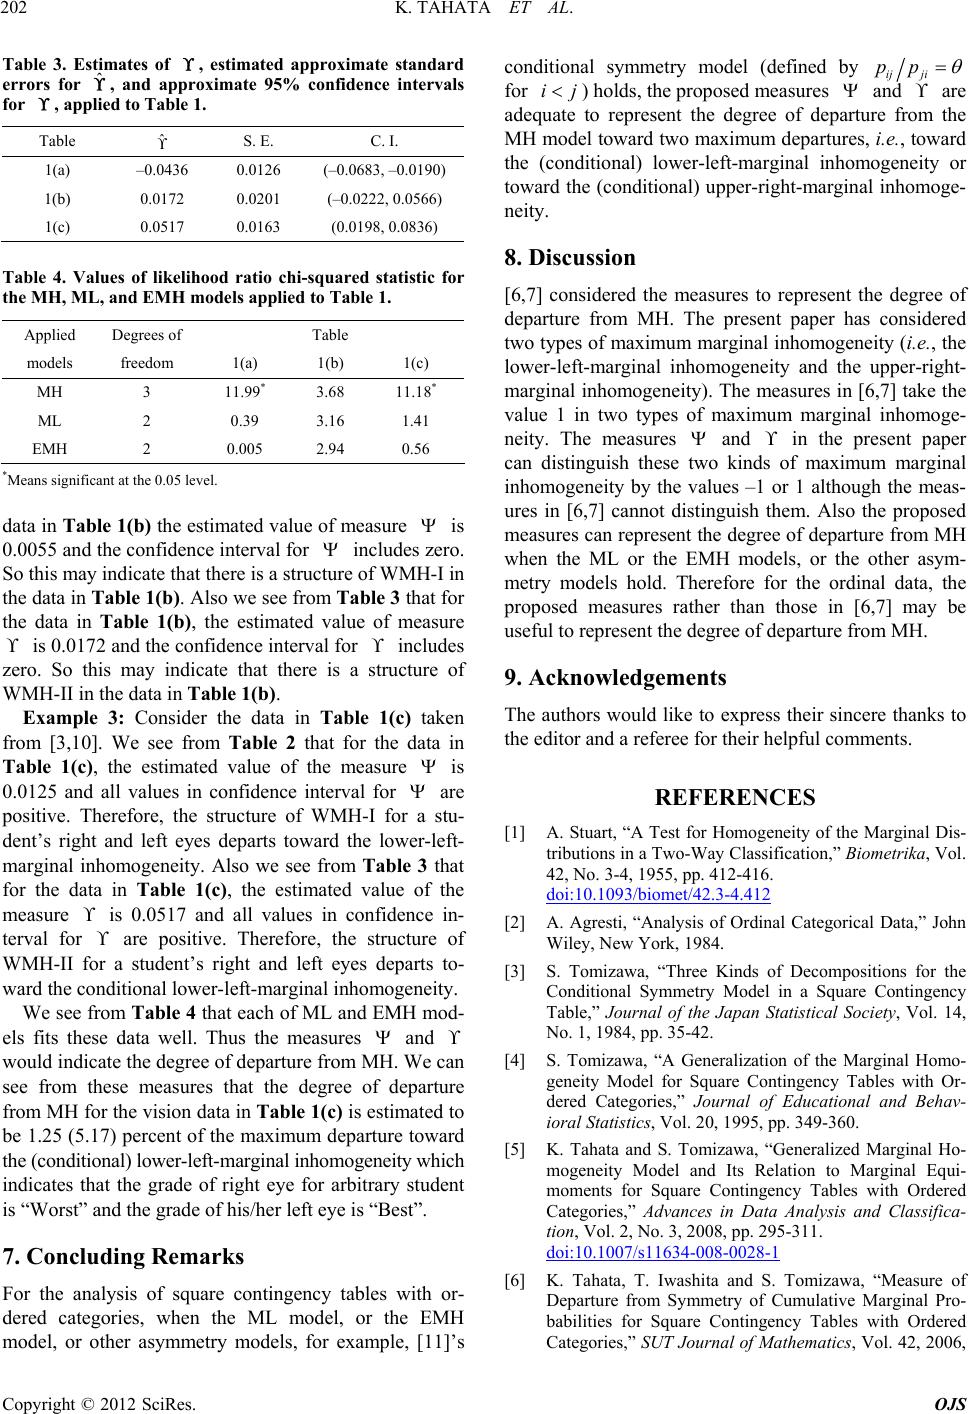 K. TAHATA ET AL. 202 Table 3. Estim p ates of timateprox standard erro ˆ for lie , esd apimate rs fo , ap r , and approximate 95% d to Table confidence intervals 1. Table ˆ S. E. C. I. 1(a) –0.0436 0.0126 (–0.0683, –0.0190) 1(0.0201 (–0.0222, 0.0566) 0.07 3 (0.0198, .0836) b) 0.0172 1(c) 510.0160 Table 4. Values of likelihood i-sq the ML, an modlied t ratio ch els appuared statistic for o Table 1. H, Md EMH Applied Degrees of Table models freedom 1(a) 1(b) 1(c) H 3 M11.99* 3.68 11.18* ML 2 0.39 3.16 .41 E0 2 1 MH 2 .005 .94 0.56 *Meanant at tvel. data in Table 1(b) the estimated value of measure s significhe 0.05 le is H-I in the data in Table 1(b)se Table 3 that for th Table 1(b), estima of measure 72 aor includes zero. So this mindicatthere structure of WMH-II in the data in Tabl ). Ee 3: C nsider tta inle 1(en om [3,10]. We see from that for the data in value of measure 0.0055 and the confidence interval for includes zero. So this may indicate that there is a structure of WM . Also we the nfide e from ted value terval fo e data in is 0.01nd the cnce in ay e that is a e 1(b xampl ohe da Table 2 Tab c) tak fr Table 1(c), the estimated the is 0.0125 and all values in confidence interval for f are positive. Therefore, the structure of WMH-I for a stu- dent’s right and left eyes departs toward the lower-left- marginal inhomogeneity. Also we see from Table 3 that for the data in Table 1(c), the estimated value of the measure is 0.0517 and all values in conidence in- terval for are positive. Therefore, the structure of WMH-II for a student’s right and left eyes departs to- ward the conditional lower-left-marginal inhomogeneity. We see from Table 4 that each of ML and EMH mod- els fits these data well. Thus the measures and would indicate the degree of departure from MH. We can see from these measures that the degree of departure from MH for the vision data in Table 1 (c) is estimated to be 1.25 (5.17) percent of the maximum departure toward the (conditional) lower-left-marginal inhomogeneity which indicates tat the grade of right eye for arbitrary student is “Worst” ad the grade of his/her left eye is “Best”. 7. Concluding Remarks h n Fo t H r the analysis of square contingency tables with or- dered categories, when the ML model, or he EM model, or other asymmetry models, for example, [11]’s conditional symmetry model (defined by ijji pp for ij ) holds, the proposed measures and are adequate to represent the degree of departure from the MH model toward two maximum departures, i.e., toward the (conditional) lower-left-marginal inhomogeneity or toward the (conditional) upper-right-marginal inhomoge- neity. ity (i.e., the r-lefhe-r 8. Discussion [6,7] considered the measures to represent the degree of departure from MH. The present paper has considered two types of maximum marginal inhomogene lowet-marginal inhomogeneity and t upperight- marginal inhomogeneity). The measures in [6,7] take the value 1 in two types of maximum marginal inhomoge- neity. The measures and in the present paper can distinguish these two kinds of maximum marginal inhomogeneity by the values –1 or 1 although the meas- ures in [6,7] cannot distinguish them. Also the proposed esent the degree of departure from MH toss measures can repr when the ML or the EMH models, or the other asym- metry models hold. Therefore for the ordinal data, the proposed measures rather than those in [6,7] may be useful to represent the degree of departure from MH. 9. Acknowledgements The authors would like expre their sincere thanks to the editor and a referee for their helpful comments. REFERENCES [1] A. Stuart, “A Test for Homogeneity of the Marginal Dis- tributions in a Two-Way Classification,” Biometrika, Vol. 42, No. 3-4, 1955, pp. 412-416. doi:10.1093/biomet/42.3-4.412 [2] A. Agresti, “Analysis of Ordinal Categorical Data,” John ds of Decompositions for the [4] S. Tomizawa,e Marginal Homo- geneity Modey Tables with Or- tion to Marginal Equi- pp. 295-311. Wiley, New York, 1984. [3] S. Tomizawa, “Three Kin Conditional Symmetry Model in a Square Contingency Table,” Journal of the Japan Statistical Society, Vol. 14, No. 1, 1984, pp. 35-42. “A Generalization of th l for Square Contingenc dered Categories,” Journal of Educational and Behav- ioral Statistics, Vol. 20, 1995, pp. 349-360. [5] K. Tahata and S. Tomizawa, “Generalized Marginal Ho- mogeneity Model and Its Rela moments for Square Contingency Tables with Ordered Categories,” Advances in Data Analysis and Classifica- tion, Vol. 2, No. 3, 2008, doi:10.1007/s11634-008-0028-1 [6] K. Tahata, T. Iwashita and S. Tomizawa, “Measure of Departure from Symmetry of Cumulative Marginal Pro- babilities for Square Contingency Tables with Ordered Categories,” SUT Journal of Mathematics, Vol. 42, 2006, Copyright © 2012 SciRes. OJS  K. TAHATA ET AL. Copyright © 2012 SciRes. OJS 203 y for pp. 7-29. [7] K. Tahata, T. Iwashita and S. Tomizawa, “Measure of Departure from Conditional Marginal Homogeneit Square Contingency Tables with Ordered Categories,” Statistics, Vol. 42, No. 5, 2008, pp. 453-466. doi:10.1080/02331880802190521 [8] Y. M. M. Bishop, S. E. Fienberg and P. W. Holland, “Discrete Multivariate Analysis: Theor The MIT Press, Cambridge, 1975 y and Pract . /2333101 ice,” [9] A. Stuart, “The Estimation and Comparison of Strengths of Association in Contingency Tables,” Biometrika, Vol. 40, 1953, pp. 105-110. doi:10.2307 etry,” Quantum Prob- els for the [10] K. Yamamoto, K. Tahata, N. Miyamoto and S. Tomizawa, “Comparison between Several Square Tables Data Using Models of Symmetry and Asymm ability and White Noise Analysis: Quantum Bio-Infor- matics, Vol. 21, 2007, pp. 337-349. [11] P. McCullagh, “A Class of Parametric Mod Analysis of Square Contingency Tables with Ordered Categories,” Biometrika, Vol. 65, No. 2, 1978, pp. 413- 418. doi:10.1093/biomet/65.2.413
|