Paper Menu >>
Journal Menu >>
 Journal of Transportation Technologies, 2012, 2, 165-174 http://dx.doi.org/10.4236/jtts.2012.22018 Published Online April 2012 (http://www.SciRP.org/journal/jtts) Contribution of Rural Roads to Access to- and Participation in Markets: Theory and Results from Northern Ethiopia Torbjørn Arethun, Bharat P. Bhatta Sogn og Fjordane University College, Sogndal, Norway Email: torbjorn.arethun@hisf.no Received January 20, 2012; revised February 17, 2012; accepted March 14, 2012 ABSTRACT Road accessibility is considered to be one of the major factors influencing (or correlated to) rural households’ access to- and participation in markets. However, there are few studies that investigate this important topic. This paper, therefore, explores the issue from both theoretical and practical perspectives with household and village level data from Northern Ethiopia. It is generally assumed that road accessibility significantly contributes to both access to- and participation in markets by rural households. The results in this study, however, suggest that neither participation in major markets nor the amount of purchased agricultural inputs use are significantly different for households with respect to the degree of road accessibility in the study area. Nevertheless, the situation seems somewhat better in locations with good access to roads. On the other hand, the results in this study confirm that road accessibility significantly contributes to reducing farm gate prices of manufactured goods and increasing farm gate prices of agricultural goods. Keywords: Road Accessibility; Access to- and Participation in Markets; Rural Households; Northern Ethiopia 1. Introduction Governments of developing countries, multilateral or- ganizations such as the World Bank, the Asian Devel- opment Bank (ADB) and the International Fund for Ag- ricultural Development (IFAD) emphasize the role of rural transport to increase access to- and participation in markets because markets contribute to division of labor and product specialization. According to Rural Poverty Report 2001 of IFAD [1] “Distance to markets and the lack of roads is a central concern for rural communities throughout the developing world. The rural poor need access to competitive markets not just for their products but also for inputs, assets and technology, consumer goods, credit and labor.” The poor and remote communi- ties get larger benefits from a new road in several ways. On the one hand, road construction and maintenance might give employment opportunities for the local people; while on the other hand improved transport reduces the physical costs of access to resources and markets. Gov- ernments and donors, therefore, favor building new roads which allow easier transportation of all products from the rural and remote poor to ports and markets within and beyond country frontiers. The Asian Development Bank [2] postulates that road accessibility provides access to markets, integrates mar- kets in different areas, mitigates the risks to which the poor are often more exposed and improves social welfare due to the increased accessibility to basic social services. Providing extensive road access to markets would confer substantial benefits, much of these going to poor house- holds on average [3]. It enables them to make better use of essential services such as health and education and keep abreast of social, economic and political develop- ments happening in their country [1]. Moreover, im- proved market situation reduces the width of price bands [4] and many people find themselves advantageous to participate in markets. Ultimately, it may encourage producing more for markets. Ethiopia has the lowest road density in the world, which is even far below the average African standards. Ethiopia has the total length of classified road network of about 28,000 km which is equivalent to road density of 4.2 km per 10,000 people and 23 km per 1000 square km of area [5]. It seems that the current state of the road network is an obstacle to economic growth and devel- opment in Ethiopia. Taking this into consideration, the Ethiopian government has emphasized development of road transportation since the 1990s. Consequently the road network has increased in the country. In Tigray, in particular, walking time to the nearest all weather road has decreased from 200 minutes in 1991 to 150 minutes C opyright © 2012 SciRes. JTTs  T. ARETHUN, B. P. BHATTA 166 in 1998. The roads joining Adwa and Abi Adi with Mekelle, the capital city of Tigray, Adi Awala with Inda, Humera and Shiraro with Birkuta are examples of roads constructed in the late 1990s. In addition, other roads have existed for a long time in Tigray. In this context, this study, therefore, investigates rural households’ access to- and participation in markets in re- lation to road accessibility in both theory and practice with household and village level data from Northern Ethiopia. We have organized the remainder of the paper as follows. We discuss theory and literature review rele- vant to the issue in Section 2. We explain data and model in Section 3. We present results and discuss them in Sec- tion 4. We conclude the paper in Section 5. 2. Theory and Literature Review In this section, we review the literature relevant to the study in this paper. We divide the relevant literature into three categories, namely, general theoretical framework, household model and empirical evidence. 2.1. General Theoretical Framework Provision or improvement of transport services results in reduction of transport cost and/or travel time which in turn lead to increased production. Improved transport, therefore, promotes social and economic development by increasing mobility and improving physical access to resources and markets [1]. Fromm [6], World Bank [7] and SACTRA [8] treat transport as one of the factors of production. As transport cost decreases, the factor prices fall resulting in increased demand for input use or more output supply according to microeconomic theory [9,10]. Bhalla [11] has a similar argument. He goes ahead by saying that the marginal cost decreases as a result of im- proved transportation. Local farmers can benefit from a road when the road reduces the cost of transporting agri- cultural products to markets and extends the distance to breakeven locations. This might lead to more intensive cultivation and increased production of cash crops. Road transport can further reduce production costs by lowering prices of delivered inputs, including equipment and in- formation (for example, through better agricultural ex- tension services). The ultimate effect is increased net farm gate prices and increased farm incomes although the extent to which this happens depends on the competi- tiveness of the transport service market. All weather ac- cess to road not only increases income from farming ac- tivities, but also makes prices more stable and thus en- ables the poor to improve risk management and reduce risk. Better access to roads will also improve labor force mobility and thereby increase households’ job opportuni- ties. As the cost of transport declines, the production cost falls which may result in increased production. Similarly when travel time is saved, more labor is available for production, which is equivalent to an increase in labor supply, resulting in increased production. So the overall activities expand with the provision of transport services. Investment in the transport sector can improve access to economic opportunities by reducing transport costs and travel time. If markets are reasonably competitive, this can result in lower prices for freight and passenger ser- vices. This in turn can lead to lower prices for product and consumer goods, a spatial extension of the market for production and consumption goods, higher personal mobility, and a general higher level of socioeconomic activities [12]. The provision or improvement of trans- port services reduces the transport cost of goods, which results in increase in farmgate prices of agricultural products while decrease in the farmgate prices of agri- cultural inputs and other consumer goods. The width of price band reduces due the improved transportation ser- vices [4] so the rural people can get double benefits. 2.2. The Household Model As households simultaneously take decisions regarding investment, production, consumption, and inputs use, a household perspective is the most appropriate to investi- gate the factors influencing (or correlated to) rural households’ participation in markets. Since a typical household in resource poor rural economies normally faces time, production, cash, and budget constraints, the household model must take those constraints into account [4]. Our study area, Tigray, is not an exception. We therefore assume that a representative household in the study area maximizes utility1 subject to the following constrains: max ,, aml UX XX subject to 1) Production constraint: ,, j QQLXA 2) Time constraint: l TFX 3) Cash constraint: ff PXw FLR 4) Budget constraint: mmaaff PXPQXPXwFLR where a X = Household’s consumption of own agricul- ture commodity, m X = Household’s consumption of market-purchased goods, l X = Minimum time neces- sary for household and social activities, leisure and so on, Q = Quantity of agricultural commodity produced by the household, Xf = Households’ use of fertilizer, L = Total 1It is assumed that a rural household derives utility by consuming agricultural goods, market-purchased goods and leisure. Copyright © 2012 SciRes. JTTs  T. ARETHUN, B. P. BHATTA 167 amount of time spent on its own farm, A = Fixed land area, = Price of market-purchased goods, w = wage rate, a = Price of agricultural commodity, m P P f P = Price of fertilizer, T = Total time of the household, F = Time available for work after allocating the minimum neces- sary time for household and social activities, leisure and so on, and R = Total cash (in fixed amount) available for the household from its own savings, remittances and so on. Combining the constraints (1), (2) and (4) to get a full budget constraint: ,, or mm PX PX , , 0 ,, ,, aaafff l afff mm aal aml aff mm aal lff PXPQLXAPX wT XLR PQLXAPXwTwLR PXwX f Z UX XXPQLXAX wLRPXP XwX RwT XLPX P wT Setting Lagrange function to maximize household util- ity subject to the full budget constraint and credit con- straint: U,, ,, aml afff mm aal lff Z XX XPQLX AX wTwLRPXP XwX RwTXL PX P Differentiating the Lagrangian function with respect to labor (L) and setting the equation equal to zero gives the first order condition of household utility maximization as follows: 0 1 aL aL LL L PQ w wPQw PwMVP w w or, Z L MV MVP where MVPL denotes marginal value product of labor in their own farms. The above relation clearly shows that the household wage rate deviates from market wage rate if the household faces a binding cash constraint (i.e., µ > 0). As a result, the household cannot get rid of shadow wage rate. As long as the cash constraint is binding (i.e., µ ≠ 0), household shadow wage rate is higher than the market wage rate making the household not beneficial to participate in a labor market. It is the shadow wage rate which decides whether a household would participate or not in a labor market. The same is true with rural house- holds’ participation in other markets such as fertilizer markets. If the shadow wage rate lies within “price band”, the household becomes self-sufficient and will not par- ticipate in a market [4]. In contrast, the household will participate in a market if the shadow wage rate lies above the price band. The relation has an important policy im- plication that it is the cash constraint that obstructs rural households in entering into a market of off-farm wage activities. It is necessary to remove the cash constraint of rural households in developing countries so that the rural poor will participate in markets and less dependent on subsistent farming resulting in less land degradation. As can be seen above, market participation by a rural household depends on the width of the price band and the value of shadow wage rate. The width of the price band depends on transaction costs, shallow markets, price risk and risk aversion. Shadow wage rate is determined in- ternally at the household which depends on household characteristics and household specific indicators of the market, resource endowments of the household, and so on. The improvement of access to road and transport ser- vices will increase households’ welfare through four dif- ferent channels: Less time is needed to be spent on commuting and more time can be spent on leisure activities and by working on their own farm. Better roads will reduce travel time between home and work for any travel mode, also walking, and it may open some regions for new and faster travel modes. A road improvement could make it profitable for a bus company to start service between a village and a town. Households living in that village will then substitute travel mode from bicycle or walking to bus and thereby reduce their time spent on commuting. In many households in developing countries, the house- holds’ head live and work apart from the rest of the fam- ily for days or weeks and improved access to road could increase the probability of getting a job close to home. The reduction in time spent on commuting could either be spent on leisure activities or working on their own farm or both. In either case, this will increase house- holds’ welfare. More time can be spent on job when commuting time is reduced. This will increase the households’ income. If a household member can reduce his time spent on com- muting by one hour a day, and he wants to spend this time savings on his paid job, he can increase his working hours by 10% if the normal working time is 10 hours a day. More people will be able to find a job because an ex- tended local labor market will enhance labor mobility and increase job opportunities. As mentioned earlier, better access to road and transport services will reduce time spent on commuting and thereby widen both the household’s access to jobs and firms’ access to labor. There is an upper limit regarding maximum amount of Copyright © 2012 SciRes. JTTs  T. ARETHUN, B. P. BHATTA 168 time an individual is willing to spend on commuting on a daily basis. If he has to spend more time than this upper limit, he will choose not to commute. If road improve- ments or better transport services bring his time spent on commuting to the nearest city below his upper time limit, then he will choose to commute. In addition; this exten- sion of the labor market will also affect city businesses. The labor supply will increase and the firms in a city can be more capable of finding persons with skills matching their vacancies. Easier access to markets for inputs, goods and services will narrow the households’ price band and thereby in- crease their welfare. Road improvements and better transport services will reduce transportation costs of bringing farm products to the market and a larger market will increase the prices and farmers’ revenue. House- holds will also have better access to input markets and an increased supply of inputs leads to a price reduction. An increased market for a household’s output and input gives higher prices for their output and lower prices for their input. Road improvements and better transport ser- vices will reduce time and cost of transporting goods, services and inputs. Instead of travelling to the nearest city to sell their farm products or buy their farm inputs, goods, services and inputs can be provided at better prices at the gate. In addition to a narrower price band, this will also save time spent on traveling to a market. 2.3. Empirical Evidence There are some empirical studies available about the re- lationship between rural roads and access to- and par- ticipation in markets [3,13-16]. Reviews and findings of some of the studies are presented below. Operations Evaluation Department of the World Bank [13] examined the socioeconomic influence of improve- ment of rural roads (Fourth Highway Project) in Mo- rocco. The study found that there were elimination of frequent road closures during rainy seasons, reduction in vehicle operating costs leading to lower prices for freight and passenger services, and increased traffic volume, ownership of motorized vehicles, access to market and social services, and improvement in passenger services. In addition, they found higher outputs, changes in the agricultural output mix, increased use of modern inputs specially fertilizers, improved agricultural extension ser- vices, increased amount of higher value crops such as fruits and vegetables, marked growth in off-farm em- ployment opportunities, improved access to education and health facilities and increased rural/urban interaction due to the improved travel facilities. Lucas, Rutachokozibwa and Tagora [14] carried out an impact evaluation of the Njombe-Makete Road Project in Tanzania. The project undertook improvements of feeder roads, bridge construction, and rural road routine and spot maintenance. The impact study found an increased participation of vendors at local markets and an increased variety of available consumer goods and agricultural products. The geographic size of markets for agricultural products increased significantly. There were significant increases in the sale of all types of agricultural products as well as increased availability of agricultural inputs. A household and village-level survey conducted by IFPRI in Bangladesh provides some evidence of the im- pact of transport infrastructure on various facets of the rural economy [15]. The sampling method controlled for differences in observed natural endowments to focus on the effects of infrastructure development (of roads in particular) on several components of the rural economy. Villages were grouped according to an “infrastructure index”, an index which measured the degree of physical access to various markets and services. Villages with good infrastructure services showed a significantly im- proved situation in terms of agricultural production, in- comes, labor demand and health compared to the villages with poor infrastructure services. Infrastructure was found to affect agricultural production through improved prices, diffusion of technology and use of inputs. It was also found to increase income both from crop production, and by providing alternative employment; the income benefits were significant even for landless laborers. The study also looked at impacts on saving and investment behavior in the two groups of villages and concluded that infrastructure may encourage private saving and invest- ment indirectly through its positive effect on income. It should be noted, however, that there may be factors affecting the productivity of the village which were not controlled for, such as unobserved differences in their natural endowments. The composite infrastructure index constructed to compare the villages does not permit separate examination of the effects of particular types of infrastructure on development outcomes. The index does not measure actual access to services, the extent to which the services are used, or their quality. A village and household transport survey conducted in 1997 for 40 sampled villages in Andhra Pradesh, India, provides strong empirical evidence that rural roads con- tribute to market access and participation [16]. The sur- vey results of ten households randomly selected for the household level survey from each sampled village indi- cate that poor road condition, seasonal road closure, lack of motorized access, and the high cost of freight delivery were among the problems of village accessibility in the unconnected villages. Moreover, road closure during the rainy season caused product spoilage, delay of freight delivery, labor unemployment, and so forth. When asked what impacts were expected from the improvement of roads, most households in villages both connected and unconnected with all-weather roads responded with pre- Copyright © 2012 SciRes. JTTs 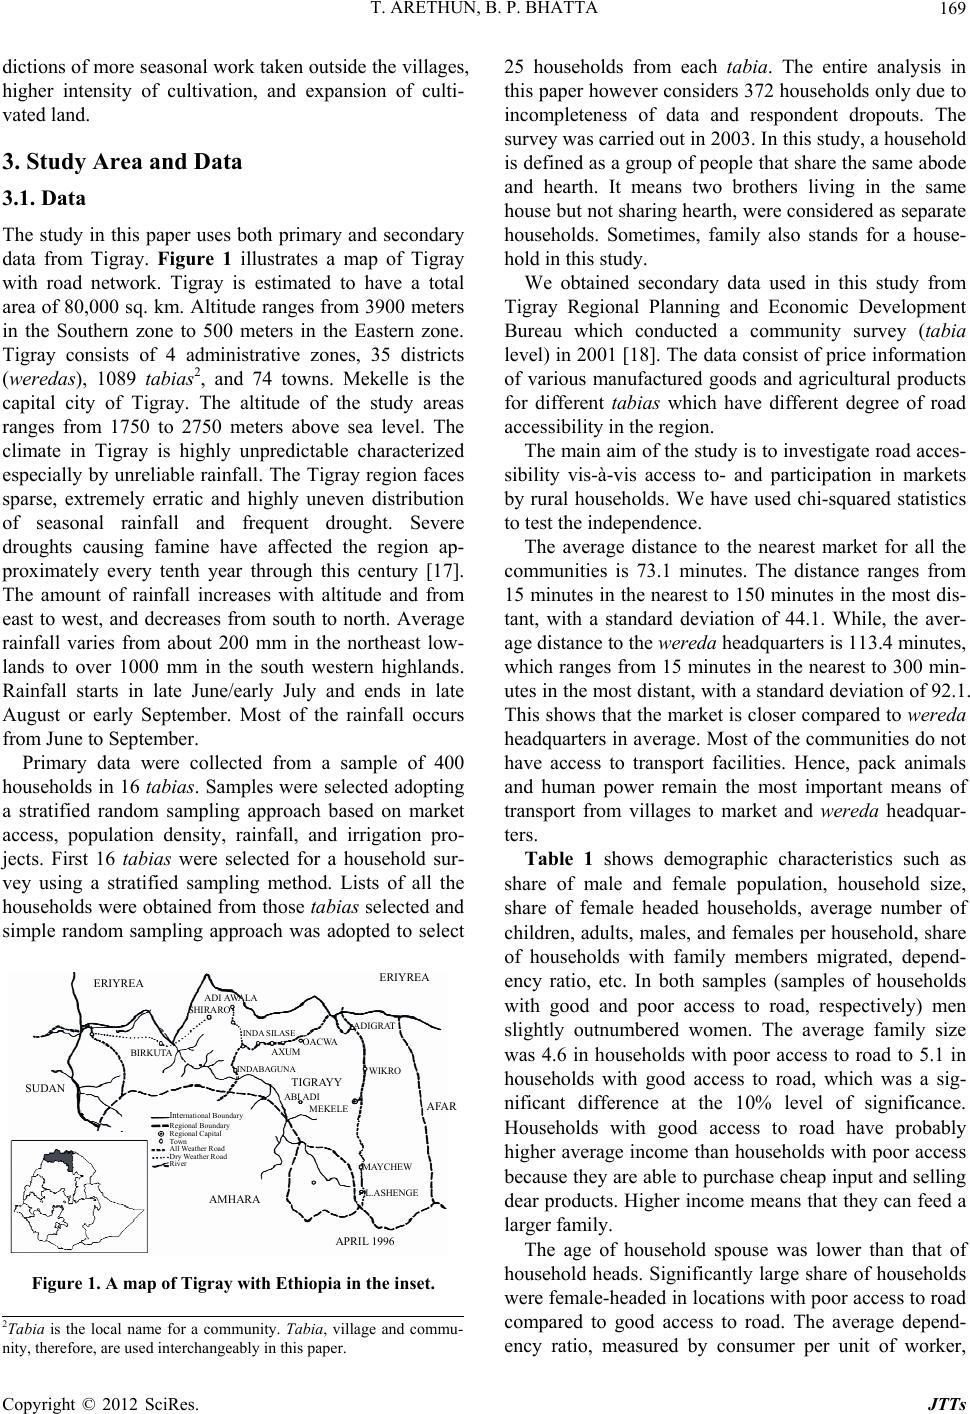 T. ARETHUN, B. P. BHATTA 169 dictions of more seasonal work taken outside the villages, higher intensity of cultivation, and expansion of culti- vated land. 3. Study Area and Data 3.1. Data The study in this paper uses both primary and secondary data from Tigray. Figure 1 illustrates a map of Tigray with road network. Tigray is estimated to have a total area of 80,000 sq. km. Altitude ranges from 3900 meters in the Southern zone to 500 meters in the Eastern zone. Tigray consists of 4 administrative zones, 35 districts (weredas), 1089 tabias2, and 74 towns. Mekelle is the capital city of Tigray. The altitude of the study areas ranges from 1750 to 2750 meters above sea level. The climate in Tigray is highly unpredictable characterized especially by unreliable rainfall. The Tigray region faces sparse, extremely erratic and highly uneven distribution of seasonal rainfall and frequent drought. Severe droughts causing famine have affected the region ap- proximately every tenth year through this century [17]. The amount of rainfall increases with altitude and from east to west, and decreases from south to north. Average rainfall varies from about 200 mm in the northeast low- lands to over 1000 mm in the south western highlands. Rainfall starts in late June/early July and ends in late August or early September. Most of the rainfall occurs from June to September. Primary data were collected from a sample of 400 households in 16 tabias. Samples were selected adopting a stratified random sampling approach based on market access, population density, rainfall, and irrigation pro- jects. First 16 tabias were selected for a household sur- vey using a stratified sampling method. Lists of all the households were obtained from those tabias selected and simple random sampling approach was adopted to select ERIYREA SUDAN ADI AWALA ERIYREA AMHARA TIGRAYY SHIRARO BIRKUTA OACWA AXUM INDA SILASE INDABAGUNA ABI ADI MEKELE MAYCHEW L.ASHENGE WIKRO APRIL 1996 AFAR ADIGRAT Inte rnational Boundar y Regional Boundary Regional Capital Town All Weather Road Dry Weather Road River Figure 1. A map of Tigray with Ethiopia in the inset. 25 households from each tabia. The entire analysis in this paper however considers 372 households only due to incompleteness of data and respondent dropouts. The survey was carried out in 2003. In this study, a household is defined as a group of people that share the same abode and hearth. It means two brothers living in the same house but not sharing hearth, were considered as separate households. Sometimes, family also stands for a house- hold in this study. We obtained secondary data used in this study from Tigray Regional Planning and Economic Development Bureau which conducted a community survey (tabia level) in 2001 [18]. The data consist of price information of various manufactured goods and agricultural products for different tabias which have different degree of road accessibility in the region. The main aim of the study is to investigate road acces- sibility vis-à-vis access to- and participation in markets by rural households. We have used chi-squared statistics to test the independence. The average distance to the nearest market for all the communities is 73.1 minutes. The distance ranges from 15 minutes in the nearest to 150 minutes in the most dis- tant, with a standard deviation of 44.1. While, the aver- age distance to the wereda headquarters is 113.4 minutes, which ranges from 15 minutes in the nearest to 300 min- utes in the most distant, with a standard deviation of 92.1. This shows that the market is closer compared to wereda headquarters in average. Most of the communities do not have access to transport facilities. Hence, pack animals and human power remain the most important means of transport from villages to market and wereda headquar- ters. Table 1 shows demographic characteristics such as share of male and female population, household size, share of female headed households, average number of children, adults, males, and females per household, share of households with family members migrated, depend- ency ratio, etc. In both samples (samples of households with good and poor access to road, respectively) men slightly outnumbered women. The average family size was 4.6 in households with poor access to road to 5.1 in households with good access to road, which was a sig- nificant difference at the 10% level of significance. Households with good access to road have probably higher average income than households with poor access because they are able to purchase cheap input and selling dear products. Higher income means that they can feed a larger family. The age of household spouse was lower than that of household heads. Significantly large share of households were female-headed in locations with poor access to road compared to good access to road. The average depend- ency ratio, measured by consumer per unit of worker, 2Tabia is the local name for a community. Tabia, village and commu- nity, therefore, are used interchangeably in this paper. Copyright © 2012 SciRes. JTTs 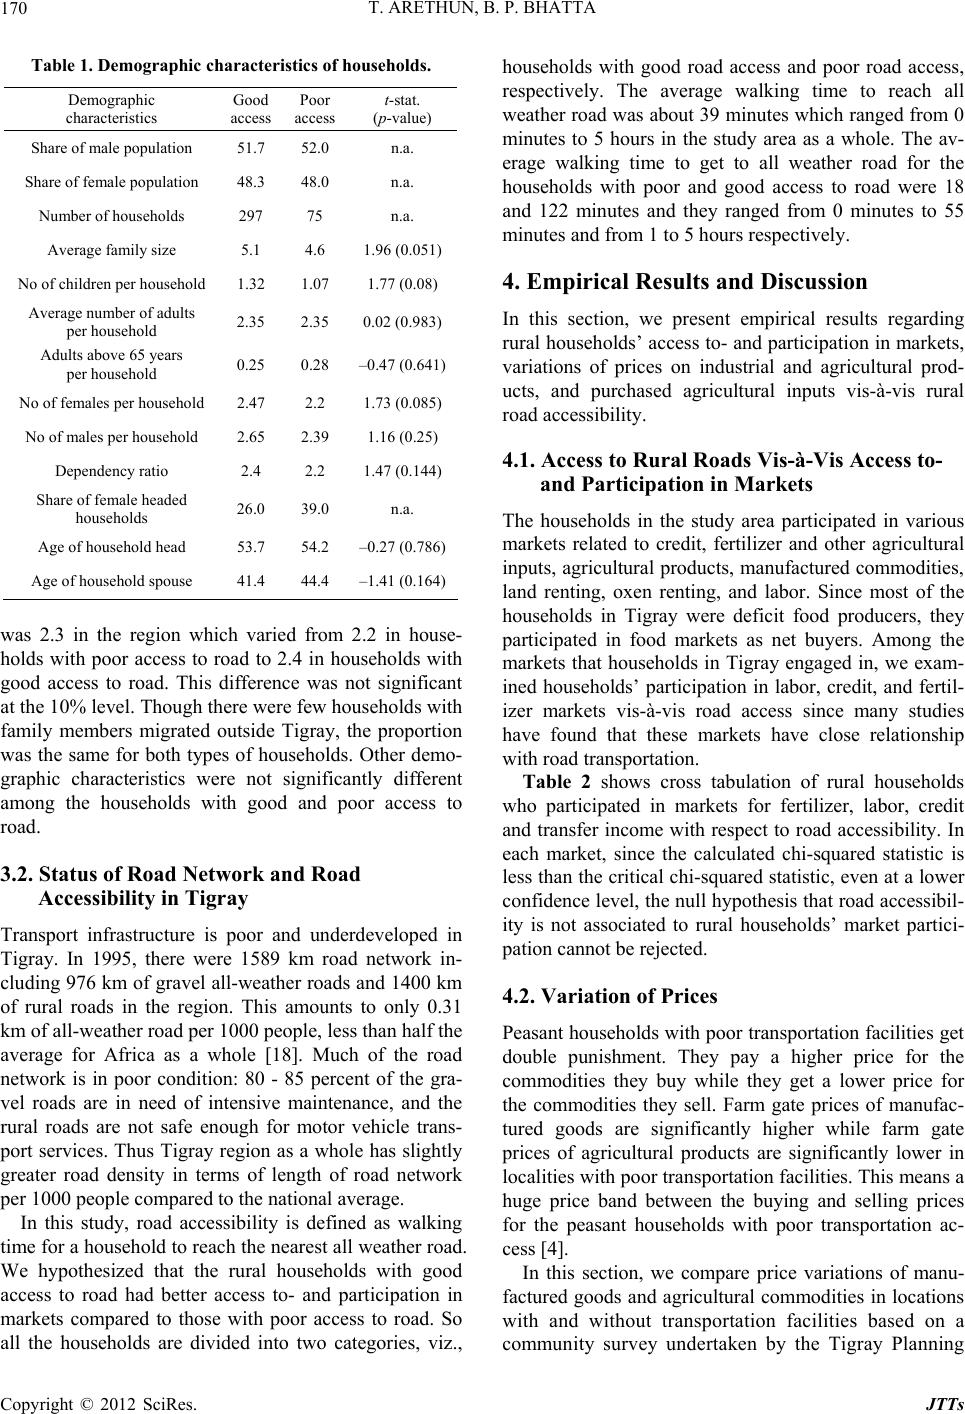 T. ARETHUN, B. P. BHATTA 170 Table 1. Demographic character istics of households. Demographic characteristics Good access Poor access t-stat. (p-value) Share of male population 51.7 52.0 n.a. Share of female population 48.3 48.0 n.a. Number of households 297 75 n.a. Average family size 5.1 4.6 1.96 (0.051) No of children per household 1.32 1.07 1.77 (0.08) Average number of adults per household 2.35 2.35 0.02 (0.983) Adults above 65 years per household 0.25 0.28 –0.47 (0.641) No of females per household 2.47 2.2 1.73 (0.085) No of males per household 2.65 2.39 1.16 (0.25) Dependency ratio 2.4 2.2 1.47 (0.144) Share of female headed households 26.0 39.0 n.a. Age of household head 53.7 54.2 –0.27 (0.786) Age of household spouse 41.4 44.4 –1.41 (0.164) was 2.3 in the region which varied from 2.2 in house- holds with poor access to road to 2.4 in households with good access to road. This difference was not significant at the 10% level. Though there were few households with family members migrated outside Tigray, the proportion was the same for both types of households. Other demo- graphic characteristics were not significantly different among the households with good and poor access to road. 3.2. Status of Road Network and Road Accessibility in Tigray Transport infrastructure is poor and underdeveloped in Tigray. In 1995, there were 1589 km road network in- cluding 976 km of gravel all-weather roads and 1400 km of rural roads in the region. This amounts to only 0.31 km of all-weather road per 1000 people, less than half the average for Africa as a whole [18]. Much of the road network is in poor condition: 80 - 85 percent of the gra- vel roads are in need of intensive maintenance, and the rural roads are not safe enough for motor vehicle trans- port services. Thus Tigray region as a whole has slightly greater road density in terms of length of road network per 1000 people compared to the national average. In this study, road accessibility is defined as walking time for a household to reach the nearest all weather road. We hypothesized that the rural households with good access to road had better access to- and participation in markets compared to those with poor access to road. So all the households are divided into two categories, viz., households with good road access and poor road access, respectively. The average walking time to reach all weather road was about 39 minutes which ranged from 0 minutes to 5 hours in the study area as a whole. The av- erage walking time to get to all weather road for the households with poor and good access to road were 18 and 122 minutes and they ranged from 0 minutes to 55 minutes and from 1 to 5 hours respectively. 4. Empirical Results and Discussion In this section, we present empirical results regarding rural households’ access to- and participation in markets, variations of prices on industrial and agricultural prod- ucts, and purchased agricultural inputs vis-à-vis rural road accessibility. 4.1. Access to Rural Roads Vis-à-Vis Access to- and Participation in Markets The households in the study area participated in various markets related to credit, fertilizer and other agricultural inputs, agricultural products, manufactured commodities, land renting, oxen renting, and labor. Since most of the households in Tigray were deficit food producers, they participated in food markets as net buyers. Among the markets that households in Tigray engaged in, we exam- ined households’ participation in labor, credit, and fertil- izer markets vis-à-vis road access since many studies have found that these markets have close relationship with road transportation. Table 2 shows cross tabulation of rural households who participated in markets for fertilizer, labor, credit and transfer income with respect to road accessibility. In each market, since the calculated chi-squared statistic is less than the critical chi-squared statistic, even at a lower confidence level, the null hypothesis that road accessibil- ity is not associated to rural households’ market partici- pation cannot be rejected. 4.2. Variation of Prices Peasant households with poor transportation facilities get double punishment. They pay a higher price for the commodities they buy while they get a lower price for the commodities they sell. Farm gate prices of manufac- tured goods are significantly higher while farm gate prices of agricultural products are significantly lower in localities with poor transportation facilities. This means a huge price band between the buying and selling prices for the peasant households with poor transportation ac- cess [4]. In this section, we compare price variations of manu- factured goods and agricultural commodities in locations with and without transportation facilities based on a community survey undertaken by the Tigray Planning Copyright © 2012 SciRes. JTTs  T. ARETHUN, B. P. BHATTA 171 Table 2. Rural households’ access to- and participation in major markets. Good access to a road Chi-squared statistic and inference Types of markets Yes No Total Yes 205 47 251 No 92 29 121 Participation in fertilizer markets Total 297 75 372 χ2 = 1.42 χ20.90,1 = 2.71 χ20.90,1 = 2.71 > 1.11 HO: not rejected Yes 178 41 219 No 119 34 153 Participation in labor markets Total 297 75 372 χ2 = 0.69 χ20.90,1 = 2.71 χ20.90,1 = 2.71 > 0.69 HO: not rejected Yes 122 29 151 No 175 46 221 Participation in credit markets Total 297 75 372 χ2 = 0.14 χ20.90,1 = 2.71 χ20.90,1 = 2.71 > 0.14 HO: not rejected Yes 205 45 250 No 92 30 122 Having transfer income Total 297 75 372 χ2 = 2.21 χ20.90,1 = 2.71 χ20.90,1 = 2.71 > 2.21 HO: not rejected Bureau (see Appendix). We examined the prices of manufactured commodities like battery, sugar and soap and agricultural commodities like teff, wheat, barley, and millet for households with good vs poor access to a road. The analyses below show the significant price variation on these commodities. We compared two market areas located in two differ- ent places with and without road network in different weredas. First we take the example of Adigudom and Debub with good and poor road access respectively in Hintalo wereda. The physical distance between Adigu- dom and Debub was 30 km. The price of one piece of soap in Adigudom was one birr while in Debub it was 1.5 birr. The price of one piece of soap is 50 percent higher in Debub compared to Adigudom. Sugar costs 5.5 and 8 birr per kg in Adigudom and Debub respectively. This is a big variation. On the other hand, there are small price differences of cigarettes, batteries and matches. This is because they are low weight items and cost of transporting them is low compared to the above men- tioned heavy weight items. Contrary to the industrial goods, prices of agricultural products were relatively cheaper in Debub compared to Adigudom. For example, price of red teff was cheaper by 37.5 birr per quintal in Debub compared to Adigudom. If Adigudom-Debub road were built properly, the peasants would be able to sell their agricultural products at rela- tively higher prices. On the other hand, they could get the industrial goods at cheaper prices. If we take another example of Maytsebre and Feyal- weha with more or less similar road accessibility located in Tselant wereda. There was a small price variation in these places compared to the places mentioned above. This shows that the availability of a road highly influ- ences price variations. There were high variations in prices of agricultural products in market places of Abiabi and Guya. For in- stance, the price of red Teff was 165 birr per quintal in Guya, while it was 180 birr in Abiadi. If there were a road connecting Guya with Abiadi, peasants of Guya would have easily gone to Abiadi or elsewhere to sell their agricultural products and could get better prices. However, we also saw two different markets without much price variation in agricultural produce and indus- trial goods. They were Hawzen and Idagaseluse. There were very high variations of prices in some weredas in markets of Maychew and Neksege. For ex- ample, the price of teff was much cheaper in Maychew (with road) than Neksege (without road). This was mainly because teff could not be grown in Neksege and it came to that place from different other places. In Debub market price of commodities transported on pack animals was much cheaper than transported by motor vehicles. This was because people did not include the value of labor and rent of pack animals in transport cost. But those who used vehicles for transportation sold their commodities at high prices and purchased the agricul- tural products at low prices. We can thus see that the rural households can reap the double benefits. 4.3. Purchased Agricultural Inputs Use Vis-à-Vis Road Accessibility Road accessibility can have an important effect on agri- cultural inputs use. The availability of reliable transport to input and output markets stimulates cash-crop farming in rural areas, and lowers transport costs, which influence access to off-farm employment opportunities. The transi- tion from subsistence farming to a market economy is thus accelerated, so that the poor are better off than merely being self-sufficient [19]. Because of improved transport services and lower transport costs, peasants with good road access use more purchased inputs [15] such as improved seed, fertilizer, herbicides, pesticides, and animal medicine in terms of both quantity and value. More peasants use such inputs because of lower farm gate price, easy accessibility, agricultural extension ser- vices, and technological innovation. Table 3 shows that the proportion of households using purchased inputs such as fertilizers, herbicides, pesticides, and animal medicine were higher in locations with good road access than poor road access. Although more households with good road access used purchased inputs, the average input use (in terms of value) per household was not significantly higher. The households with good road access used nearly same amount of fertilizer per household but paid Copyright © 2012 SciRes. JTTs  T. ARETHUN, B. P. BHATTA 172 Table 3. Households’ purchased agricultural inputs use vis-à-vis road access. Types of agricultural inputs Good access Poor access t-statistic (p-value) Credit amount per household, birr 393 273 1.33 (0.093) Fertilizer, kg/household 37 (69%) 36 (62%) 0.21 (0.415) Value of fertilizer, birr/household 160 187 –0.96 (0.832) Herbicides, birr/household 131 (20%)112 (9%) 0.65 (0.264) Pesticides 17 (2%) 31 (1%) –0.71 (0.724) Animal medicine 73 (27%) 63 (17%) 0.19 (0.427) Note: Figures in the parentheses are the share of households within the category. about 17 percent less money compared to households with poor road access. The reason could be that the farm gate price of fertilizer was higher for households with poor road access. The quantities of fertilizer used by peasant households with good and poor road access, respectively, were not significantly different, but the expenditure on fertilizer was significantly different. The peasant households with poor access to road spent about 17 percent more money than those with good access to road even though they used almost the same amount of fertilizer. It was because the peasant households with poor access to road paid significantly higher price in comparison to those with good access to road. It implies that the farm gate price of fertilizer was almost 17 percent higher in locations with poor road access compared to good road access. Most of the input use, including the value of purchased inputs use, was not significantly different for households with good and poor access to road. It should be noted that there may be many factors, such as unobserved differences in their natural endowments, affecting the households to use purchased inputs which were not controlled. 4.4. Factors Associated to Rural Households’ Access to- and Participation in Markets Factors influencing or correlated to rural farm house- holds’ access to- and participation in markets may be broadly divided into four constructs: market and access to information, household income and resource endow- ments, household characteristics, and village level vari- ables and public goods. The important factors are dis- cussed below. Road accessibility can have important influence on markets from both the supply and demand side because it reduces the imperfect information and transaction costs [4]. Better road accessibility, for example, could help to get market information because of lower transaction costs. It could also encourage people to produce more for markets. From the lender’s point of view also, road ac- cessibility could play a positive role because it makes it easier to get information about the borrower’s activity and reduce the default by risky borrowers. In developing countries, credit facilities are concen- trated in areas closer to cities and thus have better market access. Distance of household from wereda headquarters and market access influence households’ participation in credit markets because of more or less similar reasons discussed in the case of road accessibility. Financial institutions routinely require collateral in the form of land or other fixed assets as a condition for of- fering loans. In such a situation, household resource en- dowments such as farm size, labor endowments, oxen holding and livestock (other than oxen) holding may af- fect households’ participation in credit markets. They may increase participation in credit markets compared to asset constrained households because of the lender’s evaluation of household’s creditworthiness. On the other hand asset rich households may not face liquidity con- straints as long as they could exchange easily their assets into cash. This may reduce their demand for cash and hence their decision to participate. The presence of labor (male or female) may increase intake of higher loan sizes given that there are no markets for these assets to enable easy exchange of cash and fixed assets. Availability of labor implies higher income earning capacity of the household but also increased capital requirement to take-up other income generating activities. The size of land holding by the household may increase the house- hold’s credit by raising the household’s credit require- ment as well as credit worthiness. Oxen are one of the major assets in rural Ethiopia. On the one hand, oxen holding raises the wealth status and credit worthiness of the household, while on the other households can hire out (or sell i.e. distress sell) oxen to earn extra income and they do not need credit so the sign is ambiguous. The expected sign of livestock holding is ambiguous just be- cause one can transform livestock units into liquid assets as soon as the need arises. There could be differences in livestock types in this respect, however. Some house- holds may not like to easily dispose bigger animals such as oxen, not only due to their economic importance (as source of traction) but also the status symbol attached in keeping them. Generally, households endowed with more income and assets tend to experience lower transactions and have more flexibility in allocating resources in mar- ket activities. The households’ participation in markets is also closely related to household characteristics such as age, sex, skill and education level of household head, and consumer-worker ratio. The younger the household head Copyright © 2012 SciRes. JTTs  T. ARETHUN, B. P. BHATTA 173 are, the more likely s/he is to participate in a market. It is generally found that the female headed households are relatively more risk averse and expected to participate less compared to their male counterparts. If the house- hold head is endowed with specific skills and education, its credit worthiness increases. But he/she may have in- come from other opportunities and may not need to take credit. The education of household head is one of the crucial determinants of credit market participation. Edu- cated and skilled household heads also are more likely to generate higher off-farm income implying increased ini- tial loan demand. Dependency ratio may also influence household’s participation in credit markets because household with more dependent members in the family may face temporary cash shortages to meet their con- sumption requirements. Or it could be explained the other way round since there are more dependent mem- bers; the household is relatively more risk averse so the household members may not participate in credit markets. Such households could be less credit worthiness too from the lender’s point of view. The communities differ in their agricultural potential and other opportunities. Village level variables such as rainfall variability, population pressure and access to irrigation also affect households to participate in a mar- ket program indirectly. 5. Summary and Conclusions The households in the study area participated in agricul- tural products, credit, fertilizer and other agricultural inputs, industrial products, land renting, oxen renting and labor markets. Since almost all farm households were deficit food producers, they participated in food markets as food buyers. Households with good access to road had better access to labor, credit and fertilizer markets. Household resource endowments such as total labor in the household and owned land, and dependency ratio significantly influenced the households to decide to par- ticipate in credit markets. Similarly access to market, total labor endowments in the household, and locations where the households were situated significantly influ- enced the households’ level of participation in credit markets. There were significant price variations in locations with good and poor access to road. Households with poor access to road are confronted with wider price bands. Rural households in Tigray used very low purchased inputs such as herbicides, pesticides, animal medicines, etc. Use of purchased agricultural inputs was not signifi- cantly different for households with good and poor ac- cess to road, indicating that there may be many factors such as unobserved differences in natural endowments affecting the households’ use of purchased agricultural inputs. Households located in remote areas were less likely to participate in markets so policies towards integrating remote areas with urban areas through infrastructure de- velopment are recommended. As markets appeared vital for households’ participation in credit markets, govern- ment’s policies towards promoting market and road in- frastructure development are desirable. Since land was one of the significant factors influencing households to participate in credit markets, credit institutions may re- quire land as collateral. This may ration out landless households from credit markets, so policies towards promoting micro credit institutions that provide loan without collateral could be advantageous. REFERENCES [1] International Fund for Agricultural Development (IFAD), “Rural Poverty Report,” IFAD, Rome, 2001. [2] Asian Development Bank (ADB), “Technical Assistance to the People’s Republic of China for the Socioeconomic Assessment of Road Projects,” ADB, Manila, 2002. [3] H. G. Jacoby, “Access to Markets and the Benefits of Rural Roads,” The Economic Journal, Vol. 110, No. 465, 2000, pp. 713-737. [4] E. Sadoulet and A. de Janvry, “Quantitative Development Policy Analysis,” The John Hopkins University Press, Baltimore and London, 1995. [5] “Federal Democratic Republic of Ethiopia,” 2001. http://www.zietlow.com/docs/ ethiopia.pdf [6] G. Fromm, “Transport Investment and Economic Devel- opment,” Brookings Institute, Washington DC, 1965. [7] World Bank, “World Development Report 1994: Infra- structure for Development,” Oxford University Press, Oxford, 1994. [8] SACTRA, “Transport and the Economy,” UK Depart- ment of the Environment, Transport and the Regions, 2000. [9] H. R. Varian, “Microeconomic Theory,” 3rd Edition, W. W. Norton & Company, New York, 1992. [10] H. R. Varian, “Intermediate Microeconomics: A Modern Approach,” 5th Edition, W. W. Norton & Company, New York, 1999. [11] G. G. Bhalla, “Evaluation of Infrastructural Interventions for Rural Poverty Alleviation,” UNESCAP, Bangkok, 2000. [12] D. Schelling and J. Lebo, “Design and Appraisal of Rural Transport Infrastructure: Ensuring Basic Access for Rural Communities,” Technical Paper, The World Bank, 2001. [13] The World Bank, “Morocco-Socioeconomic Influence of Rural Roads: Fourth Highway Project,” Operations Evaluation Department, The World Bank, 1996. [14] K. Lucas, V. Rutachokozibwa and E. Tagora, “The Njombe- Mekete Road: An Impact Assessment of an ATAP Fund- ed Road Improvement Project,” Mimeo, 1995. [15] A. Raisuddin and M. Hossain, “Developmental Impact of Rural Infrastructure in Bangladesh,” Research Report, In- Copyright © 2012 SciRes. JTTs  T. ARETHUN, B. P. BHATTA Copyright © 2012 SciRes. JTTs 174 ternational Food Policy Research Institute, No. 83, 1990. [16] Z. Lui, “Economic Analysis of a Rural Basic Access Road Project: The Case of Andhra Pradesh, India,” Infra- structure Notes: Transport Sector, The World Bank, 2000. [17] REST and NORAGRIC, “Farming Systems, Resource Management and Household Coping Strategies in North- ern Ethiopia,” NORAGRIC, Norway, 1995. [18] Tigray Regional Planning and Economic Development Bureau, “Situation of Road Transport and Communica- tions in Tigray,” Mekelle, 2001. [19] Asian Development Bank, “Impact of Rural Roads on Poverty Reduction: A Case Study-Based Analysis,” ADB, Manila, 2002. Appendix: Variation of Prices (in Birr) of Industrial and Agricultural Products Price variation of industrial products in some market places ADGUDOM AND DEBUB Commodities Adigudom Debub Difference Matches 0.25 0.25 0 Cigarettes (packet) 3.5 3.5 0 Battery 3.5 3.5 0 Sugar (kg) 5.5 8 2.5 Soap (piece) 1 1.5 0.5 KOREM AND MAY MAIDO Commodities Korem Maymaido Difference Matches 0.25 0.25 0 Cigarettes (Nyala) 4 4.5 0.5 Battery 4 4.5 0.5 Sugar 7.5 8 0.5 Soap 1 1.25 0.25 MAYCHEW AND NEKSEGE Type commodities Maychew Nekseg Difference Matches 0.25 0.25 0 Cigarettes (Nyala) 3.5 3.5 0 Battery 4 4 0 Sugar 5.5 8 2.5 Soap 1 2 1 DANSHA AND KETEMA NEGUS3E Commodities Dansha Ketema Neguse Difference Matches 0.25 0.5 0.25 Cigarettes 3.5 3.5 0 Battery 3 4 1 Sugar 5 6.5 1.5 Soap 1 2.5 1.5 MAYTSEBRE AND FEYALWEHA Commodities Maysebre Feyalweh Difference Matches 0.25 0.75 0.25 Cigarettes (Nyala) 3.5 3.5 0 Battery 3.5 4.5 1 Sugar 5.5 7 2 Soap 1 2 1 ABUADI AND GUYA Commodities Abiadi Guya Difference Matches 0.25 0.25 0 Cigarettes 4 4 0 Battery 3.5 4 0.5 Sugar 5.5 6 0.5 Soap 1.25 2 0.75 HAWZEN AND EDAGASELUSSE Commodities Hsezen Edagaselusse Difference Matches 0.25 0.25 0 Cigarettes 3.5 3.5 0 Battery 4 4.25 0.25 Sugar 6 6.5 0.5 Soap 1.25 1.5 0.25 WIKRO AND ATSEBE Commodities Wikro Atsebe Difference Matches 0.25 0.25 0 Cigarettes (Nyala) 3.5 4 0.5 Battery 3.5 4 0.5 Sugar 5.5 6 0.5 Soap 1.25 2 0.75 Price variation of agricultural products in some market places ADIGUDOM AND DEBUB Commodities Adigudom Debub Difference Mixed teff 200.25 168.75 37.75 White teff 243.75 187.5 56.25 Barely 125 97.5 27.5 Wheat 144 157.5 13.5 MAYCHEW AND NEKSEGE Commodities Maychew Neksege Difference Mixed teff 150 187.5 37.5 Barely 93.75 75 18.75 Wheat 168.75 150 18.75 Finger millet 120 80 40 ABIADI AND GUYA Type commodities Abaidi Guya Difference Mixed teff 225 215 10 White teff 200 185 15 Maize 115 110 5 Barely 140 130 10 Wheat 225 225 0 Finger millet 116 112 4 HAWZEN AND EDAGASELUSSE Type commodities Hawzen Edagkase Difference Mixed teff 275 275 0 White teff 240 240 0 Maize 180 180 0 Barely 140 140 0 Wheat 170 170 0 Finger millet 170 170 0 Source: Tigray Regional National State Planning and Economic Develop- ment Bureau (2001). |