Sociology Mind
2012. Vol.2, No.2, 177-184
Published Online April 2012 in SciRes (http://www.SciRP.org/journal/sm) http://dx.doi.org/10.4236/sm.2012.22023
Copyright © 2012 SciRes. 177
Real-Time Twitter Sentiment toward Midterm Exams
Wei Hu
Department of Computer Science, Houghton College, New York, USA
Email: wei.hu@houg hton.edu
Received December 3rd, 2011; revised January 7th, 2012; accepte d February 6th, 2012
Twitter is the most popular microblogging service today, with millions of its uers posting short messages
(tweets) everyday. This huge amount of user-generated content contains rich factual and subjective in-
formation ideal for computational analysis. Current research findings suggest that Twitter data could be
utilized to gain accurate public sentiment on various topics and events. With help of Twitter Stream API,
we collected 260,749 tweets on the subject of midterm exams from students on Twitter for two consecu-
tive weeks (Oct 17-Oct 30, 2011). Our aim was to investigate the real-time Twitter sentiment on midterm
exams by hour, day, and week for these two weeks, using a sentiment predictor built from an opinion
lexicon augmented for this specific domain. At different levels of temporal granularity, our analysis re-
vealed the variation of sentiment. The average sentiment of the first week (Oct 17-23) was more negative
than the second week (Oct 24-30). For both weeks, the overall trend curves of sentiment increased from
Monday to Sunday. For each weekday, there was a period around 9:00 am-5:00 pm EST that had maxi-
mum sentimet. On each weekend, the sentiment values during a day reached their maximum between 5:00
am to 8:00 am, and then decreased after 8:00 am. Furthermore, we observed some consistent group be-
havior of Twitter users based on seemingly random behavior of each individual. The lowest number of
tweets always occured around 5:00 am-6:00 am each day, and the maximum number was around 1:00 pm
except Sunday. The minimum of tweet lengths happened usually around 9:00 am and the maximum
length was around 4:00 am everyday. Twitter users with positive sentiment appeared to have more friends
and followers than those carrying negative sentiment. Also, users who shared the same sentiment inclined
to have similar ratios of friends and followers, which is not true for general users.
Keywords: Twitter; Sentiment; Midterm Exam; Opinion; Lexicon; Social Media
Introduction
Twitter, founded in 2006, is the most popular microblogging
service with millions of users sharing information and opinions
everyday. The messages posted on Twitter, termed tweets or
updates, are short and limited to 140 characters including pun-
ctuaton and spacing, averaging 11 words per message. As a
phenomenal online social networking site, Twitter provides an
unprecedent rich source of data containing facts and opinions
for text mining and analysis, bringing in many new oppornuties
and intellectual challenges.
In the field of text mining, there has been a shift from tradi-
tional fact based analysis to opinion oriented analysis, i.e., from
classifying docments by their topics such as sports, health, or
en tertainment to their sentiment a bout a particular subject or eve nt
such as a movie or a commercial product. In text classification
of documents by topic, there might be many possible categories.
In contrast, in sentiment classification there are relatively few
classes, say positive or negagtive, that cover many domains.
Compared to topic discovery, sentiment is difficult to identify,
because it can be expressed in a very subtle manner. Further-
more, sentiment is context sensitive and domain dependent. The
same sentence can exhibit opposite sentiments in two different
contexts or domains. As a result, one sentiment predictor may
perform well in one targeted domain, but may perform poorly
in other domains.
Historically there has been extensive research on mining and
retrieval of factual information, including Web search, text
classif ication , and text clusteri ng. Howev er, sen timen t has emerged
as a new subject of research recently because of the explosion
of public user-generated content in online social media. Identi-
fying opinions expressed in social media is a popular way of
interpreting this type of data, which could lead to a broad range
of applications. Companies and organizations can improve their
products and services according to the sentiment of their cus-
tomers. The opinion of one individual might only represent the
subjective view of this person, but the collection of opinions
from a large number of people are nonetheless statistically sig-
nificant and influential, and therefore are accurate public indi-
cators of different topics and events.
Sentiment analysis, also known as opinion mining, is the
computational extraction of opinion, sentiment, and emotion in
text. There is an excellent survey on this subject (Pang, 2008).
Sentiment can be analyzied at various levels: document, section,
paragraph, and sentence, with document as the most common
level. There are studies on general sentiment from standa rd and
long documents, and Twitter specific sentiment (Go et al., 2009;
Pak & Paroubek, 2010). At the document level, the work in
(Pang, 2002; Turney, 2002) evaluated the polarity of product
reviews and movie reviews respectively.
Statistical natural language processing and machine learning
are two commom methods in sentiment analysis. With natural
language processing, the opinon polarity of a document or a
sentence is determined using a set of indicative opinion words,
an opinion lexicon, that express positve or negative sentiment
such as “good” or “bad”. The machine learning approach is to
build a sentiment classifier based on manually labeled training
W. HU
data to predict the class of sentiment (positive, negative, or neu-
tral). Obtaining large size of training data annotated by experts
is difficult, and sometimes human judgment of the sentiment
expressed in text is not as accurate as an automated approach.
To overcome these difficulties, recently there were reports that
combined both techniques (Lu &Tsou, 2010; Tan et al., 2008).
Using movie reviews as data, machine learning techniques
were found to be more effective in sentiment collection than
human produced baselines. But they didn’t predict as well on
sentiment as on traditional topic based classification, implying
that the sentiment classification was more challenging (Pang,
2008). To improve the performance of the machine learning
approach in (Pang, 2008), a novel technique of finding mini-
mum cuts in graphs was proposed to extract the subjective por-
tions of the document, thus removing the irrelevant text while
keeping the subjective portion (Pang et al., 2002).
Due to the 140 character limitation on tweets, Twitterers
have adopted abbreviated and slang expressions to overcome
this limit. Thus, they have created a language of different flavor
in this social media than the one used in traditional texts.
Tweets also contain misspellings, and are shorter and more
ambiguous than other sentiment data such as reviews and blogs.
Another feature of tweets is that they cover a variaty of topics
unlike other blogging sites that are more focused on one or a
few topics. Consequently, it is not straightforward to detect the
sentiment of tweets.
People typically use Twitter for daily chatter, conversation,
information sharing, and news reporting (Java et al., 2007). A
study showed that 19% of tweets mention a certain brand, and
20% of them contain a sentiment (Jansen et al., 2009). In gen-
eral, these massages could be classified into two groups: about
Twitter users themselves and information sharing. In both cases,
tweets contain information about the mood of their writers
(MorNaaman & Boase, 2010). With six dimensions of mood
(tension, depression, anger, vigor, fatigue, confusion), the pub-
lic mood patterns learned from Twitter data were found to be
related to real offline events, such as changes in the stock mar-
ket and the oil price, and the outcome of a political election
(Bolle et al., 2011). To find the connection between public
opinions from polls and the sentiment from Twitter messages
(O’Connor et al., 2010), positive and negative words were de-
fined by a subjectivity lexicon, a set of words containing about
1600 and 1200 words marked as positive and negative, respec-
tively. A message was defined as positive if it contained any
positive word, and negative if it contained any negative word.
This allowed for messages to be both positive and negative.
The results from (O’Connor et al., 2010) showed that the senti-
ment from Twitter data was highly correlated with the polls.
Sentiment detection of tweets is one of the fundemental
components in the applications using Twitter data. There are
several sentiment tools developed for Twitter data such as
Twendz, Twitter Sentiment, TweetFeel, and Viralheat, but most
of them are still lacking the expected accuracy due to the
unique characteristics of tweets.
In this report, we sought to examine a stream of text mes-
sages from students on Twitter to gather real-time sentiment
toward midterm exams. Our main interest was to discover the
fluctuation in sentiment about midterms from this particular
group of Twitter users by hour, day and week, thus our investi-
gation could disclose the sentiment at different levels of tem-
poral granularity. Twiter Stream API made it possible to ana-
lyze sentiment for this topic as they arose in real-time.
Though many colleges allow students to evaluate their
courses, Twitter provides a venue for them to express opinions
on their midterm exams. Students have different feelings about
the midterm exams. They can have high confidence in the
coming exams because they have studied and prepared well,
otherwise, they may feel uncertain, uneasy, afraid, scared, and
anxious. They also can express the feelings to their teachers,
exams in general, and their grades from these exams.
Materials and Methods
Twitter Data
Twitter is a service for information network and communica-
tion, which produces more than 200 million tweets a day.
Twitter offers three APIs to access its corpus of data and sup-
port developers to build applications using Twitter data. The
Search API allows a user to query for Twitter content, and the
REST API enables the access to some of the core primitives of
Twitter including timelines, status updates, and user informa-
tion. Finally, the Streaming API is the real-time sample of the
Twitter Firehose with a long-lived HTTP connection to retrieve
tweets by user ids, keywords, random sampling, geographic
location, etc. This API is best for building data mining applications.
Using Twitter Stream API (https://dev.twitter.com/docs/strea
ming-api) and Twitter4J (http://twitter4j.org), we collected a cor-
pus of 260,749 tweets on midterm exmas during a period of
two consecutive weeks, from Oct 17 to Oct 30, 2011. The de-
tailed information for the numbers of tweets collected by day is
presented in Table 1.
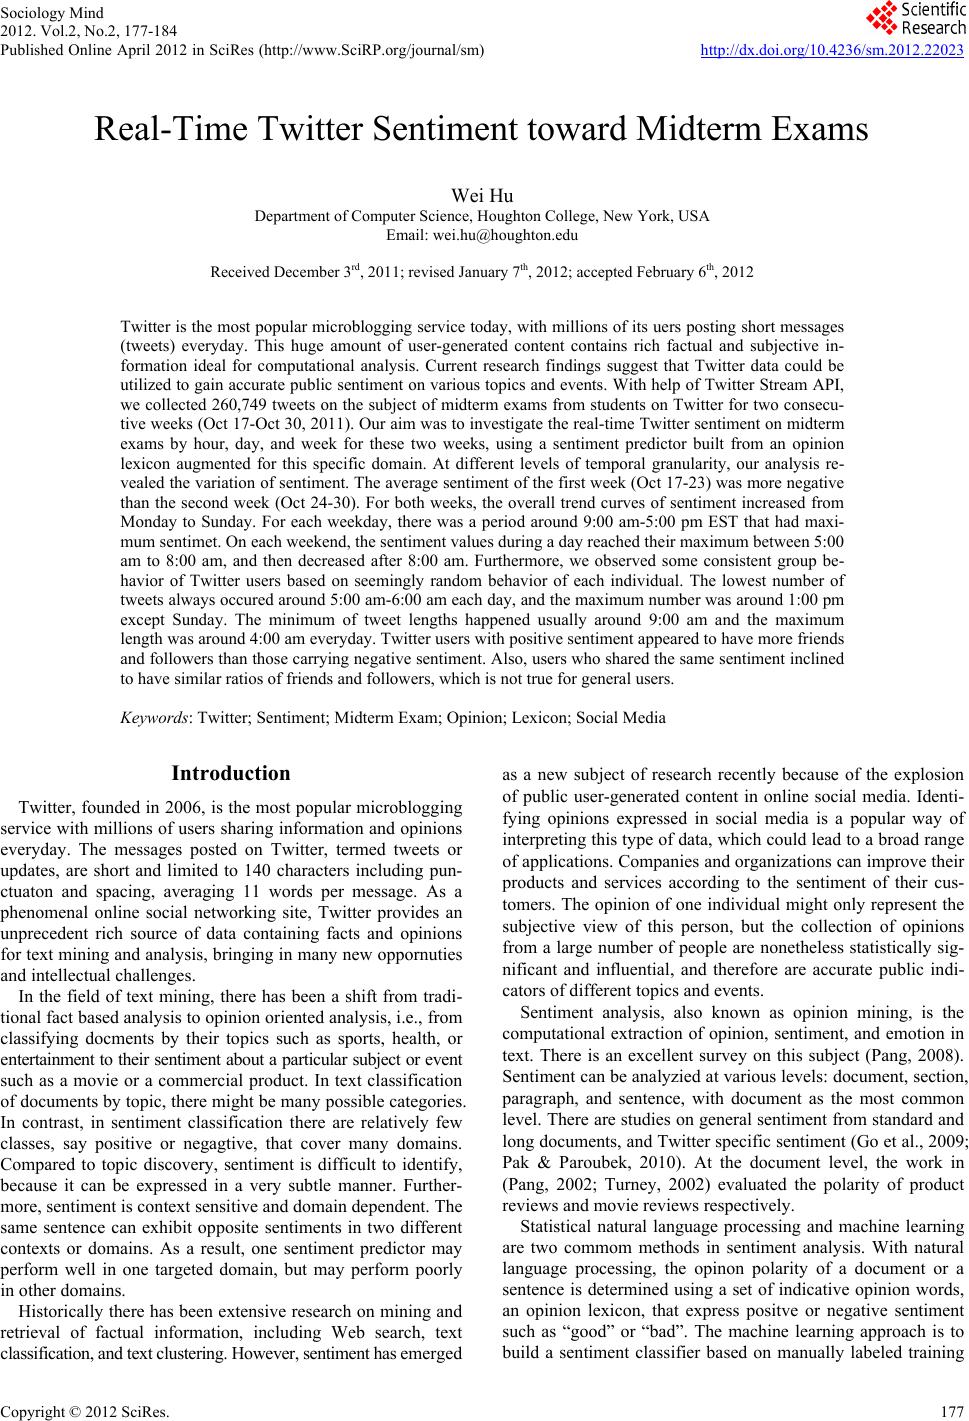
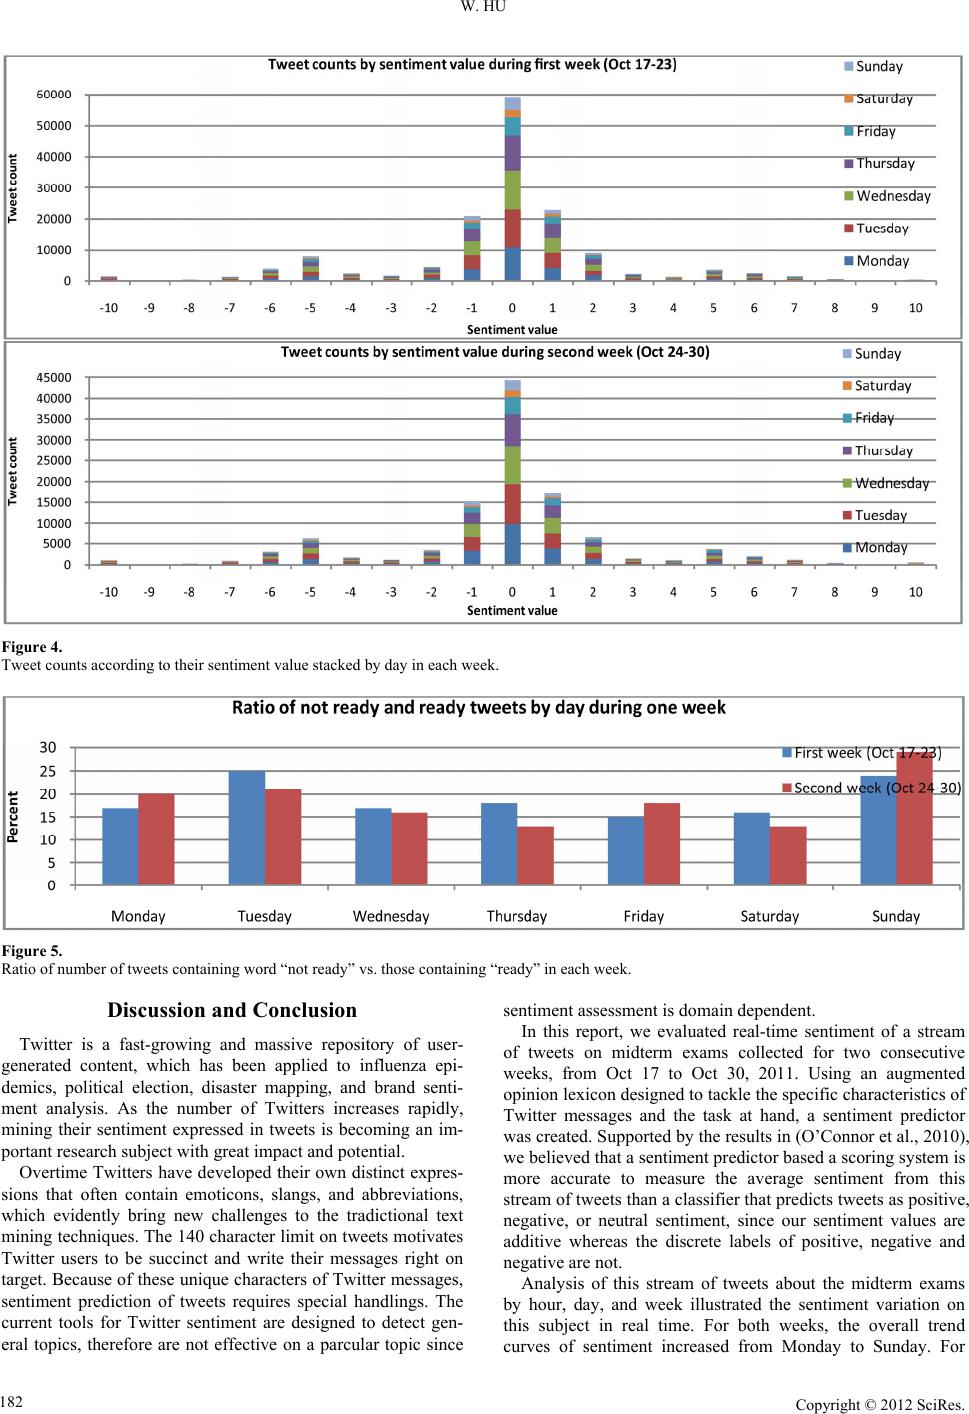
To gain a preliminary view of our tweet data, we calculated
the average tweet count and tweet length by hour during these
two weeks (Figure 1). Amazingly, some group patterns of
these student Twitters were detected from the random behavior
of each individual. The lowest average tweet count was always
around 5:00 am-6:00 am each day, and the maximum count was
around 1:00 pm except Sunday. Remarkably, the minimum
average length was regularly around 9:00 am and the maximum
length was around 4:00 am.
Sentiment Predictor
In the present study, we employed an opinion lexicon (Hu &
Bing, 2004) of around 6800 words to build our sentiment pre-
dictor. Several opinion lexicons exist, but a web derived lexi-
con like the one from (Hu & Bing, 2004) could improve lexi-
con-based sentiment evaluation (Velik o v ich et al., 2010).
Considering the nature of midterm exams, we augmented the
opinio lexicon from (Hu & Bing, 2004) with some domain
specific words such as “bombed”, and “aced”, and removed
some negative words such as “criminal”, “fall”, and “break”
from this lexicon since “criminal” in our context can be part of
the name of an exam like “criminal justice midterm”, “fall”
could mean fall semester, and “break” could mean a college
break that students look forward to.
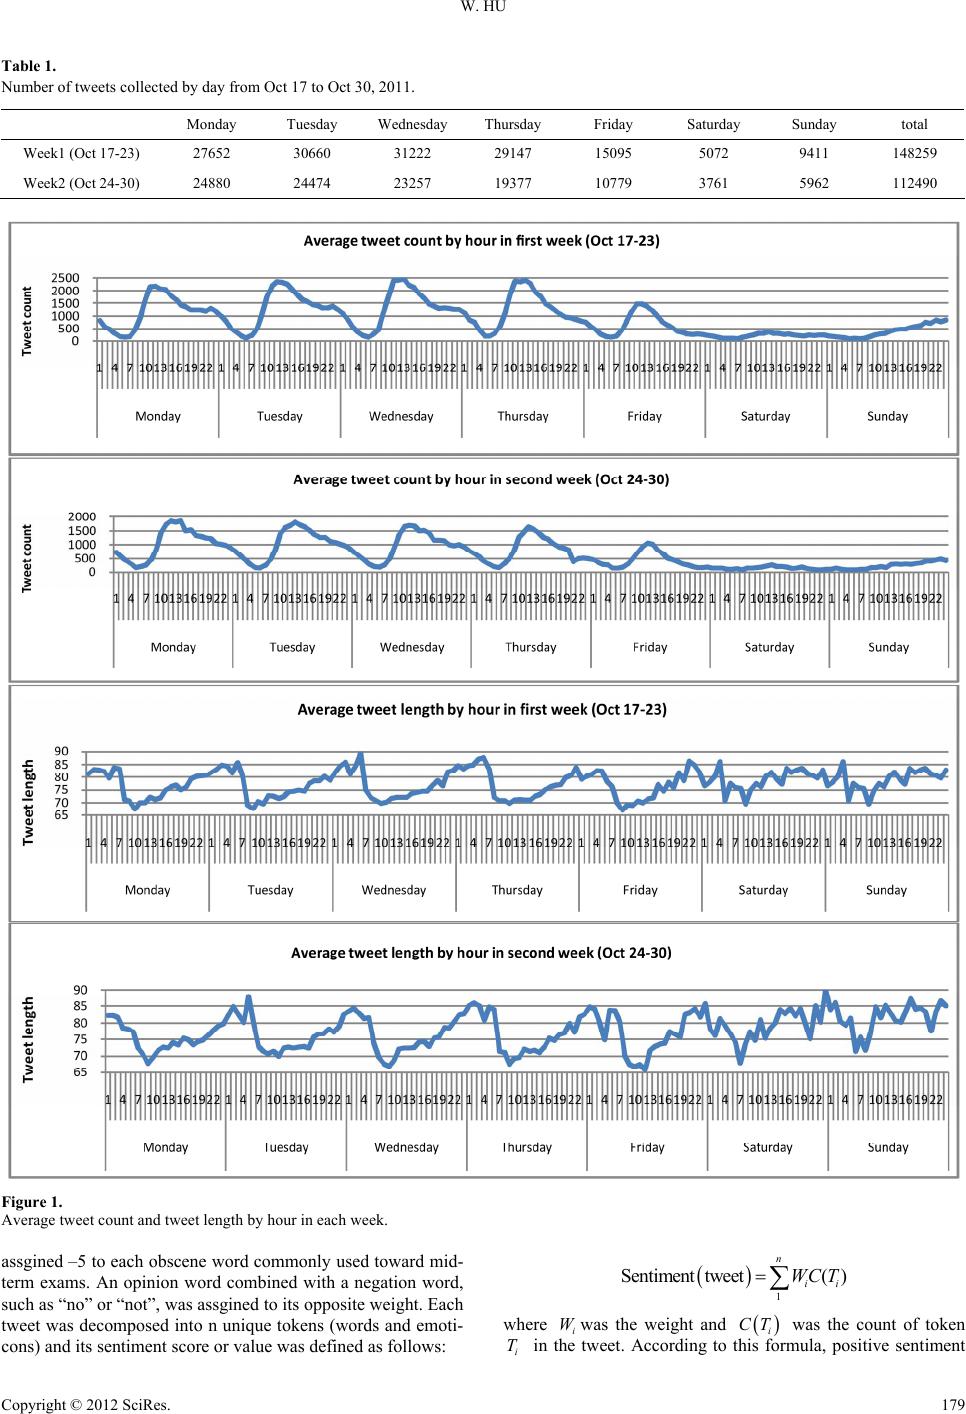
Encouraged by the results in (O’Connor et al., 2010), we
adopted their approch in our study to count instances of posi-
tive and negative words and emoticons, when evaluating the
sentiment of a tweet on midterms using an opinion lexicon.
Considering the characteristics of tweets, a weight +1 was ass-
gined to a positive word, –1 to a negative word, +5 to a positive
emoticon, and –5 to a negative emoticon, since emoticons are
key non-verbal sentiment indicators in tweets. Furthermore, we
Copyright © 2012 SciRes.
178
W. HU
Copyright © 2012 SciRes. 179
Table 1.
Number of tweets collected by day from Oct 17 to Oct 30, 2011.
Monday Tuesday Wednesday Thursday Friday Saturday Sunday total
Week1 (Oct 17-23) 27652 30660 31222 29147 15095 5072 9411 148259
Week2 (Oct 24-30) 24880 24474 23257 19377 10779 3761 5962 112490
Figure 1.
Average tweet count and tweet length by hour in each week.
assgined –5 to each obscene word commonly used toward mid-
term exams. An opinion word combined with a negation word,
such as “no” or “not”, was assgined to its opposite weight. Each
tweet was decomposed into n unique tokens (words and emoti-
cons) and its sentiment score or value was defined as follows:

1
Sentiment tweet()
n
ii
WC T
where iwas the weight and
W
i was the count of token
in the tweet. According to this formula, positive sentiment
CT
i
T
W. HU
values represent positive sentiment of a tweet, whereas negative
sentiment values mean negative sentiment. Obviously, a zero
value represents neutral sentiment.
The purpose of this study was to gauge the average Twitter
sentiment on midterm exams. It was natural to solve our prob-
lem with a scoring system rather than a clssifier that predicts
the sentiment as either positive, neutral, or negative. Since the
scores are additive, three tweets with sentiment values –3, 0,
and 9 can have their average as 2, while the average sentiment
is difficult to measure if these three tweets are classified as one
negative, one neutral, and one positive.
To render the difference between a generic Twitter sentiment
tool and our predictor, we ran Viralheat (http://www.viralheat.com)
on Oct 17, 2011 using keyword midterm. Some of the senti-
ment predictions by Viralheat and our predictor are displayed in
Table 2. Viralheat is designed to detect sentiment from general
tweets, which contain opinons on a wide array of topics. It was
not surprising that our sentiment values made more sense when
looking at the actual text of each tweet. For example, the first
tweet contained a happy emoticon and the word “happiest”, but
Viralheat gave negative 73%, while our predictor gave a posi-
tive sentiment value of 6.
Results
In the current study, two experiements were performed to as-
sess the sentiment on midterm exams from a diverse group of
students on Twitter. The first was determination of Twitter
sentiment variation on midterms in real time by hour, day, and
week during a period of two consecutive weeks. The time used
here was Eastern Standard Time. The second was to investigate
whether sentiment was assortative among the Twitter users who
expressed their opinions on midterms.
Real-Time Twitter Sentiment on Midterms
Using the sentiment formula for a tweet introduced in Section 2,
sentiment values were calculated for a stream of tweets on
midterms collected from Oct 17 to Oct 30, 2011. These values
were then sorted according to their time by hour, day, and week,
and an average was taken for each hour (Figure 2). Our analy-
sis suggested that the average sentiment of the first week (Oct
17-23) was more negative than the second week (Oct 24-30).
As the midterm season approched to an end, Twitter users tended
to be more hopeful about these exams and looked forward t o c ol -
lege breaks and time for rest. The slope of increasing sentiment
Table 2.
Sentiments of several tweets on midterms evaluated by Viralheat and our predictor.
Tweet Sentiment by Viralheat Sentiment by our predictor
I am officially the happi est college student on earth. 98.5 on my chemo midterm and
97 on my calc midterm :))). negative 73% 6
Blake got a 92% on a math midterm he didn’t even s t udy for. Yes, that was third
person and you love it, don’t you ? negative 99% 2
So I walk into class n theres a midterm I miss one class n of course it had to ve the one
where he announces the midterm negative 99% –1
[UK] Longhor ns football at “midterms”: AUSTIN—Consider this the mid term assessment
at the halfwa... bit.ly/pYaZhH #football #UK negative 99% 0
Back to this m idterm study guide for tomorrow #GrownFolksProblems negative 97% 0
so far my midterm grades lo okin good.need the rest of them to be put in negative 97% 1
Figure 2.
Average hour-by-hour sentiment of each week.
Copyright © 2012 SciRes.
180
W. HU
in the second week was larger than the first, which was caused
by an apparent higher positive sentiment on Friday, Saturday,
and Sunday in the second week.
There was a period during a weekday around the interval of
9:00 am to 5:00 pm that had maximum sentiment compared to
rest of the day. However, Friday Oct 28 was one exception with
high positive sentiment for an extended period of time. The
sentiment values during a day at weekends usually reached
their maximum between 5:00 am to 8:00 am, and then de-
creased after 8:00 am. The sentiment patterns during a weekday
appeared different from a weekend.
A careful inspection of the collected tweets indicated that
some of them contained obscene words toward midterms. To
identify their usage in these tweets, we counted the average
number of these words over the total number of tweets in each
hour (Figure 3). The trend curves in Figure 3 implied that their
usage decreased from Monday to Sunday, which was in the
opposite trend of sentiment curves in Figure 2. It was evident
that large number of these words would produce very negative
sentiment. Although the peeks of the curves in Figure 3 oc-
curred at a different time each day, but regularly around 7:00
am there was a local minimum usage of obscene words.
After looking into the dynamics of hourly and daily senti-
ment changes in Figure 2, we next examined the fluctuating
patterns of sentiment between the first and second week. For
this purpose, we counted the number of tweets according to
their sentiment value by day, and stacked the counts of tweets
of the same senitment from Monday to Sunday for each week
(Figure 4). The Pearson correlation between the sentiment
distributions of these two weeks is 0.99, implying a high degree
of similarity for the overall sentiment between the first and
second week. Yet, our hour-by-hour sentiment curves in Figure
2 were able to show the varying nature of sentiment during
these two weeks.
In addition to the sentiment evaluation, we also wanted to
comprehend the readiness of this group of Twitter users for
their midterms. The tweets that contained either the word “not
ready” or “ready” were counted by day during a week and their
ratio is presented in Figure 5. The first week had a mean of
18.85% and a standard deviation of 3.98 and second week had a
mean of 18.57% and a standard deviation of 5.56, which sug-
gested the means of these ratios were similar between these two
weeks. However, the ratio of tweets containing the word “not
ready” vs. those containing “ready” was higher on Sunday,
Monday, and Tuesday than other days in a week.
Twitter Users Stratified by Their Sentiment on
Midterms
We explored the opportunity to detect group behavior of
Twitter users according to their sentiment on midterms. Our
hypothesis was that Twitter users with similar sentiment would
tweet likewise. There are a few features used to describe each
Twitter user that include, among others, the number of friends
and followers. We sorted the number of friends and followers
of each user according to his/her sentiment value by day and
then took an average (Figure 6).
During the first week, Twitter users with negative sentiment
had a mean of 241.35 and 265.25 for their average friends and
followers respectively, while the positive had a mean of 293.16
and 324.74, suggesting that positive users usually had more
friends and followers and as a result were more connected to
others in online social media. Moreover, the Pearson correlation
between the distributions of average number of friends and
followers was 0.78.
For the second week, Twitter users with negative sentiment
had a mean of 227.83 and 261.63 for their average friends and
followers respectively, whereas the positive had a mean of
278.58 and 350.16. Again, as in the first week, positive users
had more friends and followers than negative users. The Pear-
son correlation between the distributions of average number of
friends and followers was 0.97, demonstrating stronger associa-
tion in the second week than in the first. The high correlation
value implied that the ratios of friends and followers of Twitter
users of the same sentiment were similar, which is not true for
general users.
Figure 3.
Average obscene words in tweets by hour in each week.
Copyright © 2012 SciRes. 181
W. HU
Figure 4.
Tweet counts according to their sentiment value stacked by day in each week.
Figure 5.
Ratio of number of tweets containing word “not ready” vs. those containing “ready” in each week.
Discussion and Conclusion
Twitter is a fast-growing and massive repository of user-
generated content, which has been applied to influenza epi-
demics, political election, disaster mapping, and brand senti-
ment analysis. As the number of Twitters increases rapidly,
mining their sentiment expressed in tweets is becoming an im-
portant research subject with great impact and potential.
Overtime Twitters have developed their own distinct expres-
sions that often contain emoticons, slangs, and abbreviations,
which evidently bring new challenges to the tradictional text
mining techniques. The 140 character limit on tweets motivates
Twitter users to be succinct and write their messages right on
target. Because of these unique characters of Twitter messages,
sentiment prediction of tweets requires special handlings. The
current tools for Twitter sentiment are designed to detect gen-
eral topics, therefore are not effective on a parcular topic since
sentiment assessment is domain dependent.
In this report, we evaluated real-time sentiment of a stream
of tweets on midterm exams collected for two consecutive
weeks, from Oct 17 to Oct 30, 2011. Using an augmented
opinion lexicon designed to tackle the specific characteristics of
Twitter messages and the task at hand, a sentiment predictor
was created. Supported by the results in (O’Connor et al., 2010),
we believed that a sentiment predictor based a scoring system is
more accurate to measure the average sentiment from this
stream of tweets than a classifier that predicts tweets as positive,
negative, or neutral sentiment, since our sentiment values are
additive whereas the discrete labels of positive, negative and
negative are not.
Analysis of this stream of tweets about the midterm exams
by hour, day, and week illustrated the sentiment variation on
this subject in real time. For both weeks, the overall trend
curves of sentiment increased from Monday to Sunday. For
Copyright © 2012 SciRes.
182
W. HU
Figure 6.
Average number of friends and foll owers of Twitter users grouped by their sentiment in each week.
each weekday, there was a period around 9:00 am-5:00 pm EST
that had maximum sentimet. On each weekend, the sentiment
values during a day reached their maximum between 5:00 am to
8:00 am, and then decreased after 8:00 am. The Pearson corre-
lation between the distributions of sentiment values stacked by
day between the first and second week was 0.99, which indi-
cated that the static characters of sentiment values of these two
weeks were identical. However, our hour-by-hour sentiment
detection was able to discover the changing nature of the sen-
timent on midterms.
Furthermore, we observed some consistent group behavior of
Twitter users based on seemingly random behavior of each
individual. The lowest number of tweets on midterms always
occured around 5:00 am-6:00 am each day, and the maximum
number was around 1:00pm except Sunday.
We also tested our hypothesis that Twitter users who ex-
pressed the same sentiment toward midterms would tweet in a
similar fashion. Twitter users carry ing positive sentiment seemed
to have more friends and followers than negative users. The
ratios of friends and followers of Twitter users with the same
sentiment were close, which is not true for general users.
In summary, a stream of tweets on midterms from students
on Twitter were collected using Twitter Stream API for two
consecutive weeks. Real-time sentiment analysis on this tweet
Copyright © 2012 SciRes. 183
W. HU
stream was conducted with an augemented lexicon based sen-
timent predictor. Our findings highlighted the dynamics of sen-
timent variation at various temporal granularity. Moreover, in-
teresting group behavioral patterns of these student Twitters
were uncovered from the random behavior of each individual.
Acknowledgements
We thank Houghton College for its financial support.
REFERENCES
Asur, S., & Huberman, B. A. (2010). Predicting the future with social
media. Proceedings of the ACM international conference on web in-
telligence, Toronto, 31 August-3 September 2010, 492-499.
Bollen, J., Pepe, A., & Mao, H. N. (2011). Modeling public mood and
emotion: Twitter sentiment and socio-economic phenomena. The In-
ternational Conference on Weblogs and Social Media, Barcelona,
17-21 July 2011.
Go, A., Bhayani, R., & Huang, L. (2009). Twitter sentiment classifica-
tion using distant supervision. Stanford: CS224N Project Report.
Hu, M. Q., & Liu, B. (2004). Mining and summarizing customer re-
views. Proceedings of the ACM SIGKDD International Conference
on Knowledge Discovery & Data Mining, Seattle, 22-25 August 2004.
Jansen, B. J., Zhang, M., Sobel, K., & Chowdury, A. (2009). Twitter
power: Tweets as electronic word of mouth. Journal of the American
Society for Information Science and Technology, 60, 2169-2188.
doi:10.1002/asi.21149
Java, A., Song, X., Finin, T., & Tseng B. (2007). Why we twitter: Un-
derstanding microblogging usage and communities. Proceedings of
the 9th WebKDD and 1st SNA-KDD 2007 Workshop on Web mining
and Social Network Analysis, San Jose, 12-15 August 2007, 56-65.
Krishnamurthy, B., Gill, P., & Arlitt, M. (2008). A few chirps about
twitter. Proceedings of the First Workshop on Online Social Net-
works, Seattle, 17-22 August 2008, 19-24.
Liu, B. (2010). Sentiment analysis and subjectivity, invited chapter for
the handbook of natural language processing (2nd ed.). London/
Boca Raton: Chapman and Hall/CRC.
Lu, B., & Tsou, B. K. (2010). Combining a large sentiment lexicon and
machine learning for subjectivity classification. Proceedings of the
International Conference of Machine Learn ing and Cybernetics, Qing-
dao, 11-14 July 2010, 3311-3316.
MorNaaman, C.-H. L., & Boase, J. (2010). Is it all about me? User
content in social awareness streams. Proceedings of the 2010 ACM
Conference on Computer Supported Cooperative Work, Savannah, 6-
10 February 2010.
O’Connor, B., Balasubramanyan, R., Routledge, B. R., & Smith, N. A.
(2010). From tweets to polls: Linking text sentiment to public opin-
ion time series. Proceedings of the International Artificial Intelli-
gence Conference on Weblogs and Social Media, Atlanta, 11-15 July
2010, 122-129.
Pang, B., Lee, L., & Vaithyanathan, S. (2002). Thumbs up? Sentiment
classification using machine learning techniques. Proceedings of the
Conference on Empirical Methods in Natural Language Processing,
Philadelphia, 6-7 July 2002, 79-86.
Pang, B., & Lee, L. (2008). Opinion mining and sentiment analysis.
Foundations and Trends in Informat ion Retrieval, 2, 1-135.
doi:10.1561/1500000011
Pak, A., & Paroubek, P. (2010). Twitter as a corpus for sentiment
analysis and opinion mining. Proceedings of The International Con-
ference on Language Resources and Evaluation Conference, Malta,
17-23 May 2010, 1320-1326.
Tan, S. B., Wang, Y. F., & Cheng, X. Q. (2008). Combining learn-
based and lexicon-based techniques for sentiment detection without
using labeled examples. Proceedings of the 31st ACM SIGIR Con-
ference on Research and Development in Information Retrieval, Sin-
gapore, 20-24 July 2008, 739- 740.
Turney, P. (2002). Thumbs up or thumbs down? Semantic orientation
applied to unsupervised classification of reviews. Proceedings of the
Association for Computational Linguistics, Philadelphia, 6-12 July
2002, 417-424.
Velikovich, L., Blair-Goldensohn, S., Hannan, K., & McDonald, R. (2010).
The viability of web-derived polarity lexicons, human language
technologies. The 2010 Annual Conference of the North American
Chapter of the Association for Computational Linguistics, Associa-
tion for Computational Linguistics, Los Ang eles, 1-6 June 2010, 777-
785.
Vieweg, S., Hughes, A. L., Starbird, K., & Palen, L. (2010). Microb-
logging during two natural hazards events: What twitter may con-
tribute to situational awareness. Proceedings of the 28th Interna-
tional Conference on Human factors in Computing Systems, Atlanta,
10-15 April 2010, 1079-1088.
Copyright © 2012 SciRes.
184