Paper Menu >>
Journal Menu >>
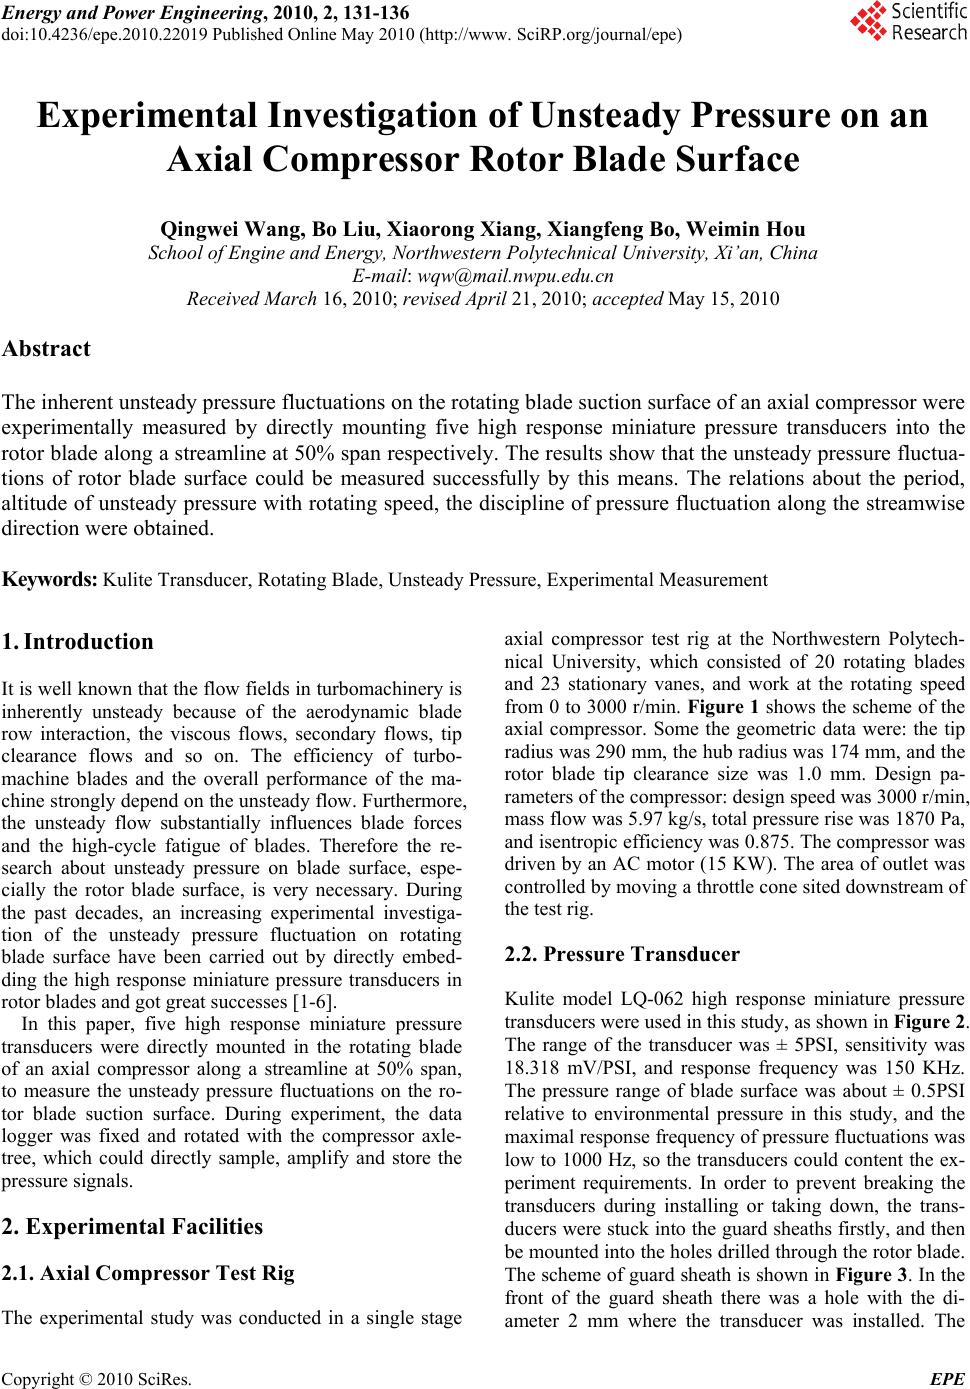 Energy and Power Engineering, 2010, 2, 131-136 doi:10.4236/epe.2010.22019 Published Online May 2010 (http://www. SciRP.org/journal/epe) Copyright © 2010 SciRes. EPE 131 Experimental Investigation of Unsteady Pressure on an Axial Compressor Rotor Blade Surface Qingwei Wang, Bo Liu, Xiaorong Xiang, Xiangfeng Bo, Weimin Hou School of Engine and Energy, Northwestern Polytechnical University, Xi’an, China E-mail: wqw@mail.nwpu.edu.cn Received March 16, 2010; revised April 21, 2010; accepted May 15, 2010 Abstract The inherent unsteady pressure fluctuations on the rotating blade suction surface of an axial compressor were experimentally measured by directly mounting five high response miniature pressure transducers into the rotor blade along a streamline at 50% span respectively. The results show that the unsteady pressure fluctua- tions of rotor blade surface could be measured successfully by this means. The relations about the period, altitude of unsteady pressure with rotating speed, the discipline of pressure fluctuation along the streamwise direction were obtained. Keywords: Kulite Transducer, Rotating Blade, Unsteady Pressure, Experimental Measurement 1. Introduction It is well known that the flow fields in turbomachinery is inherently unsteady because of the aerodynamic blade row interaction, the viscous flows, secondary flows, tip clearance flows and so on. The efficiency of turbo- machine blades and the overall performance of the ma- chine strongly depend on the unsteady flow. Furthermore, the unsteady flow substantially influences blade forces and the high-cycle fatigue of blades. Therefore the re- search about unsteady pressure on blade surface, espe- cially the rotor blade surface, is very necessary. During the past decades, an increasing experimental investiga- tion of the unsteady pressure fluctuation on rotating blade surface have been carried out by directly embed- ding the high response miniature pressure transducers in rotor blades and got great successes [1-6]. In this paper, five high response miniature pressure transducers were directly mounted in the rotating blade of an axial compressor along a streamline at 50% span, to measure the unsteady pressure fluctuations on the ro- tor blade suction surface. During experiment, the data logger was fixed and rotated with the compressor axle- tree, which could directly sample, amplify and store the pressure signals. 2. Experimental Facilities 2.1. Axial Compressor Test Rig The experimental study was conducted in a single stage axial compressor test rig at the Northwestern Polytech- nical University, which consisted of 20 rotating blades and 23 stationary vanes, and work at the rotating speed from 0 to 3000 r/min. Figure 1 shows the scheme of the axial compressor. Some the geometric data were: the tip radius was 290 mm, the hub radius was 174 mm, and the rotor blade tip clearance size was 1.0 mm. Design pa- rameters of the compressor: design speed was 3000 r/min, mass flow was 5.97 kg/s, total pressure rise was 1870 Pa, and isentropic efficiency was 0.875. The compressor was driven by an AC motor (15 KW). The area of outlet was controlled by moving a throttle cone sited downstream of the test rig. 2.2. Pressure Transducer Kulite model LQ-062 high response miniature pressure transducers were used in this study, as shown in Figure 2. The range of the transducer was ± 5PSI, sensitivity was 18.318 mV/PSI, and response frequency was 150 KHz. The pressure range of blade surface was about ± 0.5PSI relative to environmental pressure in this study, and the maximal response frequency of pressure fluctuations was low to 1000 Hz, so the transducers could content the ex- periment requirements. In order to prevent breaking the transducers during installing or taking down, the trans- ducers were stuck into the guard sheaths firstly, and then be mounted into the holes drilled through the rotor blade. The scheme of guard sheath is shown in Figure 3. In the front of the guard sheath there was a hole with the di- ameter 2 mm where the transducer was installed. The 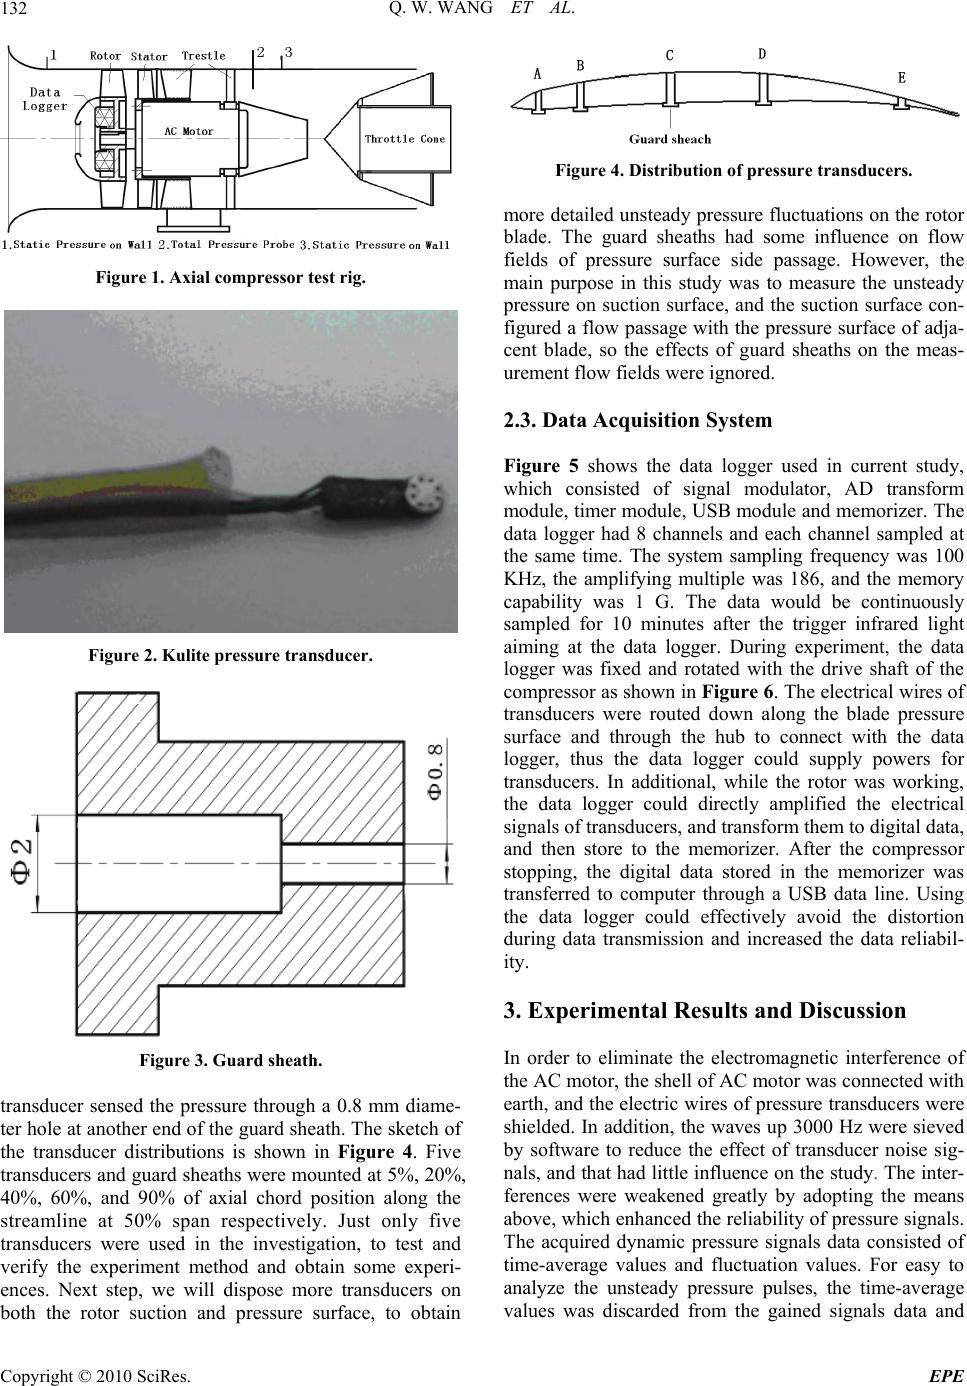 Q. W. WANG ET AL. 132 Figure 1. Axial compressor test rig. Figure 2. Kulite pressure transducer. Figure 3. Guard sheath. transducer sensed the pressure through a 0.8 mm diame- ter hole at another end of the guard sheath. The sketch of the transducer distributions is shown in Figure 4. Five transducers and guard sheaths were mounted at 5%, 20%, 40%, 60%, and 90% of axial chord position along the streamline at 50% span respectively. Just only five transducers were used in the investigation, to test and verify the experiment method and obtain some experi- ences. Next step, we will dispose more transducers on both the rotor suction and pressure surface, to obtain Figure 4. Distribution of pressure transducers. more detailed unsteady pressure fluctuations on the rotor blade. The guard sheaths had some influence on flow fields of pressure surface side passage. However, the main purpose in this study was to measure the unsteady pressure on suction surface, and the suction surface con- figured a flow passage with the pressure surface of adja- cent blade, so the effects of guard sheaths on the meas- urement flow fields were ignored. 2.3. Data Acquisition System Figure 5 shows the data logger used in current study, which consisted of signal modulator, AD transform module, timer module, USB module and memorizer. The data logger had 8 channels and each channel sampled at the same time. The system sampling frequency was 100 KHz, the amplifying multiple was 186, and the memory capability was 1 G. The data would be continuously sampled for 10 minutes after the trigger infrared light aiming at the data logger. During experiment, the data logger was fixed and rotated with the drive shaft of the compressor as shown in Figure 6. The electrical wires of transducers were routed down along the blade pressure surface and through the hub to connect with the data logger, thus the data logger could supply powers for transducers. In additional, while the rotor was working, the data logger could directly amplified the electrical signals of transducers, and transform them to digital data, and then store to the memorizer. After the compressor stopping, the digital data stored in the memorizer was transferred to computer through a USB data line. Using the data logger could effectively avoid the distortion during data transmission and increased the data reliabil- ity. 3. Experimental Results and Discussion In order to eliminate the electromagnetic interference of the AC motor, the shell of AC motor was connected with earth, and the electric wires of pressure transducers were shielded. In addition, the waves up 3000 Hz were sieved by software to reduce the effect of transducer noise sig- nals, and that had little influence on the study. The inter- ferences were weakened greatly by adopting the means above, which enhanced the reliability of pressure signals. The acquired dynamic pressure signals data consisted of time-average values and fluctuation values. For easy to analyze the unsteady pressure pulses, the time-average values was discarded from the gained signals data and Copyright © 2010 SciRes. EPE  Q. W. WANG ET AL. Copyright © 2010 SciRes. EPE 133 Figure 5. The data logger. Figure 6. The fixing of data logger. the fluctuation values was discussed only. The fluctua- tion values was defined using the following formula: ppp ~ . The p ~ was fluctuation value, the was dynamic pressure sampled and the p p was the time-average value of the sampled pressure using the formula 1 0 ()/ i Pn n i P . Before experiment, the whole acquisition system had been static calibrated precisely, that ensure the veracity of the measurement results. The unsteady pressure measurement covered different speeds and an extensive range of mass flow. The inves- tigation focus on the inherent unsteady pressure on rotor blade suction surface, so there was no any disturb source in front of the rotor. Figures 7-16 show the time-domain waves of 5 measurement points under 2000 r/min and 1000 r/min rotating speed while keeping the same outlet area. At the outlet area, the compressor was both near the peak value point of total pressure rise under 2000 r/min and 1000 r/min speed. From the figures it can be ob- served that the pressure fluctuations of rotor blade suc- tion surface were periodical obviously. The period of waveforms at 2000 r/min speed was approximately 0.03 s, and was about 0.06 s at 1000 r/min speed. All these periods were just the times that the compressor revolving one circle at each rotating speed, which shows that the frequency response of inherent unsteady pressure were related to rotating speed. It is obviously that the altitudes of unsteady fluctuations declined as the rotating speed down. The maximal altitude of fluctuation was about 300 Pa at 2500 r/min speed, which was about 85 Pa at 1000 r/min speed. These show that the altitudes of the inherent pressure fluctuations were also related to the rotating speed. The periodical waveforms also contain some other complex pulses, which show the unsteady pressure fluc- tuations were very complicated. Because of the compli- cation of unsteady flow fields, as well as the errors lead- ing by the zero drift of transducers, each of the periodical waveforms is not absolutely the same with the other ones. The reasons of blade surface unsteady pressure were various. The downstream stator was very far from the rotor. The axial distance between the rotor and stator was 268% of the rotor blade chord length at 50% span, so the stator gave little interaction to the flow fields of rotor blade passage. There were three main reasons of rotor blade surface unsteady pressure fluctuations. Firstly, although there were no any disturb source in front of the test rig, the flow fields of the blade passage was essen- tially unsteady because of the viscous flows, secondary flows, tip clearance flows and so on. Secondly, the inlet fairing of the compressor had a little warp and a bad concentricity, which resulted that the airflows passing by the inlet fairing and then flowing into the compressor were not absolutely uniform. Finally, there was a little vibration of test rig during experiment. As a result of fluid inherent characteristics, the inlet fairing and vibra- tion of compressor, the pressure signals of the rotor blade surface were unsteady, and all the reasons were relate to the rotating speed, which were the reasons that the waveforms periods were approximately the same with the time compressor revolving one circle. Figures 17-21 show the fairly typical time-domain waves and frequency spectral curves of 5 measurement transducers near peak value point of total pressure rise under 1500 r/min rotating speed. From the time-domain waves figures it can be observed that the waveforms pe- riods of every measurement point were all approximately 0.04 s, which was the time the compressor revolving one circle. From the frequency spectral curves, it also can be seen that the dominant frequency was the fundamental frequencies of 25 Hz and its hormonics, which was the compressor rotating frequency. All these further prove that the periods of waveforms were related to rotating speed. From the frequency spectral curves, it can be 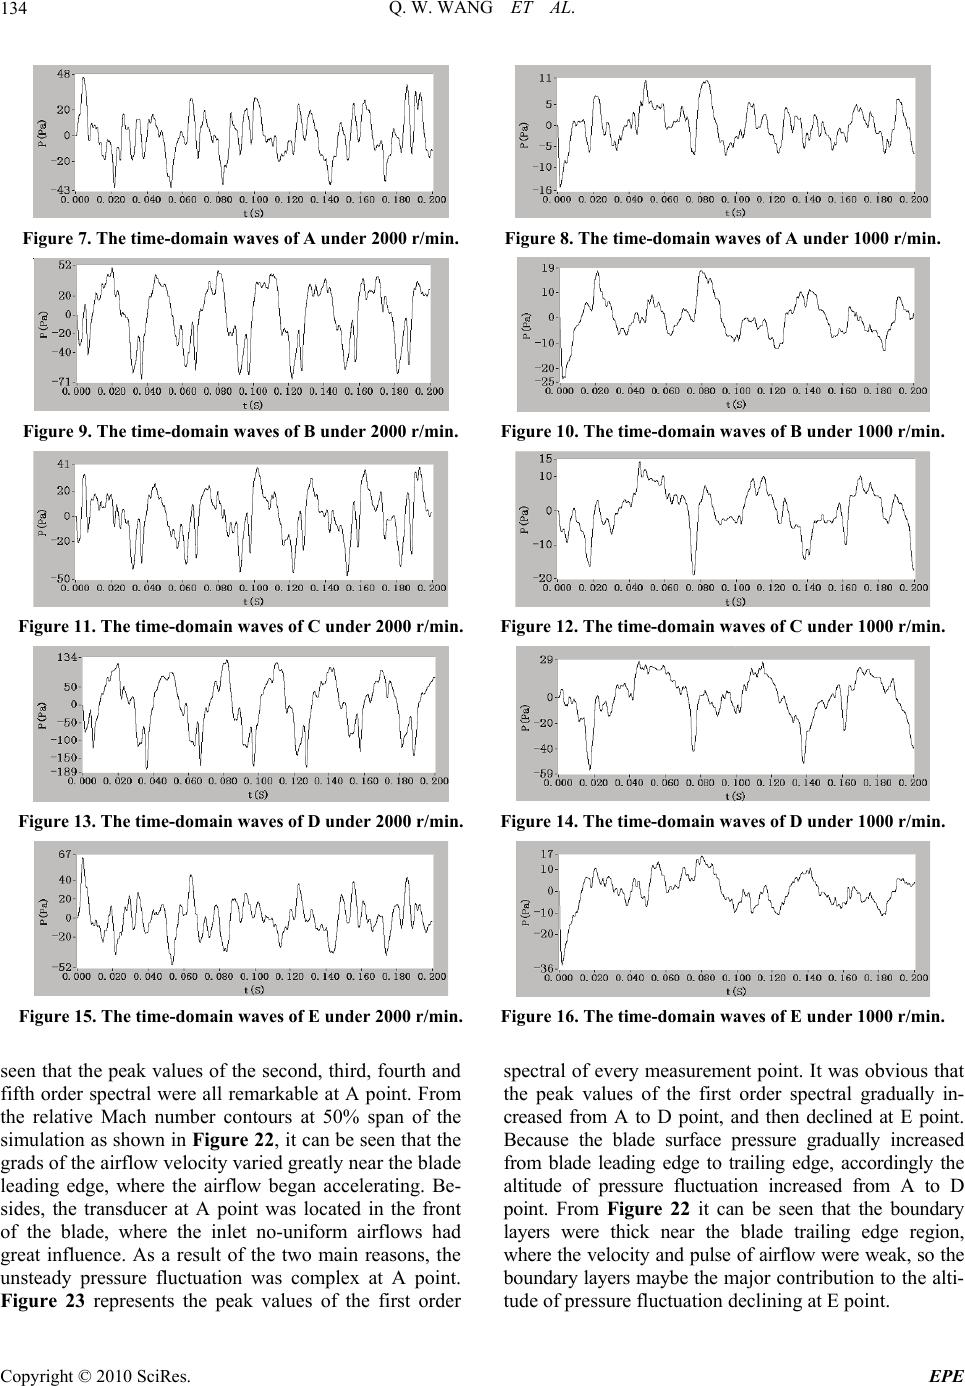 Q. W. WANG ET AL. 134 Figure 7. The time-domain waves of A under 2000 r/min. Figure 8. The time-domain waves of A under 1000 r/min. Figure 9. The time-domain waves of B under 2000 r/min. Figure 10. The time-domain waves of B under 1000 r/min. Figure 11. The time-domain waves of C under 2000 r/min.Figure 12. The time-domain waves of C under 1000 r/min. Figure 13. The time-domain waves of D under 2000 r/min.Figure 14. The time-domain waves of D under 1000 r/min. Figure 15. The time-domain waves of E under 2000 r/min. Figure 16. The time-domain waves of E under 1000 r/min. seen that the peak values of the second, third, fourth and fifth order spectral were all remarkable at A point. From the relative Mach number contours at 50% span of the simulation as shown in Figure 22, it can be seen that the grads of the airflow velocity varied greatly near the blade leading edge, where the airflow began accelerating. Be- sides, the transducer at A point was located in the front of the blade, where the inlet no-uniform airflows had great influence. As a result of the two main reasons, the unsteady pressure fluctuation was complex at A point. Figure 23 represents the peak values of the first order spectral of every measurement point. It was obvious that the peak values of the first order spectral gradually in- creased from A to D point, and then declined at E point. Because the blade surface pressure gradually increased from blade leading edge to trailing edge, accordingly the altitude of pressure fluctuation increased from A to D point. From Figure 22 it can be seen that the boundary layers were thick near the blade trailing edge region, where the velocity and pulse of airflow were weak, so the boundary layers maybe the major contribution to the alti- tude of pressure fluctuation declining at E point. C opyright © 2010 SciRes. EPE 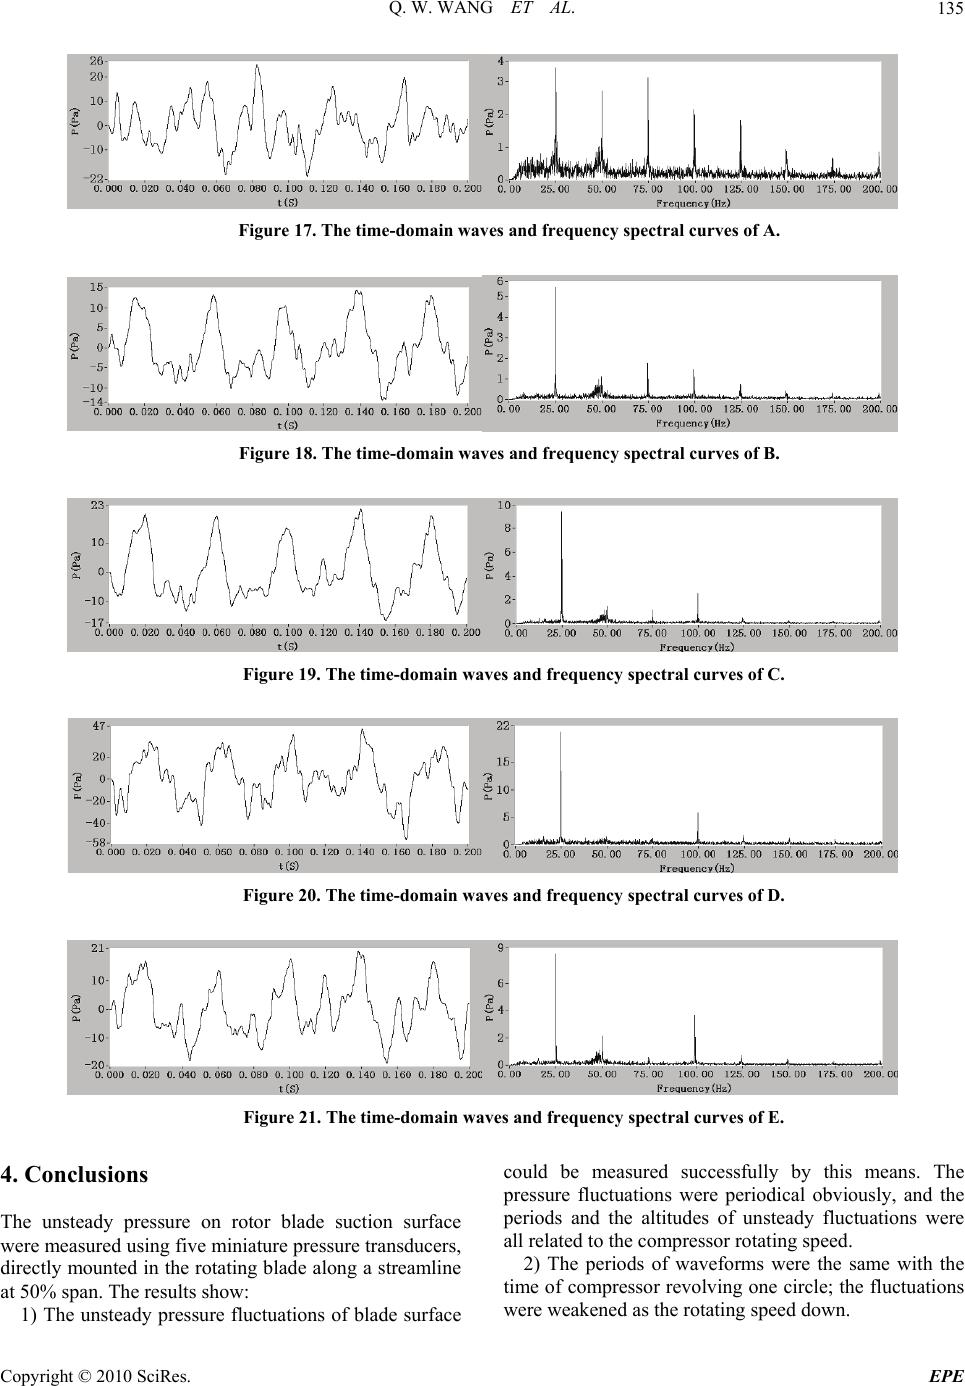 Q. W. WANG ET AL. 135 Figure 17. The time-domain waves and frequency spectral curves of A. Figure 18. The time-domain waves and frequency spectral curves of B. Figure 19. The time-domain waves and frequency spectral curves of C. Figure 20. The time-domain waves and frequency spectral curves of D. Figure 21. The time-domain waves and frequency spectral curves of E. 4. Conclusions The unsteady pressure on rotor blade suction surface were measured using five miniature pressure transducers, directly mounted in the rotating blade along a streamline at 50% span. The results show: 1) The unsteady pressure fluctuations of blade surface could be measured successfully by this means. The pressure fluctuations were periodical obviously, and the periods and the altitudes of unsteady fluctuations were all related to the compressor rotating speed. 2) The periods of waveforms were the same with the time of compressor revolving one circle; the fluctuations were weakened as the rotating speed down. C opyright © 2010 SciRes. EPE  Q. W. WANG ET AL. 136 Figure 22. The relative mach number contours at 50% span. Figure 23. The peak values of the first order spectral. 3) The pressure fluctuations gradually increased from leading edge to trailing edge. But owing to the boundary layers near the blade trailing edge region, the fluctuations declined. 5 . References [1] Y. F. Wang, J. Hu, B. N. Luo and C. P. Li, “Effects of the Upstream Blade Wakes on the Spectrum of Rotor Blade Unsteady Surface Pressure,” Journal of Aerospace Power, Vol. 21, No. 4, 2006, pp. 693-699. [2] T. Maeda and H. Kawabuchi, “Surface Pressure Meas- urement on a Rotating Blade of Field Horizontal Axis Wind Turbine in Yawed Condition,” JSME International Journal Series B, Vol. 48, No. 1, 2005, pp. 156-163. [3] T. H. H. Carolus and M. Stremel, “Blade Surface Pressure Fluctuations and Acoustic Radiation from an Axial Fan Rotor Due to Turbulent,” Acta Acustica united with Acus- tica, Vol. 88, No. 4, 2002, pp. 472-482. [4] C. H. Sieverding, T. Arts, R. Denos and J. F. Brouckaert, “Measurement Techniques for Unsteady Flows in Tur- bomachines,” Experiments in Fluids, Vol. 28, No. 4, 2000, pp. 285-321. [5] R. W. Ainsworth, R. J. Miller, R. W. Moss and S. J. Thorpe, “Unsteady Pressure Measurement,” Measure- ment Science & Technology, Vol. 11, No. 7, 2000, pp. 1055-1076. [6] S. B. Yang, G. S. Song, J. Lin and K. M. Chen, “The Design of an Opti-Eletronic Pressure Measuring System for the Measurement of the Internal Flow Field in a Ro- tating Fan,” Journal of East China University of Tech- nology, Vol. 19, No. 2, 1997, pp. 41-51. C opyright © 2010 SciRes. EPE |